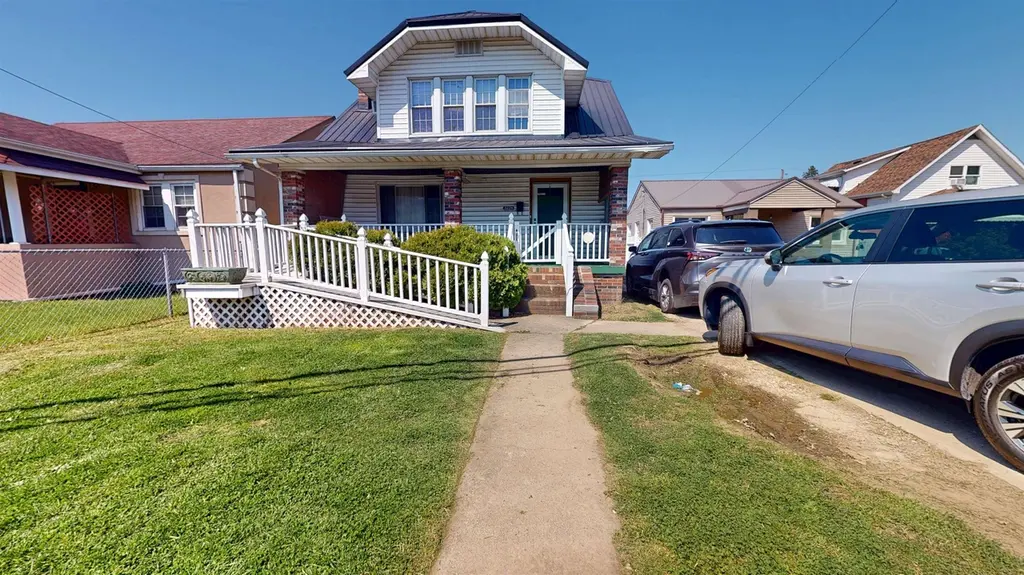
3226 3rd Ave · Huntington, WV
Flood risk 1/10 · Minimal
- FEMA flood zone
- X
- Chance of flooding over 30 yrs
- 0.0%
- Est. flood insurance / yr
- $507 – $1,088
Fire risk 5/10 · Moderate
- Est. fire insurance / yr
- $787 – $1,461
Heat risk 5/10 · Moderate
- Hot days now (above 102°F)
- 7 days/yr
- Hot days in 30 yrs
- 19 days/yr
Wind risk 2/10 · Minimal
- Chance of severe wind over 30 yrs
- 1.0%
Air-quality risk 2/10 · Minimal
- Unhealthy air days now
- 0 days/yr
- Unhealthy air days in 30 yrs
- 1 days/yr
Risk factors via First Street. Map © Google.
Why this score? — see what drove the B+ grade
The composite is a weighted blend of 9 inputs, each scored 0–100. Each bar is that input's sub-score; the figure is the points it added to the 100-point composite (weight × sub-score).
- Cash flow +30.0/30.0
- ARV discount +15.0/15.0
- 1% rule +10.0/10.0
- DSCR +10.0/10.0
- Livability +4.0/5.0
- Schools +3.0/10.0
- Rent growth +2.5/5.0
- Condition / age +2.5/5.0
- Appreciation +0.0/10.0
$74,900
🖨 Deal sheet (PDF) 📄 Offer letter ✓ Due diligence
Listing remarks
Affordable and spacious! This nice 3br, 1.5ba is waiting for new owners to bring it back to life. Step inside to the large living room that flows into the formal dining room. The kitchen is filled with beautiful cabinetry, gas stove and tile backsplash. Separate laundry/utility room with door access to the back yard. Upstairs includes three bedrooms with the primary having 2 large closets! Metal roof. Detached, two-car, oversized garage. Separate shed/outbuilding. Plenty of off street parking. Enjoy the front porch, and make this home yours!
Key facts
- Formal dining room
- Large living room
- Gas stove
Tags
Property features AI
Exterior
- Parking: Detached garage with garage door opener; Off-street parking; 2 garage spaces
- Utilities: Public water; Public sewer
- Home design: Single-family residence; Residential property; 2 stories
- Construction: Brick and vinyl siding exterior; Metal roof; Crawl space foundation; Built in prior years (year built not provided)
- Exterior features: Porch; Chain link fence; Level lot
Interior
- Kitchen: Microwave; Range; Oven
- Flooring: Vinyl; Carpet; Wood
- Bathrooms: 1 full bathroom; 1 half bathroom
- Heating & cooling: Central heating (natural gas); Central air; Ceiling fans; Window air unit(s)
- Interior features: Living room fireplace; Porch (exterior-accessible)
Neighborhood map
What this means for you Summary
Snapshot
- This is a 3-bed/1.5-bath single-family listed at $75k.
Deal economics
- At list price, monthly cash flow is $418 ($5k/yr) — positive.
- The deal already cash-flows at list — no discount required.
- Meets the 1% rule at list price ($1k rent vs $75k).
- Recommended offer: $70k (6.0% below list) — sets the bar for market timing.
- Cap rate 13.0% vs local median 6.5% in Huntington — top-decile yield for the area; either an underpriced asset or a hidden risk that comps aren't pricing in. Stress-test before assuming the spread holds.
Location & tenants
- Location reads 79/100 on livability (#16 in WV, #2,045 nationally) — a middle-class / working-renter tenant base. Strengths: amenities A+, commute A+, cost of living A+; Watch: schools C-, crime F, employment F.
- Cabell County Schools (urban): math 31% / reading 42% proficiency, ranked #13 of 55 in WV (top 24%) — families likely to look elsewhere, expect single-tenant / working-renter base with shorter leases.
- Market conditions: 32 active listings in the ZIP; 61 units permitted in Cabell County in 2024 (5 in 5+ unit buildings).
Forward outlook
- Local home prices are declining (-3.0%/yr); year-one equity from $518 of loan paydown is wiped out by about $2k of value loss. Plan a longer hold.
- At projected returns (-3.0% appreciation + 3.0% rent growth), your $21k cash investment doubles in ~6 years — after that, you're playing with house money.
Negotiation context
- It's been on market 71 days — a 6% lower offer ($70k) is reasonable based on typical stale-listing flexibility.
Risks & watch-outs
- Watch-outs: built in 1921 — expect roof / HVAC / electrical / plumbing capex.
- Climate carrying-cost: moderate wildfire risk; extreme-heat days projected 7→19/yr by 2055 (HVAC capex compounding) — expect insurance premiums to compound above CPI over the hold.
Questions for the listing agent
- It's been on market 71 days. Have you received any prior offers? Is the seller open to a 6% concession, seller financing, or rate buy-down credit?
- Built in 1921 — when were the roof, HVAC, electrical panel, plumbing, and water heater last replaced?
- Why hasn't it sold? Are there any deal-killer items the seller is aware of (foundation, flood, title, zoning, code violations)?
- Is there a deadline driving the sale (1031 exchange, divorce, estate, relocation)? That informs how much negotiation room exists.
- Crime grade is F in this area — have there been break-ins, vandalism, or insurance claims at this property in the last 3 years? What carrier currently insures it and at what premium?
- What's the average days-on-market for RENTAL listings here right now (not sales)? A rising rental-DOM trend means longer vacancies and softer asking-rent achievability than the comps imply.
- What's the recent tenant-quality profile in this submarket — average credit score on applications, eviction rate, late-payment / NSF rate, and stable-employment percentage? A property-management company in the area should have these aggregated.
- How much new for-sale + rental construction is in the pipeline within 1–3 miles? Heavy new supply typically softens prices + rents 12–24 months out; constrained supply supports both.
Investment metrics
- 1% rule
- 1.62% ✓
- Cap rate
- 12.98%
- Cash-on-cash
- 23.89%
- DSCR
- 2.06
- GRM
- 5.1
CMA / ARV
- ARV (on-the-fly)
- $108,528
- Comps found
- 12
Show comp detail 12 sales within ~0.75 mi
| Address | Dist | Beds/Ba | Sqft | Sold | Price | $/sf | Match |
|---|---|---|---|---|---|---|---|
| 101 Ferry St | 0.48mi | 3/1.5 | 1,467 (+3%) | 14mo | $83,200 | $57 | 61 |
| 307 Wilgus St | 0.64mi | 3/1.0 | 1,434 (+0%) | 8mo | $145,000 | $101 | 61 |
| 309 5th Ave | 0.36mi | 2/1.0 (-1) | 1,401 (-2%) | 15mo | $60,000 | $43 | 61 |
| 3207 3rd Ave | 0.03mi | 3/1.0 | 1,258 (-12%) | 22mo | $95,000 | $76 | 58 |
| 306 Elizabeth St | 0.54mi | 3/1.0 | 1,347 (-6%) | 9mo | $28,380 | $21 | 55 |
| 3814 3rd Ave | 0.31mi | 3/2.0 | 1,288 (-10%) | 19mo | $96,000 | $75 | 52 |
| 94 Township Road 368 | 0.62mi | 3/2.0 | 1,519 (+6%) | 10mo | $264,000 | $174 | 50 |
| 201 Jones St | 0.69mi | 3/1.0 | 1,400 (-2%) | 15mo | $194,900 | $139 | 50 |
| 227 Richmond St | 0.39mi | 3/1.5 | 1,240 (-13%) | 14mo | $123,000 | $99 | 48 |
| 302 Township Road 1533 | 0.62mi | 3/2.0 | 1,598 (+12%) | 6mo | $233,000 | $146 | 44 |
| 3118 Third Ave | 0.69mi | 3/2.0 | 1,487 (+4%) | 24mo | $99,700 | $67 | 39 |
| 535 Buffington St | 0.54mi | 3/1.0 | 1,260 (-12%) | 22mo | $55,000 | $44 | 35 |
Match score weights: distance 35% · size 25% · config 20% · recency 20%. Top-matched comps best support the ARV.
Projected returns pro-forma
-3.0% appreciation · 3.0% rent growth · sell at horizon
- IRR
- 17.1%
- Equity multiple
- 1.69×
- Total profit
- $14,489
- Equity at exit
- $11,168
- IRR
- 25.6%
- Equity multiple
- 3.24×
- Total profit
- $46,993
- Equity at exit
- $6,476
Cash invested: $20,972 (down + closing). Projections, not guarantees.
Landlord ↔ Tenant lean methodology
- Overall (STATE)
- 83 Strongly Landlord-Friendly
- State West Virginia
- 83 Strongly Landlord-Friendly · R+22
- County
- — inherits STATE
- City
- — inherits STATE
ZIP-level market 25702
- Home prices YoY
- -11.1%
- Active inventory
- 32
- Price-to-rent
- 5.1×
Monthly cashflow live
- Estimated rent
- $1,213 medium interval (Pro) →
- Mortgage (P&I)
- −$393
- Tax from tax record
- −$117 /mo · $1,400/yr
- Insurance
- −$31
- HOA
- −$0
- Vacancy / Maint / Mgmt
- −$255
- Net cashflow
- $418
Break-even live
Sensitivity live
| Price | -10% $460 | -5% $439 | +0% $418 | +5% $396 | +10% $375 |
|---|---|---|---|---|---|
| Rent | -10% $322 | -5% $370 | +0% $418 | +5% $465 | +10% $513 |
| Rate | -1.0pp $455 | -0.5pp $437 | base $418 | +0.5pp $398 | +1.0pp $378 |
UW: 25.0% down · 7.5% · 30yr · 1.5% tax · 5.0% vac · 8.0% maint · 8.0% mgmt
Financing live
Cash to close
- Down payment
- $18,725
- Closing costs
- $2,247
- Reserves months
- —
- Total cash needed
- —
Loan-product check · same deal, 3 products live
Conventional
25% down · 7.5% · 30yr
- Down + closing
- —
- Monthly P&I
- —
- Monthly cashflow
- —
- DSCR
- —
- Eligible?
- —
Personal DTI + credit; lowest rate.
DSCR
20% down · 8.5% · 30yr
- Down + closing
- —
- Monthly P&I
- —
- Monthly cashflow
- —
- DSCR
- —
- Eligible?
- —
No personal income docs; deal must DSCR.
Hard money
10% down · 12.0% · 12mo
- Down + closing
- —
- Monthly P&I
- —
- Monthly cashflow
- —
- DSCR
- —
- Eligible?
- —
Short-term bridge; refi at stabilization.
Listing history 18 events
-
2026-06-19days on market $74,900 Active 71 DOM
-
2026-06-18days on market $74,900 Active 70 DOM
-
2026-06-17days on market $74,900 Active 69 DOM
-
2026-06-16days on market $74,900 Active 68 DOM
-
2026-06-15days on market $74,900 Active 67 DOM
-
2026-06-14days on market $74,900 Active 65 DOM
-
2026-06-12days on market $74,900 Active 64 DOM
-
2026-06-09days on market $74,900 Active 61 DOM
-
2026-06-08days on market $74,900 Active 60 DOM
-
2026-06-07days on market $74,900 Active 59 DOM
-
2026-06-05days on market $74,900 Active 56 DOM
-
2026-06-03days on market $74,900 Active 55 DOM
-
2026-06-02days on market $74,900 Active 54 DOM
-
2026-06-01days on market $74,900 Active 53 DOM
-
2026-05-31days on market $74,900 Active 52 DOM
-
2026-05-30days on market $74,900 Active 51 DOM
-
2026-05-11price $74,900
-
2026-04-10$89,900 Active
ⓘ Source: listings_history table (triggers on properties + properties_extension) + one-shot
backfill from property_details.listing_events for pre-trigger history.
Tax reassessment forecast WV · Resets to sale price
- Current annual tax
- $1,400 · $117/mo
- Projected year-2 tax
- $1,400 · $117/mo
- Expected delta
- $0/yr ($0/mo · 0.0%)
ⓘ Screening estimate from a state-policy table — verify with the county assessor before closing.
Climate risk First Street
- Flood 1/10 Low FEMA zone X · 0% chance over 30 yrs
- Wildfire 5/10 Major
- Heat 5/10 Major 7 d/yr ≥102°F today · 19 d/yr by 30 yrs out
- Wind 2/10 Low 100% chance of damaging wind over 30 yrs
- Air quality 2/10 Low 0 unhealthy d/yr today · 1 by 30 yrs out
Nearby sold comps map
Loading sold comps map…
Walkable amenities ~0.75 mi
Loading nearby amenities…
Taxation est. · year 1
- Rental income
- $14,555
- − Mortgage interest
- −$4,196
- − Property taxes
- −$1,400
- − Insurance
- −$374
- − Repairs & maintenance
- −$1,164
- − Management
- −$1,164
- − Depreciation
- −$2,179
- Taxable income
- $4,077
- Est. tax owed @ 24.0%
- −$979
- After-tax cash flow
- $4,032/yr
For passive investors: Depreciation is non-cash, so a rental often shows a tax loss while cash-flowing — sheltering income. Rental losses are passive: they offset passive income freely, and up to $25,000/yr can offset ordinary (W-2) income if you actively participate and your MAGI is under $100k (phasing out to $0 by $150k); unused losses carry forward. On sale, claimed depreciation is recaptured at up to 25%, and gains may owe capital-gains tax (a 1031 exchange can defer both). Figures are a year-1 estimate at your 24.0% rate — not tax advice; consult a CPA.
Schools (NCES district)
- District
- Cabell County Schools
- NCES district ID
- 5400180
- Math proficiency
- 31% ▼ -7.00%
- Reading proficiency
- 42% ▼ -6.00%
- Median HH income
- $36,426
- Composite
- 30.26/100
- National rank
- #6285
- State rank
- #13 of 55 in WV
Livability — Huntington
- Score
- 79/100
- State rank
- #16
- US rank
- #2045
Category grades
Schools grade is shown separately in the Schools card above.
Census & demographics
- Census place
- Huntington, WV
- City population
- 25,795
- Population (ZIP)
- 7,164
Population outlook (Cabell County) Hauer SSP2
- Today (2025)
- 97,574 people
- By 2030
- 98,060 · +0.5%
- By 2040
- 98,817 · +1.3%
- By 2050
- 100,185 · +2.7%
- By 2075
- 105,895 · +8.5%
- By 2100
- 105,948 · +8.6%
Race, ethnicity, and origin ACS 2023
- Neighborhood character
- Predominantly White (90%)
- Race & ethnicity
- White 90% Two or more races 5% Hispanic / Latino 2% Black 2% Asian 1%
- Common ancestry
- Lithuanian 1% Slovak 1% Italian 1%
- Foreign-born
- 2% · Canada, China
- Languages at home
- 96% English-only · Spanish 2% German/W. Germanic 1% Chinese 1%
Political lean MEDSL · Cabell
- 2024 margin
- Strong R (+21.9) · D 38.0% · R 59.9% · Other 2.0%
- 2008→2024 swing
- -11.8pp toward R · 2008: -10.1pp · 2024: -21.9pp
- All cycles
- 2024: R+21.9 2020: R+18.0 2016: R+25.5 2012: R+13.9 2008: R+10.1
Not yet ingested
- Civics
- —
Market trends
- HPI YoY
- ▼ -21.03%
- Current HPI
- 168.2172
- Rent YoY
- —
- Metro
- —
- State GDP YoY
- —
- F500 in state
- 0
Price history
-16.7% since first listed2 events — show timeline
- 2026-05-11 Price Changed $74,900 HBRMLS
- 2026-04-10 Listed $89,900 HBRMLS
Property tax history
+18.1%/yrLatest (2025): $1,400 · +14.7% YoY. Source: county tax records.
Cash-flow waterfall
monthlySold comps — $/sqft
last 12 mo · ≤1 miLoading sold comps…