15342 Forest Ranch Way · Forest Ranch, CA
Flood risk 1/10 · Minimal
- FEMA flood zone
- X (unshaded)
- Chance of flooding over 30 yrs
- 0.0%
- Est. flood insurance / yr
- $507 – $1,088
Fire risk 8/10 · Major
- Est. fire insurance / yr
- $659 – $1,223
Heat risk 4/10 · Minor
- Hot days now (above 98°F)
- 6 days/yr
- Hot days in 30 yrs
- 14 days/yr
Wind risk 1/10 · Minimal
- Chance of severe wind over 30 yrs
- —
Air-quality risk 10/10 · Severe
- Unhealthy air days now
- 37 days/yr
- Unhealthy air days in 30 yrs
- 44 days/yr
Risk factors via First Street. Map © Google.
Why this score? — see what drove the C- grade
The composite is a weighted blend of 9 inputs, each scored 0–100. Each bar is that input's sub-score; the figure is the points it added to the 100-point composite (weight × sub-score).
- Cash flow +18.0/30.0
- ARV discount +15.0/15.0
- DSCR +5.6/10.0
- Schools +4.6/10.0
- 1% rule +3.6/10.0
- Livability +3.0/5.0
- Rent growth +2.5/5.0
- Condition / age +2.5/5.0
- Appreciation +0.0/10.0
$179,900
🖨 Deal sheet 📄 Offer letter ✓ Due diligence
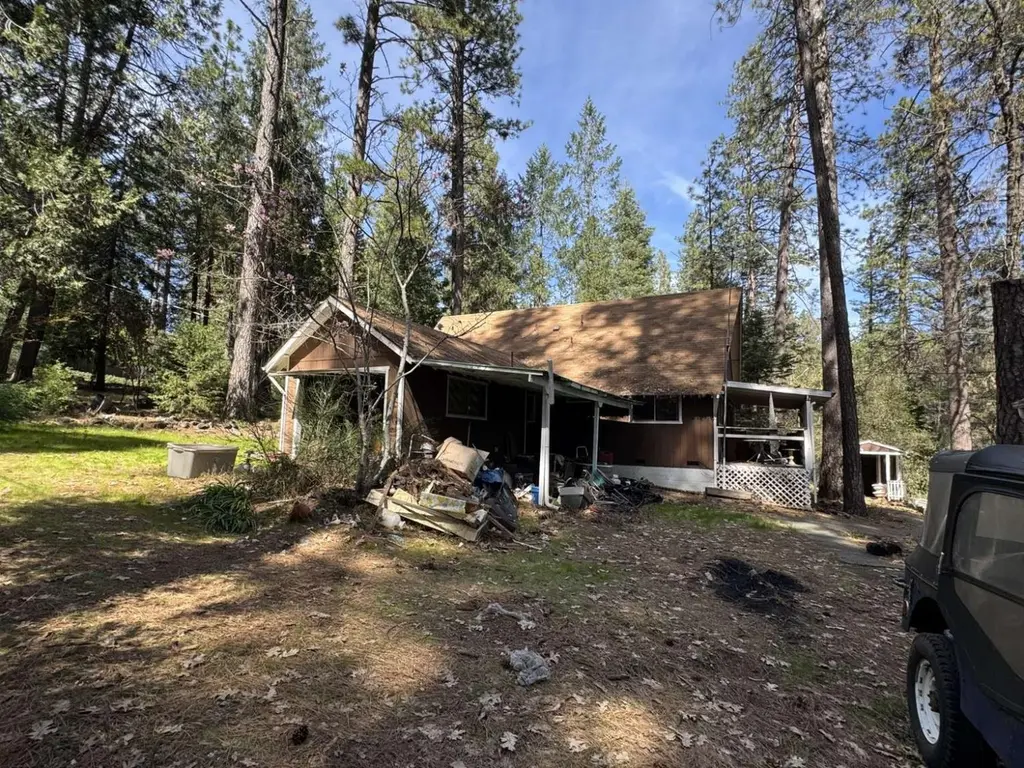
Listing remarks
Discover a unique opportunity at 15342 Forest Ranch Way. This 1,320 sq. ft. two-story structure features three bedrooms, two bathrooms, and sits on nearly half an acre. The interior includes a fireplace, cabinets, and a range, alongside a central heating and cooling system and water heater. Located in the scenic foothills of Butte County, the property offers a private, treed setting. This is an ideal project for those looking to invest in a space with significant potential and customize a mountain retreat to their exact specifications.
Key facts
- Mountain retreat
- Two story structure
- 0.48 acre lot
Tags
Neighborhood map
What this means for you Summary
Snapshot
- This is a 3-bed/2.0-bath single-family listed at $180k.
Deal economics
- At list price, monthly cash flow is $155 ($2k/yr) — positive.
- The deal already cash-flows at list — no discount required.
- To meet the 1% rule (rent ≥ 1% of price), the offer needs to be $155k (13.6% below list).
- Recommended offer: $155k (13.6% below list) — sets the bar for 1% rule.
Location & tenants
- Location reads 60/100 on livability (#574 in CA) — a middle-class / working-renter tenant base. Strengths: crime A+, employment A+, housing A+; Watch: amenities F, commute F, cost of living F.
- Chico Unified (urban): math 40% / reading 70% proficiency, ranked #117 of 517 in CA (top 23%) — acceptable for families but not a draw, mixed tenant base, ~2y average lease.
- Market conditions: 35 active listings in the ZIP; 946 units permitted in Butte County in 2024 (254 in 5+ unit buildings).
Forward outlook
- Local home prices are declining (-3.0%/yr); year-one equity from $1k of loan paydown is wiped out by about $5k of value loss. Plan a longer hold.
- Butte County population projected at +10% by 2050 — modest demand growth; plan on rents tracking national, not racing it.
Negotiation context
- It's been on market 92 days — a 9% lower offer ($164k) is reasonable based on typical stale-listing flexibility.
Risks & watch-outs
- Climate carrying-cost: severe wildfire risk — expect insurance premiums to compound above CPI over the hold.
Questions for the listing agent
- It's been on market 92 days. Have you received any prior offers? Is the seller open to a 14% concession, seller financing, or rate buy-down credit?
- Built in 1974 — when were the roof, HVAC, electrical panel, plumbing, and water heater last replaced?
- Why hasn't it sold? Are there any deal-killer items the seller is aware of (foundation, flood, title, zoning, code violations)?
- Is there a deadline driving the sale (1031 exchange, divorce, estate, relocation)? That informs how much negotiation room exists.
- Schools are B-rated — typically a magnet for longer-tenancy family renters. What's the average tenant stay here, and is there a school-zone premium baked into asking?
- What's the average days-on-market for RENTAL listings here right now (not sales)? A rising rental-DOM trend means longer vacancies and softer asking-rent achievability than the comps imply.
- What's the recent tenant-quality profile in this submarket — average credit score on applications, eviction rate, late-payment / NSF rate, and stable-employment percentage? A property-management company in the area should have these aggregated.
- How much new for-sale + rental construction is in the pipeline within 1–3 miles? Heavy new supply typically softens prices + rents 12–24 months out; constrained supply supports both.
Investment metrics
- 1% rule
- 0.86% ✗
- Cap rate
- 7.32%
- Cash-on-cash
- 3.68%
- DSCR
- 1.16
- GRM
- 9.6
CMA / ARV
- ARV (median comp)
- $348,478
- List price
- $179,900
- Delta
- -48.38%
- Verdict
- UNDERPRICED
- Comps
- 20 within 1.0 mi
Show comp detail 2 sales within ~0.75 mi
| Address | Dist | Beds/Ba | Sqft | Sold | Price | $/sf | Match |
|---|---|---|---|---|---|---|---|
| 4709 Hartley Dr | 0.17mi | 3/2.0 | 1,380 (+4%) | 12mo | $305,000 | $221 | 75 |
| 4722 Heidi Way | 0.37mi | 2/2.0 (-1) | 1,432 (+8%) | 9mo | $300,000 | $209 | 56 |
Match score weights: distance 35% · size 25% · config 20% · recency 20%. Top-matched comps best support the ARV.
Projected returns pro-forma
-3.0% appreciation · 3.0% rent growth · sell at horizon
- IRR
- -10.6%
- Equity multiple
- 0.62×
- Total profit
- $-19,389
- Equity at exit
- $26,824
- IRR
- -1.3%
- Equity multiple
- 0.91×
- Total profit
- $-4,536
- Equity at exit
- $15,554
Cash invested: $50,372 (down + closing). Projections, not guarantees.
Landlord ↔ Tenant lean methodology
- Overall (STATE)
- 18 Strongly Tenant-Friendly
- State California
- 18 Strongly Tenant-Friendly · D+13
- County
- — inherits STATE
- City
- — inherits STATE
ZIP-level market 95942
- Home prices YoY
- -5.9%
- Active inventory
- 35
- Price-to-rent
- 9.6×
Monthly cashflow live
- Estimated rent
- $1,555 medium interval (Pro) →
- Mortgage (P&I)
- −$943
- Tax from tax record
- −$55 /mo · $662/yr
- Insurance
- −$75
- HOA
- −$0
- Vacancy / Maint / Mgmt
- −$326
- Net cashflow
- $155
Break-even live
UW: 25.0% down · 7.5% · 30yr · 1.5% tax · 5.0% vac · 8.0% maint · 8.0% mgmt
Financing live
Cash to close
- Down payment
- $44,975
- Closing costs
- $5,397
- Reserves months
- —
- Total cash needed
- —
Loan-product check · same deal, 3 products live
Conventional
25% down · 7.5% · 30yr
- Down + closing
- —
- Monthly P&I
- —
- Monthly cashflow
- —
- DSCR
- —
- Eligible?
- —
Personal DTI + credit; lowest rate.
DSCR
20% down · 8.5% · 30yr
- Down + closing
- —
- Monthly P&I
- —
- Monthly cashflow
- —
- DSCR
- —
- Eligible?
- —
No personal income docs; deal must DSCR.
Hard money
10% down · 12.0% · 12mo
- Down + closing
- —
- Monthly P&I
- —
- Monthly cashflow
- —
- DSCR
- —
- Eligible?
- —
Short-term bridge; refi at stabilization.
Listing history 15 events
-
2026-06-19days on market $179,900 Active 92 DOM
-
2026-06-18days on market $179,900 Active 91 DOM
-
2026-06-17days on market $179,900 Active 90 DOM
-
2026-06-16days on market $179,900 Active 89 DOM
-
2026-06-15days on market $179,900 Active 88 DOM
-
2026-06-14days on market $179,900 Active 86 DOM
-
2026-06-13days on market $179,900 Active 85 DOM
-
2026-06-10days on market $179,900 Active 83 DOM
-
2026-06-08days on market $179,900 Active 81 DOM
-
2026-06-07days on market $179,900 Active 80 DOM
-
2026-06-05days on market $179,900 Active 77 DOM
-
2026-06-02days on market $179,900 Active 75 DOM
-
2026-06-01days on market $179,900 Active 74 DOM
-
2026-05-31days on market $179,900 Active 73 DOM
-
2026-05-30days on market $179,900 Active 72 DOM
ⓘ Source: listings_history table (triggers on properties + properties_extension) + one-shot
backfill from property_details.listing_events for pre-trigger history.
Tax reassessment forecast CA · Resets to sale price
- Current annual tax
- $662 · $55/mo
- Projected year-2 tax
- $1,367 · $114/mo
- Expected delta
- +$705/yr (+$59/mo · 106.6%)
ⓘ Screening estimate from a state-policy table — verify with the county assessor before closing.
Climate risk First Street
- Flood 1/10 Low FEMA zone X (unshaded) · 0% chance over 30 yrs
- Wildfire 8/10 Severe
- Heat 4/10 Moderate 6 d/yr ≥98°F today · 14 d/yr by 30 yrs out
- Wind 1/10 Low
- Air quality 10/10 Extreme 37 unhealthy d/yr today · 44 by 30 yrs out
Nearby sold comps map
Loading sold comps map…
Walkable amenities ~0.75 mi
Loading nearby amenities…
Taxation est. · year 1
- Rental income
- $18,654
- − Mortgage interest
- −$10,077
- − Property taxes
- −$662
- − Insurance
- −$900
- − Repairs & maintenance
- −$1,492
- − Management
- −$1,492
- − Depreciation
- −$5,233
- Taxable loss
- −$1,202
- Est. tax savings @ 24.0%
- +$289
- After-tax cash flow
- $2,143/yr
For passive investors: Depreciation is non-cash, so a rental often shows a tax loss while cash-flowing — sheltering income. Rental losses are passive: they offset passive income freely, and up to $25,000/yr can offset ordinary (W-2) income if you actively participate and your MAGI is under $100k (phasing out to $0 by $150k); unused losses carry forward. On sale, claimed depreciation is recaptured at up to 25%, and gains may owe capital-gains tax (a 1031 exchange can defer both). Figures are a year-1 estimate at your 24.0% rate — not tax advice; consult a CPA.
Schools (NCES district)
- District
- Chico Unified
- NCES district ID
- 0608370
- Math proficiency
- 40% ▼ -2.00%
- Reading proficiency
- 70% ▲ 14.00%
- Median HH income
- $46,223
- Composite
- 46.45/100
- National rank
- #2443
- State rank
- #117 of 517 in CA
Livability — Forest Ranch
- Score
- 60/100
- State rank
- #574
- US rank
- #18768
Category grades
Schools grade is shown separately in the Schools card above.
Census & demographics
- Census place
- Forest Ranch, CA
- Population (ZIP)
- 2,190
Population outlook (Butte County) Hauer SSP2
- Today (2025)
- 237,527 people
- By 2030
- 243,804 · +2.6%
- By 2040
- 253,899 · +6.9%
- By 2050
- 262,561 · +10.5%
- By 2075
- 283,709 · +19.4%
- By 2100
- 282,689 · +19.0%
Race, ethnicity, and origin ACS 2023
- Neighborhood character
- Predominantly White (87%)
- Race & ethnicity
- White 87% Hispanic / Latino 10% Two or more races 8%
- Hispanic origin (detail)
- Mexican 3%
- Common ancestry
- Slovak 3% Lithuanian 3% Russian 3%
- Foreign-born
- 7% · Canada
- Languages at home
- 92% English-only · Spanish 4% Arabic 2%
Political lean MEDSL · Butte
- 2024 margin
- Toss-up / Even · D 46.8% · R 49.9% · Other 3.3%
- 2008→2024 swing
- -5.5pp toward R · 2008: 2.4pp · 2024: -3.1pp
- All cycles
- 2024: R+3.1 2020: D+1.7 2016: R+4.0 2012: R+3.9 2008: D+2.4
Not yet ingested
- Civics
- —
Market trends
- HPI YoY
- ▼ -14.81%
- Current HPI
- 236.6388
- Rent YoY
- —
- Metro
- —
- State GDP YoY
- ▲ 3.21%
- F500 in state
- 116
Industry mix (Fortune 500 HQ in CA)
| Industry | F500 HQs | Revenue |
|---|---|---|
| Technology | 27 | $1,492B |
|
||
| Financial Services | 3 | $174B |
|
||
| Retail | 3 | $44B |
|
||
| Insurance | 3 | $26B |
|
||
| Media / Entertainment | 2 | $115B |
|
||
| Pharmaceuticals / Biotech | 2 | $62B |
|
||
Property tax history
+2.7%/yrLatest (2025): $662 · +6.3% YoY. Source: county tax records.
Cash-flow waterfall
monthlySold comps — $/sqft
last 12 mo · ≤1 miLoading sold comps…