 Duplex
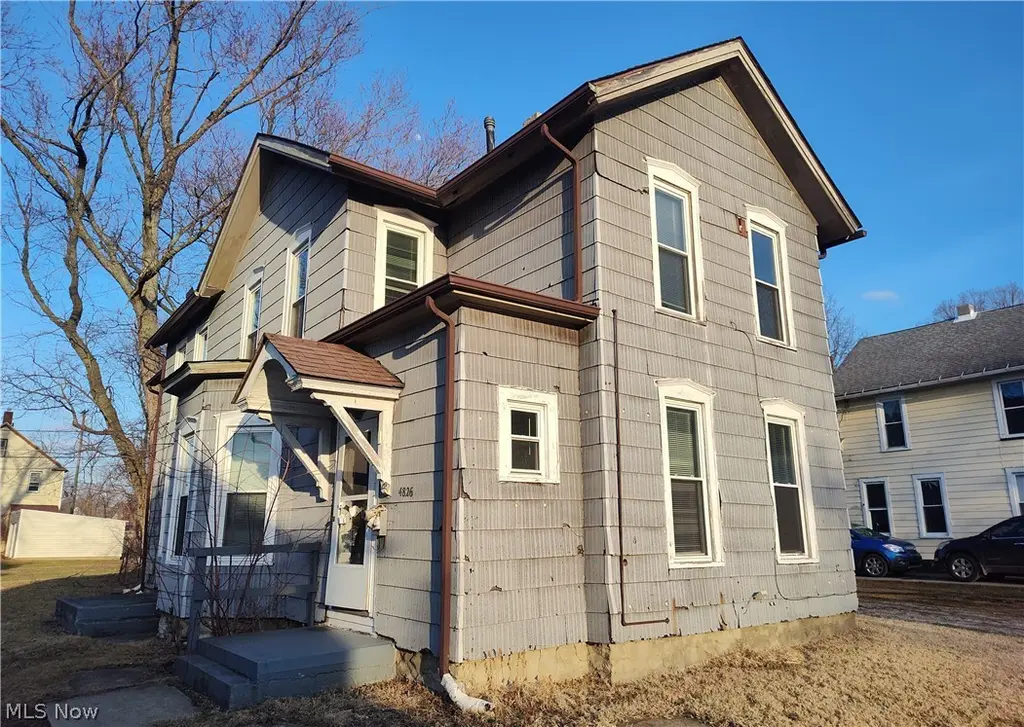
4826 Cornell Ave · Ashtabula, OH
Flood risk 1/10 · Minimal
- FEMA flood zone
- X (unshaded)
- Chance of flooding over 30 yrs
- 0.0%
- Est. flood insurance / yr
- $473 – $860
Fire risk 1/10 · Minimal
- Est. fire insurance / yr
- $713 – $1,323
Heat risk 3/10 · Minor
- Hot days now (above 93°F)
- 7 days/yr
- Hot days in 30 yrs
- 18 days/yr
Wind risk 1/10 · Minimal
- Chance of severe wind over 30 yrs
- —
Air-quality risk 3/10 · Minor
- Unhealthy air days now
- 2 days/yr
- Unhealthy air days in 30 yrs
- 5 days/yr
Risk factors via First Street. Map © Google.
Why this score? — see what drove the C+ grade
The composite is a weighted blend of 9 inputs, each scored 0–100. Each bar is that input's sub-score; the figure is the points it added to the 100-point composite (weight × sub-score).
- Cash flow +30.0/30.0
- DSCR +10.0/10.0
- 1% rule +9.3/10.0
- Livability +3.6/5.0
- Rent growth +2.5/5.0
- Condition / age +2.5/5.0
- Schools +2.4/10.0
- ARV discount +0.0/15.0
- Appreciation +0.0/10.0
$114,900
🖨 Deal sheet 📄 Offer letter ✓ Due diligence
Multi-family units
County records classify this as Multi-Family (2-4 Unit). Listing-text estimate: 2 units. confirmed
Listing remarks MLS
Clean slate ready for you to make this duplex a nice addition to your portfolio. Plenty of possibilities with this up and down duplex featuring 2 bedrooms and 1 bathroom in each unit, separate utilities, furnaces, and hot water tanks. Updates include new furnaces in ’08 and ’09, newer ductwork throughout, pex water lines, PVC schedule 40 sanitary lines, windows, roof in approx. 2008 and electrical. Whether you want to live in one side and rent the other or add this property to your investment portfolio, you make the call. Set your own rules and decide how much income you would like the property to produce. Call today for your personal tour!"
Key facts
- 0.24 acre lot
- Parking
- Built 1880
Neighborhood map
What this means for you Summary
Snapshot
- This is a 2 × 2-bed/1.0-bath units multifamily listed at $115k.
Deal economics
- At list price, monthly cash flow is $554 ($7k/yr) — positive. Per door: $277/mo.
- The deal already cash-flows at list — no discount required.
- Meets the 1% rule at list price ($2k rent vs $115k).
- Recommended offer: $105k (9.0% below list) — sets the bar for market timing.
- Cap rate 12.1% vs local median 8.2% in Ashtabula — top-decile yield for the area; either an underpriced asset or a hidden risk that comps aren't pricing in. Stress-test before assuming the spread holds.
Location & tenants
- Location reads 71/100 on livability (#420 in OH) — a middle-class / working-renter tenant base. Strengths: cost of living A+, health & safety A+, housing A; Watch: schools C-, amenities F, commute F.
- Ashtabula Area City (town): math 24% / reading 35% proficiency, ranked #588 of 656 in OH (top 90%) — low school quality limits family demand, transient renter base, plan for 1-2y turnover; 63% free/reduced lunch — lower-income household profile, screen leases tightly.
- Market conditions: 162 active listings in the ZIP; 155 units permitted in Ashtabula County in 2024 (0 in 5+ unit buildings).
- This rent runs 40% of the median local income ($50k/yr) — at the standard rent-burdened threshold; future hikes will face affordability resistance.
Forward outlook
- Local home prices are declining (-3.0%/yr); year-one equity from $794 of loan paydown is wiped out by about $3k of value loss. Plan a longer hold.
- Ashtabula County population projected at -22% by 2050 — secular population decline; favor cash flow + early exit over multi-decade hold.
- At projected returns (-3.0% appreciation + 3.0% rent growth), your $32k cash investment doubles in ~6 years — after that, you're playing with house money.
Negotiation context
- It's been on market 94 days — a 9% lower offer ($105k) is reasonable based on typical stale-listing flexibility.
- 5 sale attempts since 20y ago with the ask held roughly flat each time — persistent listings suggest the price (not the market) is what's stuck; bring a comps-based counter.
- Current owner paid $76k; list at $115k implies a 51% gain — meaningful room to come down on a strong offer.
Risks & watch-outs
- Watch-outs: built in 1880 — expect roof / HVAC / electrical / plumbing capex.
Questions for the listing agent
- It's been on market 94 days. Have you received any prior offers? Is the seller open to a 9% concession, seller financing, or rate buy-down credit?
- Can we see the unit-by-unit rent roll, current vacancy, and any below-market leases? What's the average tenancy length?
- What capital expenditures (roof, boiler, parking lot, exteriors) have been made in the last 5 years, and what's planned in the next 2?
- Built in 1880 — when were the roof, HVAC, electrical panel, plumbing, and water heater last replaced?
- Why hasn't it sold? Are there any deal-killer items the seller is aware of (foundation, flood, title, zoning, code violations)?
- Is there a deadline driving the sale (1031 exchange, divorce, estate, relocation)? That informs how much negotiation room exists.
- What's the average days-on-market for RENTAL listings here right now (not sales)? A rising rental-DOM trend means longer vacancies and softer asking-rent achievability than the comps imply.
- What's the recent tenant-quality profile in this submarket — average credit score on applications, eviction rate, late-payment / NSF rate, and stable-employment percentage? A property-management company in the area should have these aggregated.
- How much new apartment / multifamily construction is in the pipeline within 1–3 miles? Heavy new supply (>2% of stock underway) typically softens rents 12–24 months out; light construction supports rent growth.
Investment metrics
- 1% rule
- 1.43% ✓
- Cap rate
- 12.08%
- Cash-on-cash
- 20.65%
- DSCR
- 1.92
- GRM
- 5.8
CMA / ARV
- ARV (median comp)
- $88,438
- List price
- $114,900
- Delta
- 29.92%
- Verdict
- OVERPRICED
- Comps
- 20 within 1.0 mi
Show comp detail 4 sales within ~0.75 mi
| Address | Dist | Beds/Ba | Sqft | Sold | Price | $/sf | Match |
|---|---|---|---|---|---|---|---|
| 863 W Prospect Cir | 0.19mi | 5/2.0 (+1) | 2,085 (+8%) | 6mo | $130,000 | $62 | 68 |
| 155 Riverside Dr | 0.65mi | 4/2.0 | 1,926 (0%) | 15mo | $65,500 | $34 | 57 |
| 5105 Chestnut Ave | 0.43mi | 5/2.0 (+1) | 2,072 (+8%) | 8mo | $140,000 | $68 | 56 |
| 516 W 46th St | 0.39mi | 4/3.0 | 2,030 (+5%) | 19mo | $150,000 | $74 | 53 |
Match score weights: distance 35% · size 25% · config 20% · recency 20%. Top-matched comps best support the ARV.
Projected returns pro-forma
-3.0% appreciation · 3.0% rent growth · sell at horizon
- IRR
- 13.0%
- Equity multiple
- 1.52×
- Total profit
- $16,643
- Equity at exit
- $17,132
- IRR
- 21.9%
- Equity multiple
- 2.86×
- Total profit
- $59,879
- Equity at exit
- $9,934
Cash invested: $32,172 (down + closing). Projections, not guarantees.
Landlord ↔ Tenant lean methodology
- Overall (STATE)
- 73 Landlord-Friendly
- State Ohio
- 73 Landlord-Friendly · R+6
- County
- — inherits STATE
- City
- — inherits STATE
ZIP-level market 44004
- Home prices YoY
- -30.5%
- Active inventory
- 162
- Price-to-rent
- 11.7×
Monthly cashflow live
- Estimated rent
- $1,641 medium interval (Pro) →
- Mortgage (P&I)
- −$603
- Tax from tax record
- −$92 /mo · $1,107/yr
- Insurance
- −$48
- HOA
- −$0
- Vacancy / Maint / Mgmt
- −$345
- Net cashflow
- $554
Break-even live
2-unit breakdown (identical units grouped — click to expand)
| Units | Beds | Baths | Est. rent |
|---|---|---|---|
| 2× units | 2 | 1 | $1,640 |
| #1 | 2 | 1 | $820 |
| #2 | 2 | 1 | $820 |
| Total (2 units) | $1,641 | ||
UW: 25.0% down · 7.5% · 30yr · 1.5% tax · 5.0% vac · 8.0% maint · 8.0% mgmt
Financing live
Cash to close
- Down payment
- $28,725
- Closing costs
- $3,447
- Reserves months
- —
- Total cash needed
- —
Loan-product check · same deal, 3 products live
Conventional
25% down · 7.5% · 30yr
- Down + closing
- —
- Monthly P&I
- —
- Monthly cashflow
- —
- DSCR
- —
- Eligible?
- —
Personal DTI + credit; lowest rate.
DSCR
20% down · 8.5% · 30yr
- Down + closing
- —
- Monthly P&I
- —
- Monthly cashflow
- —
- DSCR
- —
- Eligible?
- —
No personal income docs; deal must DSCR.
Hard money
10% down · 12.0% · 12mo
- Down + closing
- —
- Monthly P&I
- —
- Monthly cashflow
- —
- DSCR
- —
- Eligible?
- —
Short-term bridge; refi at stabilization.
Listing history 31 events
-
2026-06-18days on market $114,900 Active 94 DOM
-
2026-06-17days on market $114,900 Active 93 DOM
-
2026-06-16days on market $114,900 Active 92 DOM
-
2026-06-15days on market $114,900 Active 91 DOM
-
2026-06-13days on market $114,900 Active 89 DOM
-
2026-06-12days on market $114,900 Active 88 DOM
-
2026-06-09days on market $114,900 Active 85 DOM
-
2026-06-08days on market $114,900 Active 84 DOM
-
2026-06-07days on market $114,900 Active 83 DOM
-
2026-06-07days on market $114,900 Active 82 DOM
-
2026-06-04days on market $114,900 Active 79 DOM
-
2026-06-02days on market $114,900 Active 78 DOM
-
2026-06-01days on market $114,900 Active 77 DOM
-
2026-05-31days on market $114,900 Active 76 DOM
-
2026-03-16$119,900 Active 666-char remark
Show marketing remark (666 chars)
Clean slate ready for you to make this duplex a nice addition to your portfolio. Plenty of possibilities with this up and down duplex featuring 2 bedrooms and 1 bathroom in each unit, separate utilities, furnaces, and hot water tanks. Updates include new furnaces in ’08 and ’09, newer ductwork throughout, pex water lines, PVC schedule 40 sanitary lines, windows, roof in approx. 2008 and electrical. Whether you want to live in one side and rent the other or add this property to your investment portfolio, you make the call. Set your own rules and decide how much income you would like the property to produce. Call today for your personal tour!"
-
2023-03-22status Pending 276-char remark
Show marketing remark (276 chars)
Great two family home! Both units have bright living rooms with ample amounts of natural light. Kitchens and bathrooms have newly updated vinyl plank flooring. Each unit has two bedrooms and a full bath with plenty of storage. Both units are occupied with leases through 2024.
-
2023-03-22soldstatus $76,000 Closed 276-char remark
Show marketing remark (276 chars)
Great two family home! Both units have bright living rooms with ample amounts of natural light. Kitchens and bathrooms have newly updated vinyl plank flooring. Each unit has two bedrooms and a full bath with plenty of storage. Both units are occupied with leases through 2024.
-
2023-03-22soldstatus $76,000
Show marketing remark (276 chars)
Great two family home! Both units have bright living rooms with ample amounts of natural light. Kitchens and bathrooms have newly updated vinyl plank flooring. Each unit has two bedrooms and a full bath with plenty of storage. Both units are occupied with leases through 2024.
-
2023-03-07historical Contingent 276-char remark
Show marketing remark (276 chars)
Great two family home! Both units have bright living rooms with ample amounts of natural light. Kitchens and bathrooms have newly updated vinyl plank flooring. Each unit has two bedrooms and a full bath with plenty of storage. Both units are occupied with leases through 2024.
-
2023-02-27$75,000 Active 276-char remark
Show marketing remark (276 chars)
Great two family home! Both units have bright living rooms with ample amounts of natural light. Kitchens and bathrooms have newly updated vinyl plank flooring. Each unit has two bedrooms and a full bath with plenty of storage. Both units are occupied with leases through 2024.
-
2017-05-01soldstatus $49,500 Sold
-
2017-05-01soldstatus $49,500
-
2017-04-08historical
-
2017-03-22historical Contingent
-
2016-10-15$57,500 Active
-
2007-08-16historical
-
2007-02-16$86,000
-
2006-12-10historical
-
2006-06-10$79,900
-
2003-05-02soldstatus $33,500
-
1993-06-29soldstatus $21,000
ⓘ Source: listings_history table (triggers on properties + properties_extension) + one-shot
backfill from property_details.listing_events for pre-trigger history.
Tax reassessment forecast OH · Partial reset (capped growth)
- Current annual tax
- $1,107 · $92/mo
- Projected year-2 tax
- $1,449 · $121/mo
- Expected delta
- +$343/yr (+$29/mo · 31.0%)
ⓘ Screening estimate from a state-policy table — verify with the county assessor before closing.
Climate risk First Street
- Flood 1/10 Low FEMA zone X (unshaded) · 0% chance over 30 yrs
- Wildfire 1/10 Low
- Heat 3/10 Moderate 7 d/yr ≥93°F today · 18 d/yr by 30 yrs out
- Wind 1/10 Low
- Air quality 3/10 Moderate 2 unhealthy d/yr today · 5 by 30 yrs out
Nearby sold comps map
Loading sold comps map…
Walkable amenities ~0.75 mi
Loading nearby amenities…
Taxation est. · year 1
- Rental income
- $19,692
- − Mortgage interest
- −$6,436
- − Property taxes
- −$1,107
- − Insurance
- −$574
- − Repairs & maintenance
- −$1,575
- − Management
- −$1,575
- − Depreciation
- −$3,343
- Taxable income
- $5,082
- Est. tax owed @ 24.0%
- −$1,220
- After-tax cash flow
- $5,426/yr
For passive investors: Depreciation is non-cash, so a rental often shows a tax loss while cash-flowing — sheltering income. Rental losses are passive: they offset passive income freely, and up to $25,000/yr can offset ordinary (W-2) income if you actively participate and your MAGI is under $100k (phasing out to $0 by $150k); unused losses carry forward. On sale, claimed depreciation is recaptured at up to 25%, and gains may owe capital-gains tax (a 1031 exchange can defer both). Figures are a year-1 estimate at your 24.0% rate — not tax advice; consult a CPA.
Schools (NCES district)
- District
- Ashtabula Area City
- NCES district ID
- 3904351
- Math proficiency
- 24% ▼ -27.00%
- Reading proficiency
- 35% ▼ -13.00%
- Median HH income
- $34,812
- Composite
- 24.3/100
- National rank
- #7712
- State rank
- #588 of 656 in OH
Livability — Ashtabula
- Score
- 71/100
- State rank
- #420
- US rank
- #6883
Category grades
Schools grade is shown separately in the Schools card above.
Census & demographics
- Census place
- Ashtabula, OH
- County
- Ashtabula · 97,617 people
- City population
- 31,076
- Metro
- Cleveland, OH
- Population (ZIP)
- 31,076
- Household income
- $49,507
- Rent vs Own
- Severe rent burden
- 14.1
Population outlook (Ashtabula County) Hauer SSP2
- Today (2025)
- 92,950 people
- By 2030
- 89,146 · -4.1%
- By 2040
- 80,715 · -13.2%
- By 2050
- 72,270 · -22.2%
- By 2075
- 55,780 · -40.0%
- By 2100
- 40,928 · -56.0%
Race, ethnicity, and origin ACS 2023
- Neighborhood character
- Predominantly White (79%)
- Race & ethnicity
- White 79% Hispanic / Latino 9% Two or more races 7% Black 6%
- Hispanic origin (detail)
- Mexican 3% Puerto Rican 5%
- Common ancestry
- Romanian 4% Iranian 2% Slovak 1%
- Foreign-born
- 3% · Canada
- Languages at home
- 94% English-only · Spanish 4%
Political lean MEDSL · Ashtabula
- 2024 margin
- Strong R (+28.4) · D 35.4% · R 63.8%
- 2008→2024 swing
- -41.9pp toward R · 2008: 13.5pp · 2024: -28.4pp
- All cycles
- 2024: R+28.4 2020: R+23.5 2016: R+19.0 2012: D+12.1 2008: D+13.5
Not yet ingested
- Civics
- —
Market trends
- HPI YoY
- ▼ -114.51%
- Current HPI
- 260.7146
- Rent YoY
- —
- Metro
- —
- State GDP YoY
- ▲ 1.98%
- F500 in state
- 48
Industry mix (Fortune 500 HQ in OH)
| Industry | F500 HQs | Revenue |
|---|---|---|
| Insurance | 3 | $145B |
|
||
| Industrial Machinery | 3 | $49B |
|
||
| Financial Services | 3 | $24B |
|
||
| Consumer Goods | 2 | $93B |
|
||
| Aerospace / Defense | 2 | $47B |
|
||
| Utilities | 2 | $33B |
|
||
Price history
+471.0% since first listed17 events — show timeline
- 2026-03-16 Listed $119,900 MLSNOW
- 2023-03-22 Pending — MLSNOW
- 2023-03-22 Sold (Public Records) $76,000 Public Records
- 2023-03-22 Sold (MLS) $76,000 MLSNOW
- 2023-03-07 Contingent — MLSNOW
- 2023-02-27 Listed $75,000 MLSNOW
- 2017-05-01 Sold (Public Records) $49,500 Public Records
- 2017-05-01 Sold (MLS) $49,500 MLSNOW
- 2017-04-08 Listing Removed — MLSNOW
- 2017-03-22 Contingent — MLSNOW
- 2016-10-15 Listed $57,500 MLSNOW
- 2007-08-16 Listing Removed — MLSNOW
- 2007-02-16 Listed $86,000 MLSNOW
- 2006-12-10 Listing Removed — MLSNOW
- 2006-06-10 Listed $79,900 MLSNOW
- 2003-05-02 Sold (Public Records) $33,500 Public Records
- 1993-06-29 Sold (Public Records) $21,000 Public Records
Property tax history
+3.9%/yrLatest (2025): $1,107 · -0.3% YoY. Source: county tax records.
Cash-flow waterfall
monthlySold comps — $/sqft
last 12 mo · ≤1 miLoading sold comps…