2140 E Michigan Ave #31 · Phoenix, AZ
Flood risk No data
- FEMA flood zone
- —
- Chance of flooding over 30 yrs
- —
- Est. flood insurance / yr
- —
Fire risk No data
- Est. fire insurance / yr
- —
Heat risk No data
- Hot days now (above threshold)
- —
- Hot days in 30 yrs
- —
Wind risk No data
- Chance of severe wind over 30 yrs
- —
Air-quality risk No data
- Unhealthy air days now
- —
- Unhealthy air days in 30 yrs
- —
Risk factors via First Street. Map © Google.
Why this score? — see what drove the B grade
The composite is a weighted blend of 9 inputs, each scored 0–100. Each bar is that input's sub-score; the figure is the points it added to the 100-point composite (weight × sub-score).
- Cash flow +30.0/30.0
- 1% rule +10.0/10.0
- DSCR +10.0/10.0
- ARV discount +6.8/15.0
- Condition / age +4.0/5.0
- Schools +3.8/10.0
- Livability +3.8/5.0
- Rent growth +2.2/5.0
- Appreciation +0.0/10.0
$139,999
🖨 Deal sheet 📄 Offer letter ✓ Due diligence
Listing remarks MLS
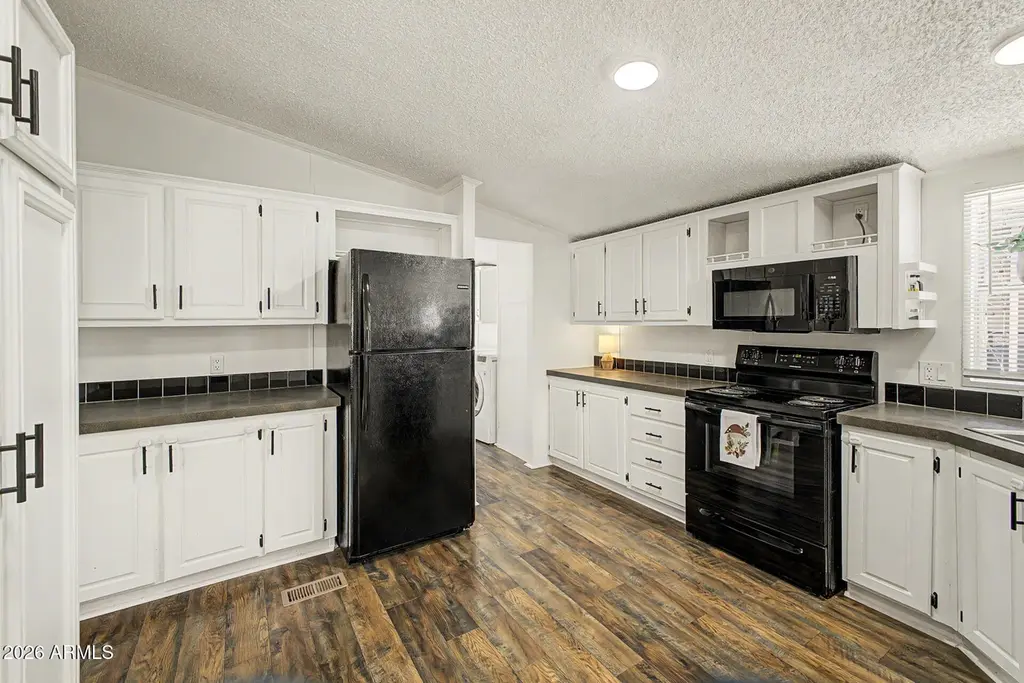
Welcome to Buffalo Ridge Mobile Home Park in North Phoenix. Stylish, affordable living meets an unbeatable location near Desert Ridge, shopping, dining, and major freeways. This beautifully remodeled 3-bedroom, 2-bath Cavco double-wide offers 1,680 sq ft of bright open living space with updated flooring, new carpet, black appliances, newer A/C, and a newer roof. The split floor plan and spacious living areas are perfect for entertaining or everyday comfort. Enjoy resort-style community amenities including a pool, playground, basketball court, and dog park. Move-in ready with modern upgrades, spacious living, and incredible value in a sought-after community!
Key facts
- 4,650 sq ft lot
- 2 parking spots
- Community pool
Neighborhood map
What this means for you Summary
Snapshot
- This is a 3-bed/2.0-bath manufactured listed at $140k. Condition is rated good.
Deal economics
- At list price, monthly cash flow is $696 ($8k/yr) — positive.
- The deal already cash-flows at list — no discount required.
- Meets the 1% rule at list price ($2k rent vs $140k).
- Recommended offer: $136k (3.0% below list) — sets the bar for market timing.
- Cap rate 12.3% vs local median 3.3% in Phoenix — top-decile yield for the area; either an underpriced asset or a hidden risk that comps aren't pricing in. Stress-test before assuming the spread holds.
Location & tenants
- Location reads 75/100 on livability (#16 in AZ, #3,924 nationally) — a middle-class / working-renter tenant base. Strengths: amenities A+, commute A+, housing A+; Watch: health & safety C-, crime F.
- Paradise Valley Unified District (4241) (urban): math 39% / reading 46% proficiency, ranked #56 of 249 in AZ (top 22%) — families likely to look elsewhere, expect single-tenant / working-renter base with shorter leases.
- Market conditions: Rents soft (-1.2%/yr); 282 active listings in the ZIP; 40 comparable units currently listed for rent nearby; rentals leasing fast (median 13d on market — plan ~1-2 weeks tenant-placement turnaround); 36,011 units permitted in Maricopa County in 2024 (12,801 in 5+ unit buildings).
- This rent runs 36% of the median local income ($70k/yr) — at the standard rent-burdened threshold; future hikes will face affordability resistance.
Forward outlook
- Local home prices are declining (-3.0%/yr); year-one equity from $968 of loan paydown is wiped out by about $4k of value loss. Plan a longer hold.
- Maricopa County population projected at +38% by 2050 — long-run rental-demand tailwind backs the buy-and-hold thesis.
- At projected returns (-3.0% appreciation + 0.0% rent growth), your $39k cash investment doubles in ~8 years — after that, you're playing with house money.
Negotiation context
- It's been on market 33 days — a 3% lower offer ($136k) is reasonable based on typical stale-listing flexibility.
- 4 sale attempts since 3y ago with the ask held roughly flat each time — persistent listings suggest the price (not the market) is what's stuck; bring a comps-based counter.
Questions for the listing agent
- It's been on market 33 days. Have you received any prior offers? Is the seller open to a 3% concession, seller financing, or rate buy-down credit?
- Is there a deadline driving the sale (1031 exchange, divorce, estate, relocation)? That informs how much negotiation room exists.
- Crime grade is F in this area — have there been break-ins, vandalism, or insurance claims at this property in the last 3 years? What carrier currently insures it and at what premium?
- What's the average days-on-market for RENTAL listings here right now (not sales)? A rising rental-DOM trend means longer vacancies and softer asking-rent achievability than the comps imply.
- What's the recent tenant-quality profile in this submarket — average credit score on applications, eviction rate, late-payment / NSF rate, and stable-employment percentage? A property-management company in the area should have these aggregated.
- How much new for-sale + rental construction is in the pipeline within 1–3 miles? Heavy new supply typically softens prices + rents 12–24 months out; constrained supply supports both.
Investment metrics
- 1% rule
- 1.50% ✓
- Cap rate
- 12.26%
- Cash-on-cash
- 21.32%
- DSCR
- 1.95
- GRM
- 5.5
CMA / ARV
- ARV (median comp)
- $137,864
- List price
- $139,999
- Delta
- 5.18%
- Verdict
- FAIR
- Comps
- 20 within 1.0 mi
Show comp detail 12 sales within ~0.75 mi
| Address | Dist | Beds/Ba | Sqft | Sold | Price | $/sf | Match |
|---|---|---|---|---|---|---|---|
| 2087 E Michelle Dr | 0.22mi | 3/2.0 | 1,643 (-2%) | 0mo | $302,000 | $184 | 86 |
| 18240 N 21st St #100 | 0.07mi | 3/2.0 | 1,568 (-7%) | 7mo | $145,000 | $92 | 80 |
| 2120 E Bluefield Ave #123 | 0.14mi | 4/2.0 (+1) | 1,664 (-1%) | 12mo | $135,000 | $81 | 77 |
| 2140 E Michigan Ave #5 | 0.00mi | 3/2.0 | 1,456 (-13%) | 9mo | $111,200 | $76 | 70 |
| 2028 E Libby St | 0.32mi | 3/2.0 | 1,764 (+5%) | 12mo | $285,000 | $162 | 67 |
| 1955 E Grovers Ave #10 | 0.46mi | 3/2.0 | 1,568 (-7%) | 4mo | $55,500 | $35 | 64 |
| 1634 E Michelle Dr | 0.67mi | 3/2.0 | 1,568 (-7%) | 1mo | $75,000 | $48 | 57 |
| 18002 N 20th Pl N | 0.29mi | 3/2.0 | 1,457 (-13%) | 12mo | $275,000 | $189 | 54 |
| 1820 E Grovers Ave | 0.53mi | 3/2.0 | 1,440 (-14%) | 3mo | $284,000 | $197 | 49 |
| 1955 E Grovers Ave #8 | 0.48mi | 3/2.0 | 1,456 (-13%) | 12mo | $124,000 | $85 | 46 |
| 17844 N 17th Pl | 0.64mi | 2/2.0 (-1) | 1,456 (-13%) | 3mo | $96,000 | $66 | 40 |
| 1624 E Villa Rita Dr | 0.67mi | 2/2.0 (-1) | 1,456 (-13%) | 13mo | $120,000 | $82 | 31 |
Match score weights: distance 35% · size 25% · config 20% · recency 20%. Top-matched comps best support the ARV.
Projected returns pro-forma
-3.0% appreciation · 0.0% rent growth · sell at horizon
- IRR
- 10.4%
- Equity multiple
- 1.40×
- Total profit
- $15,532
- Equity at exit
- $20,874
- IRR
- 16.9%
- Equity multiple
- 2.20×
- Total profit
- $46,917
- Equity at exit
- $12,105
Cash invested: $39,200 (down + closing). Projections, not guarantees.
Landlord ↔ Tenant lean methodology
- Overall (STATE)
- 87 Strongly Landlord-Friendly
- State Arizona
- 87 Strongly Landlord-Friendly · R+3
- County
- — inherits STATE
- City
- — inherits STATE
ZIP-level market 85022
- Rents YoY
- -1.2%
- Active inventory
- 282
- Price-to-rent
- 5.5×
Monthly cashflow live
- Estimated rent
- $2,106 high interval (Pro) →
- Mortgage (P&I)
- −$734
- Tax est. 1.5%
- −$175 /mo · $2,100/yr
- Insurance
- −$58
- HOA
- −$0
- Vacancy / Maint / Mgmt
- −$442
- Net cashflow
- $696
Break-even live
UW: 25.0% down · 7.5% · 30yr · 1.5% tax · 5.0% vac · 8.0% maint · 8.0% mgmt
Financing live
Cash to close
- Down payment
- $35,000
- Closing costs
- $4,200
- Reserves months
- —
- Total cash needed
- —
Loan-product check · same deal, 3 products live
Conventional
25% down · 7.5% · 30yr
- Down + closing
- —
- Monthly P&I
- —
- Monthly cashflow
- —
- DSCR
- —
- Eligible?
- —
Personal DTI + credit; lowest rate.
DSCR
20% down · 8.5% · 30yr
- Down + closing
- —
- Monthly P&I
- —
- Monthly cashflow
- —
- DSCR
- —
- Eligible?
- —
No personal income docs; deal must DSCR.
Hard money
10% down · 12.0% · 12mo
- Down + closing
- —
- Monthly P&I
- —
- Monthly cashflow
- —
- DSCR
- —
- Eligible?
- —
Short-term bridge; refi at stabilization.
Rent comps 40 comps
| Address | Beds | Baths | Sqft | Rent | $/sqft | DOM | Units | Dist |
|---|---|---|---|---|---|---|---|---|
| 2221 E Union Hills Dr #158 Phoenix, AZ | 3.0 | 2.0 | 1332 | $2,100 | $1.58 | 18d | 1 | 0.09mi |
| 18611 N 22nd St Phoenix, AZ | 3.0 | 3.0 | 1851 | $2,200 | $1.19 | 13d | 1 | 0.26mi |
| 18611 N 22nd St #72 Phoenix, AZ | 3.0 | 2.5 | 1851 | $2,200 | $1.19 | 15d | 1 | 0.26mi |
| 18660 N Cave Creek Rd Phoenix, AZ | 1.0–3.0 | 1.0–2.0 | 961 | $1,955 | $2.03 | 2d | 11 | 0.33mi |
| 2239 E Morrow Dr Phoenix, AZ | 3.0 | 3.0 | 1545 | $2,199 | $1.42 | 3d | 1 | 0.37mi |
| 1717 E Union Hills Dr Phoenix, AZ | 2.0–3.0 | 2.0 | 1169 | $4,000 | $3.42 | 3d | 3 | 0.42mi |
| 1717 E Union Hills Dr Phoenix, AZ | 2.0–3.0 | 2.0 | 1245 | $4,000 | $3.21 | 22d | 4 | 0.42mi |
| 1717 E Union Hills Dr #1052 Phoenix, AZ | 2.0 | 2.0 | 1160 | $4,000 | $3.45 | 44d | 1 | 0.51mi |
| 2554 E Villa Rita Dr Phoenix, AZ | 2.0 | 1.0 | 1118 | $2,750 | $2.46 | 24d | 1 | 0.58mi |
| 1702 E Michelle Dr Phoenix, AZ | 2.0 | 2.0 | 1300 | $2,200 | $1.69 | 5d | 1 | 0.61mi |
| 17833 N 26th St Phoenix, AZ | 4.0 | 2.0 | 1220 | $2,397 | $1.96 | 1d | 1 | 0.63mi |
| 2602 E Charleston Ave Phoenix, AZ | 3.0 | 2.0 | 1426 | $2,100 | $1.47 | 24d | 1 | 0.64mi |
| 2335 E Utopia Rd Unit 16 Phoenix, AZ | 3.0 | 2.5 | 1426 | $2,550 | $1.79 | 18d | 1 | 0.70mi |
| 17150 N 23rd St #135 Phoenix, AZ | 2.0 | 2.5 | 1186 | $1,900 | $1.60 | 15d | 1 | 0.71mi |
| 17606 N 17th Pl Phoenix, AZ | 2.0–3.0 | 2.0–2.5 | 1463 | $2,300 | $1.57 | 2d | 3 | 0.71mi |
| 17606 N 17th Pl Phoenix, AZ | 2.0–3.0 | 2.5 | 1472 | $2,300 | $1.56 | 13d | 3 | 0.71mi |
| 2336 E Utopia Rd Phoenix, AZ | 2.0–3.0 | 2.5 | 1327 | $2,395 | $1.80 | 5d | 1 | 0.73mi |
| 2150 E Bell Rd #1102 Phoenix, AZ | 3.0 | 2.5 | 1462 | $1,945 | $1.33 | 15d | 1 | 0.75mi |
| 2719 E Charleston Ave Phoenix, AZ | 3.0 | 1.5 | 1670 | $1,891 | $1.13 | 22d | 1 | 0.76mi |
| 1814 E Bell Rd Phoenix, AZ | 1.0–2.0 | 1.0–2.0 | 1003 | $1,637 | $1.63 | 2d | 12 | 0.76mi |
| 17365 N Cave Creek Rd #124 Phoenix, AZ | 3.0 | 2.5 | 1468 | $2,299 | $1.57 | 15d | 1 | 0.77mi |
| 2755 E Michigan Ave Phoenix, AZ | 3.0 | 2.0 | 1316 | $2,700 | $2.05 | 17d | 1 | 0.77mi |
| 17223 N Cave Creek Rd #7 Phoenix, AZ | 3.0 | 3.0 | 1550 | $1,645 | $1.06 | 22d | 1 | 0.79mi |
| 17223 N Cave Creek Rd #7 Phoenix, AZ | 3.0 | 3.0 | 1550 | $1,745 | $1.13 | 24d | 1 | 0.79mi |
| 17150 N 23rd St Phoenix, AZ | 2.0 | 2.0–2.5 | 1172 | $1,712 | $1.46 | 4d | 2 | 0.79mi |
| 17150 N 23rd St Phoenix, AZ | 2.0 | 2.0–2.5 | 1172 | $1,712 | $1.46 | 5d | 2 | 0.79mi |
| 18633 N 15th St Phoenix, AZ | 3.0 | 2.0 | 1240 | $2,249 | $1.81 | 8d | 1 | 0.82mi |
| 17435 N 16th Pl Phoenix, AZ | 3.0 | 2.5 | 1614 | $2,280 | $1.41 | 20d | 1 | 0.84mi |
| 1506 E Wescott Dr Phoenix, AZ | 3.0 | 2.0 | 1136 | $2,045 | $1.80 | 5d | 1 | 0.87mi |
| 1440 E Renee Dr Phoenix, AZ | 3.0 | 2.0 | 1632 | $2,200 | $1.35 | 24d | 1 | 0.88mi |
| 1510 E Taro Ln Phoenix, AZ | 3.0 | 2.0 | 1136 | $2,149 | $1.89 | 24d | 1 | 0.89mi |
| 1920 E Bell Rd Phoenix, AZ | 2.0–3.0 | 2.0–2.5 | 1391 | $2,149 | $1.54 | 14d | 5 | 0.90mi |
| 1920 E Bell Rd Phoenix, AZ | 2.0–3.0 | 2.0–2.5 | 1391 | $2,089 | $1.50 | 8d | 4 | 0.90mi |
| 1920 E Bell Rd Phoenix, AZ | 2.0–3.0 | 2.0–2.5 | 1391 | $2,039 | $1.47 | 3d | 3 | 0.90mi |
| 2104 E Behrend Dr Phoenix, AZ | 4.0 | 2.5 | 2070 | $2,975 | $1.44 | 3d | 1 | 0.91mi |
| 18626 N 29th Pl Phoenix, AZ | 4.0 | 2.0 | 1600 | $2,995 | $1.87 | 8d | 1 | 0.98mi |
| 19635 N Cave Creek Rd Phoenix, AZ | 3.0 | 1.0–2.0 | 999 | $1,933 | $1.93 | 2d | 22 | 0.98mi |
| 2030 E Wahalla Ln Phoenix, AZ | 3.0 | 2.0 | 1400 | $2,115 | $1.51 | 3d | 1 | 0.98mi |
| 1420 E Topeka Dr Phoenix, AZ | 3.0 | 2.5 | 1464 | $2,215 | $1.51 | 8d | 1 | 1.00mi |
| 19460 N 27th Pl Phoenix, AZ | 4.0 | 2.0 | 1598 | $3,300 | $2.07 | 44d | 1 | 1.00mi |
Listing history 24 events
-
2026-06-18days on market $139,999 Active 33 DOM
-
2026-06-17days on market $139,999 Active 32 DOM
-
2026-06-16days on market $139,999 Active 31 DOM
-
2026-06-15days on market $139,999 Active 30 DOM
-
2026-06-13days on market $139,999 Active 28 DOM
-
2026-06-13days on market $139,999 Active 27 DOM
-
2026-06-09days on market $139,999 Active 24 DOM
-
2026-06-08days on market $139,999 Active 23 DOM
-
2026-06-07days on market $139,999 Active 22 DOM
-
2026-06-04days on market $139,999 Active 19 DOM
-
2026-06-03days on market $139,999 Active 18 DOM
-
2026-06-02days on market $139,999 Active 17 DOM
-
2026-06-01days on market $139,999 Active 16 DOM
-
2026-05-31days on market $139,999 Active 15 DOM
-
2026-05-16$139,999 Active 665-char remark
Show marketing remark (665 chars)
Welcome to Buffalo Ridge Mobile Home Park in North Phoenix. Stylish, affordable living meets an unbeatable location near Desert Ridge, shopping, dining, and major freeways. This beautifully remodeled 3-bedroom, 2-bath Cavco double-wide offers 1,680 sq ft of bright open living space with updated flooring, new carpet, black appliances, newer A/C, and a newer roof. The split floor plan and spacious living areas are perfect for entertaining or everyday comfort. Enjoy resort-style community amenities including a pool, playground, basketball court, and dog park. Move-in ready with modern upgrades, spacious living, and incredible value in a sought-after community!
-
2026-05-12historical
-
2026-03-05$145,000 Active
-
2023-06-22soldstatus $135,000 Closed
-
2023-06-11status Pending
-
2023-05-28historical Contract Contingent on Buyer Sale
-
2023-04-28status Active
-
2023-04-20historical Under Contract Accepting Backups
-
2023-04-06price $135,000
-
2023-03-16$150,000 Active
ⓘ Source: listings_history table (triggers on properties + properties_extension) + one-shot
backfill from property_details.listing_events for pre-trigger history.
Nearby sold comps map
Loading sold comps map…
Walkable amenities ~0.75 mi
Loading nearby amenities…
Taxation est. · year 1
- Rental income
- $25,275
- − Mortgage interest
- −$7,842
- − Property taxes
- −$2,100
- − Insurance
- −$700
- − Repairs & maintenance
- −$2,022
- − Management
- −$2,022
- − Depreciation
- −$4,073
- Taxable income
- $6,517
- Est. tax owed @ 24.0%
- −$1,564
- After-tax cash flow
- $6,794/yr
For passive investors: Depreciation is non-cash, so a rental often shows a tax loss while cash-flowing — sheltering income. Rental losses are passive: they offset passive income freely, and up to $25,000/yr can offset ordinary (W-2) income if you actively participate and your MAGI is under $100k (phasing out to $0 by $150k); unused losses carry forward. On sale, claimed depreciation is recaptured at up to 25%, and gains may owe capital-gains tax (a 1031 exchange can defer both). Figures are a year-1 estimate at your 24.0% rate — not tax advice; consult a CPA.
Condition & rehab AI · 12 photos
This beautifully remodeled Cavco double-wide in Buffalo Ridge Mobile Home Park offers 1,680 sq ft of bright open living space with updated flooring, black appliances, and a newer roof. The split floor plan and spacious living areas are perfect for entertaining or everyday comfort. Enjoy resort-style community amenities including a pool, playground, basketball court, and dog park.
Value-add opportunities
- Both Paint exterior — Enhances curb appeal and value
- Both Replace ceiling fans with modern ones — Modernizes the space and improves airflow
- Both Add smart home features — Enhances convenience and adds value
Renovation cost estimate screening
Value-add ROI direction
- Both Paint exterior — Enhances curb appeal and value ↑
- Both Replace ceiling fans with modern ones — Modernizes the space and improves airflow ↑
- Both Add smart home features — Enhances convenience and adds value ↑
ⓘ Cost ranges are severity-bucket heuristics (US national rule-of-thumb). Get contractor quotes + a written scope before underwriting a rehab budget.
Schools (NCES district)
- District
- Paradise Valley Unified District (4241)
- NCES district ID
- 0405930
- Math proficiency
- 39% ▼ -11.00%
- Reading proficiency
- 46% ▼ -7.00%
- Median HH income
- $64,106
- Composite
- 37.89/100
- National rank
- #4316
- State rank
- #56 of 249 in AZ
Livability — Phoenix
- Score
- 75/100
- State rank
- #16
- US rank
- #3924
Category grades
Schools grade is shown separately in the Schools card above.
Census & demographics
- Census place
- Phoenix, AZ
- County
- Maricopa County · 4,537,380 people
- City population
- 1,500,198
- Metro
- Phoenix-Mesa-Chandler, AZ
- Population (ZIP)
- 53,811
- Household income
- $69,927
- Rent vs Own
- Severe rent burden
- 2976.0
Population outlook (Maricopa County) Hauer SSP2
- Today (2025)
- 4,979,203 people
- By 2030
- 5,378,229 · +8.0%
- By 2040
- 6,156,598 · +23.6%
- By 2050
- 6,872,376 · +38.0%
- By 2075
- 8,401,270 · +68.7%
- By 2100
- 9,247,439 · +85.7%
Race, ethnicity, and origin ACS 2023
- Neighborhood character
- Diverse neighborhood (Simpson 0.59)
- Race & ethnicity
- White 59% Hispanic / Latino 22% Two or more races 11% Black 10% Asian 3% Native American 3%
- Hispanic origin (detail)
- Mexican 18%
- Common ancestry
- Romanian 3% Lithuanian 2% Italian 1%
- Foreign-born
- 14% · Canada, China, Vietnam
- Languages at home
- 79% English-only · Spanish 13% Other Indo-European 2% Russian/Polish/Slavic 1%
Political lean MEDSL · Maricopa
- 2024 margin
- Toss-up / Even · D 47.7% · R 51.2% · Other 1.1%
- 2008→2024 swing
- +7.1pp toward D · 2008: -10.6pp · 2024: -3.5pp
- All cycles
- 2024: R+3.5 2020: D+2.2 2016: R+3.5 2012: R+12.0 2008: R+10.6
Not yet ingested
- Civics
- —
Market trends
- HPI YoY
- ▼ -329.75%
- Current HPI
- 313.5085
- Rent YoY
- ▼ -1.21%
- Metro
- Phoenix-Mesa-Chandler, AZ
- State GDP YoY
- ▲ 4.54%
- F500 in state
- 20
Industry mix (Fortune 500 HQ in AZ)
| Industry | F500 HQs | Revenue |
|---|---|---|
| Technology | 2 | $13B |
|
||
| Mining / Metals | 1 | $23B |
|
||
| Environmental Services | 1 | $16B |
|
||
| Metals / Steel | 1 | $14B |
|
||
| Technology Distribution | 1 | $9B |
|
||
| Homebuilding | 1 | $8B |
|
||
Price history
-6.7% since first listed10 events — show timeline
- 2026-05-16 Listed $139,999 ARMLS
- 2026-05-12 Listing Removed — ARMLS
- 2026-03-05 Listed $145,000 ARMLS
- 2023-06-22 Sold (MLS) $135,000 ARMLS
- 2023-06-11 Pending — ARMLS
- 2023-05-28 Contingent — ARMLS
- 2023-04-28 Relisted — ARMLS
- 2023-04-20 Contingent — ARMLS
- 2023-04-06 Price Changed $135,000 ARMLS
- 2023-03-16 Listed $150,000 ARMLS
Cash-flow waterfall
monthlySold comps — $/sqft
last 12 mo · ≤1 miLoading sold comps…