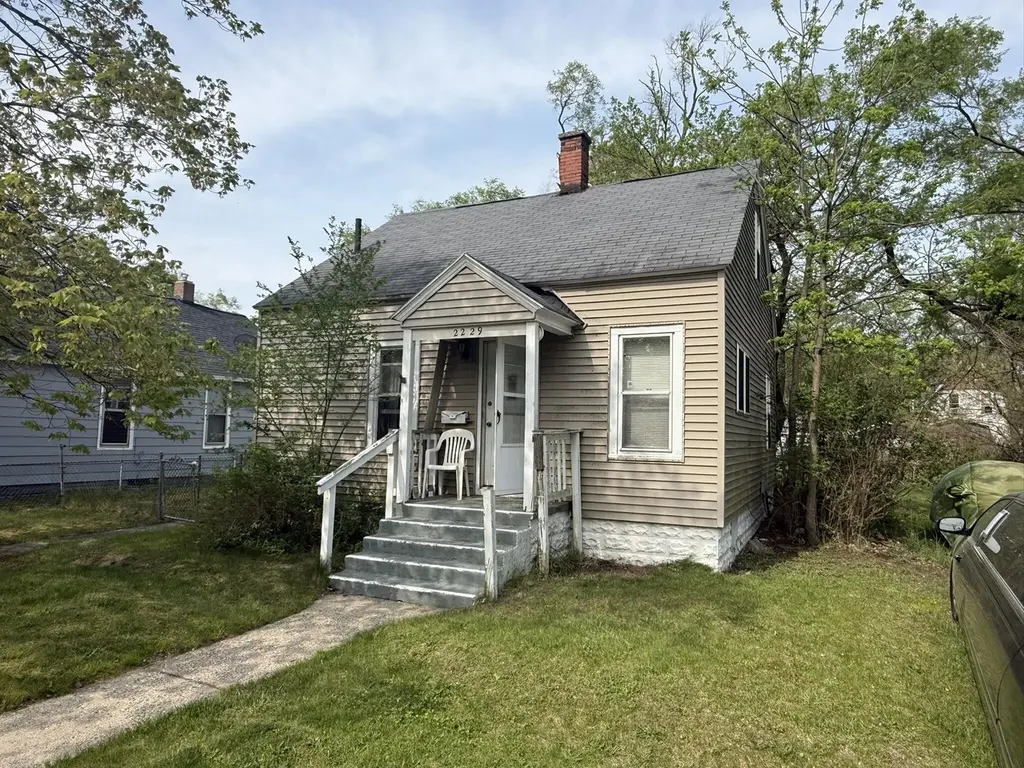
2229 Mcilwraith St · Muskegon Heights, MI
Flood risk 1/10 · Minimal
- FEMA flood zone
- X (unshaded)
- Chance of flooding over 30 yrs
- 0.0%
- Est. flood insurance / yr
- $473 – $860
Fire risk 1/10 · Minimal
- Est. fire insurance / yr
- $784 – $1,456
Heat risk 2/10 · Minimal
- Hot days now (above 93°F)
- 7 days/yr
- Hot days in 30 yrs
- 15 days/yr
Wind risk 1/10 · Minimal
- Chance of severe wind over 30 yrs
- —
Air-quality risk 4/10 · Minor
- Unhealthy air days now
- 4 days/yr
- Unhealthy air days in 30 yrs
- 6 days/yr
Risk factors via First Street. Map © Google.
Why this score? — see what drove the B grade
The composite is a weighted blend of 9 inputs, each scored 0–100. Each bar is that input's sub-score; the figure is the points it added to the 100-point composite (weight × sub-score).
- Cash flow +26.9/30.0
- ARV discount +15.0/15.0
- DSCR +9.3/10.0
- 1% rule +6.8/10.0
- Schools +5.0/10.0
- Livability +3.1/5.0
- Rent growth +2.5/5.0
- Condition / age +2.5/5.0
- Appreciation +0.0/10.0
$79,900
🖨 Deal sheet (PDF) 📄 Offer letter ✓ Due diligence
Listing remarks MLS
Welcome to 2229 McIlwraith. This 3 bedroom single bath home sits on a double lot with a third lot at 2221 McIlwraith included in the sale. This home is priced to sell and includes immediate possession upon closing. Book your personal showing today.
Key facts
- Double lot
- Third lot included
- 0.29 acre lot
Tags
Property features AI
Exterior
- Parking: Attached garage (1 car)
- Utilities: Natural gas connected; Cable connected
- Home design: Single-family residence; Other architectural style
- Construction: Built in 1939; Vinyl siding
- Exterior features: Public water; Lot approximately 0.29 acres
Interior
- Bathrooms: 1 full bathroom
- Heating & cooling: Forced air heating
- Interior features: 5 total rooms; Full basement
Neighborhood map
What this means for you Summary
Snapshot
- This is a 2-bed/1.0-bath single-family listed at $80k.
Deal economics
- At list price, monthly cash flow is $222 ($3k/yr) — positive.
- The deal already cash-flows at list — no discount required.
- Meets the 1% rule at list price ($945 rent vs $80k).
Location & tenants
- Location reads 61/100 on livability (#574 in MI) — a middle-class / working-renter tenant base. Strengths: cost of living A+, housing A; Watch: schools D+, crime F, amenities F.
- Market conditions: 239 active listings in the ZIP; 8 comparable units currently listed for rent nearby; rentals at typical pace (median 23d on market — plan ~3-4 weeks tenant-placement turnaround); 438 units permitted in Muskegon County in 2024 (115 in 5+ unit buildings).
Forward outlook
- Local home prices are declining (-3.0%/yr); year-one equity from $552 of loan paydown is wiped out by about $2k of value loss. Plan a longer hold.
- Muskegon County population projected to shrink 8% by 2050 — rents likely to lag national; underwrite the cash flow, not the appreciation.
- At projected returns (-3.0% appreciation + 3.0% rent growth), your $22k cash investment doubles in ~10 years — after that, you're playing with house money.
Negotiation context
- Only 3 days on market — expect competitive offers; lowballing is unlikely to land.
- 7 sale attempts since 27y ago with the ask held roughly flat each time — persistent listings suggest the price (not the market) is what's stuck; bring a comps-based counter.
Risks & watch-outs
- Watch-outs: built in 1939 — expect roof / HVAC / electrical / plumbing capex.
Questions for the listing agent
- Built in 1939 — when were the roof, HVAC, electrical panel, plumbing, and water heater last replaced?
- Is there a deadline driving the sale (1031 exchange, divorce, estate, relocation)? That informs how much negotiation room exists.
- Schools are D-rated, which usually means shorter tenancies and higher turnover. Who's the typical renter profile here, and what's been the actual vacancy rate?
- Crime grade is F in this area — have there been break-ins, vandalism, or insurance claims at this property in the last 3 years? What carrier currently insures it and at what premium?
- What's the average days-on-market for RENTAL listings here right now (not sales)? A rising rental-DOM trend means longer vacancies and softer asking-rent achievability than the comps imply.
- What's the recent tenant-quality profile in this submarket — average credit score on applications, eviction rate, late-payment / NSF rate, and stable-employment percentage? A property-management company in the area should have these aggregated.
- How much new for-sale + rental construction is in the pipeline within 1–3 miles? Heavy new supply typically softens prices + rents 12–24 months out; constrained supply supports both.
Investment metrics
- 1% rule
- 1.18% ✓
- Cap rate
- 9.63%
- Cash-on-cash
- 11.91%
- DSCR
- 1.53
- GRM
- 7.0
CMA / ARV
- ARV (on-the-fly)
- $97,500
- Comps found
- 12
Show comp detail 12 sales within ~0.75 mi
| Address | Dist | Beds/Ba | Sqft | Sold | Price | $/sf | Match |
|---|---|---|---|---|---|---|---|
| 2229 Mcilwraith St | 0.00mi | 3/1.0 (+1) | 780 (0%) | 1mo | $70,000 | $90 | 94 |
| 2520 Manz St | 0.37mi | 2/1.0 | 768 (-2%) | 1mo | $54,300 | $71 | 79 |
| 556 E Barney Ave | 0.11mi | 2/1.0 | 704 (-10%) | 2mo | $135,000 | $192 | 77 |
| 2304 Dyson St | 0.17mi | 3/1.0 (+1) | 864 (+11%) | 3mo | $49,000 | $57 | 67 |
| 2278 Austin St | 0.54mi | 2/1.0 | 816 (+5%) | 6mo | $120,000 | $147 | 62 |
| 1768 Elwood St | 0.66mi | 3/1.0 (+1) | 816 (+5%) | 6mo | $60,000 | $74 | 52 |
| 1921 Jiroch St | 0.67mi | 2/1.0 | 720 (-8%) | 5mo | $89,900 | $125 | 52 |
| 1687 Smith St | 0.75mi | 2/1.0 | 840 (+8%) | 1mo | $105,900 | $126 | 52 |
| 1844 Superior St | 0.59mi | 2/1.0 | 679 (-13%) | 0mo | $108,000 | $159 | 50 |
| 2618 Hoyt St | 0.59mi | 3/1.0 (+1) | 878 (+13%) | 1mo | $74,900 | $85 | 46 |
| 2115 Valley St | 0.60mi | 3/1.0 (+1) | 858 (+10%) | 7mo | $130,000 | $152 | 45 |
| 1735 Superior St | 0.71mi | 2/1.0 | 887 (+14%) | 2mo | $79,000 | $89 | 42 |
Match score weights: distance 35% · size 25% · config 20% · recency 20%. Top-matched comps best support the ARV.
Projected returns pro-forma
-3.0% appreciation · 3.0% rent growth · sell at horizon
- IRR
- 1.4%
- Equity multiple
- 1.05×
- Total profit
- $1,198
- Equity at exit
- $11,913
- IRR
- 11.0%
- Equity multiple
- 1.86×
- Total profit
- $19,250
- Equity at exit
- $6,908
Cash invested: $22,372 (down + closing). Projections, not guarantees.
Landlord ↔ Tenant lean methodology
- Overall (STATE)
- 62 Landlord-Friendly
- State Michigan
- 62 Landlord-Friendly · EVEN
- County
- — inherits STATE
- City
- — inherits STATE
ZIP-level market 49444
- Active inventory
- 239
- Price-to-rent
- 7.0×
Monthly cashflow live
- Estimated rent
- $945 high interval (Pro) →
- Mortgage (P&I)
- −$419
- Tax from tax record
- −$72 /mo · $867/yr
- Insurance
- −$33
- HOA
- −$0
- Vacancy / Maint / Mgmt
- −$198
- Net cashflow
- $222
Break-even live
Sensitivity live
| Price | -10% $267 | -5% $245 | +0% $222 | +5% $200 | +10% $177 |
|---|---|---|---|---|---|
| Rent | -10% $147 | -5% $185 | +0% $222 | +5% $259 | +10% $297 |
| Rate | -1.0pp $262 | -0.5pp $242 | base $222 | +0.5pp $201 | +1.0pp $180 |
UW: 25.0% down · 7.5% · 30yr · 1.5% tax · 5.0% vac · 8.0% maint · 8.0% mgmt
Financing live
Cash to close
- Down payment
- $19,975
- Closing costs
- $2,397
- Reserves months
- —
- Total cash needed
- —
Loan-product check · same deal, 3 products live
Conventional
25% down · 7.5% · 30yr
- Down + closing
- —
- Monthly P&I
- —
- Monthly cashflow
- —
- DSCR
- —
- Eligible?
- —
Personal DTI + credit; lowest rate.
DSCR
20% down · 8.5% · 30yr
- Down + closing
- —
- Monthly P&I
- —
- Monthly cashflow
- —
- DSCR
- —
- Eligible?
- —
No personal income docs; deal must DSCR.
Hard money
10% down · 12.0% · 12mo
- Down + closing
- —
- Monthly P&I
- —
- Monthly cashflow
- —
- DSCR
- —
- Eligible?
- —
Short-term bridge; refi at stabilization.
Rent comps 8 comps
| Address | Beds | Baths | Sqft | Rent | $/sqft | DOM | Units | Dist |
|---|---|---|---|---|---|---|---|---|
| 121 E Holbrook Ave Apt 3 Muskegon, MI | 2.0 | 1.0 | 650 | $950 | $1.46 | 22d | 1 | 0.66mi |
| 2516 5th St Apt 2 Muskegon Heights, MI | 1.0 | 1.0 | 630 | $750 | $1.19 | 22d | 1 | 0.87mi |
| 2516 5th St Apt 1 Muskegon Heights, MI | 1.0 | 1.0 | 630 | $775 | $1.23 | 22d | 1 | 0.87mi |
| 1893 Jefferson St Unit 2 Muskegon, MI | 1.0 | 1.0 | 594 | $700 | $1.18 | 22d | 1 | 0.91mi |
| 232 E Lincoln Ave Muskegon, MI | 2.0 | 1.0 | 1020 | $1,100 | $1.08 | 22d | 1 | 1.07mi |
| 1223 Terrace St Unit A Muskegon, MI | 1.0 | 1.0 | 800 | $1,000 | $1.25 | 22d | 1 | 1.39mi |
| 3223 Bailey St Norton Shores, MI | 2.0–3.0 | 2.0 | 1096 | $1,249 | $1.14 | 22d | 1 | 1.42mi |
| 1126 Holt St Muskegon, MI | 2.0 | 1.0 | 708 | $1,095 | $1.55 | 22d | 1 | 1.47mi |
Listing history 14 events
-
2026-05-21status Pending 248-char remark
Show marketing remark (248 chars)
Welcome to 2229 McIlwraith. This 3 bedroom single bath home sits on a double lot with a third lot at 2221 McIlwraith included in the sale. This home is priced to sell and includes immediate possession upon closing. Book your personal showing today.
-
2026-05-21status Pending
Show marketing remark (248 chars)
Welcome to 2229 McIlwraith. This 3 bedroom single bath home sits on a double lot with a third lot at 2221 McIlwraith included in the sale. This home is priced to sell and includes immediate possession upon closing. Book your personal showing today.
-
2026-05-18$79,900 Active 248-char remark
Show marketing remark (248 chars)
Welcome to 2229 McIlwraith. This 3 bedroom single bath home sits on a double lot with a third lot at 2221 McIlwraith included in the sale. This home is priced to sell and includes immediate possession upon closing. Book your personal showing today.
-
2026-05-18$79,900 Active
Show marketing remark (248 chars)
Welcome to 2229 McIlwraith. This 3 bedroom single bath home sits on a double lot with a third lot at 2221 McIlwraith included in the sale. This home is priced to sell and includes immediate possession upon closing. Book your personal showing today.
-
2014-09-30historical
-
1999-12-31historical
-
1999-08-03$16,900
-
1999-08-03$16,900
-
1999-07-29historical
-
1999-07-29historical
-
1999-05-13$31,900
-
1999-05-13$31,900
ⓘ Source: listings_history table (triggers on properties + properties_extension) + one-shot
backfill from property_details.listing_events for pre-trigger history.
Tax reassessment forecast MI · Partial reset (capped growth)
- Current annual tax
- $867 · $72/mo
- Projected year-2 tax
- $1,049 · $87/mo
- Expected delta
- +$182/yr (+$15/mo · 21.0%)
ⓘ Screening estimate from a state-policy table — verify with the county assessor before closing.
Climate risk First Street
- Flood 1/10 Low FEMA zone X (unshaded) · 0% chance over 30 yrs
- Wildfire 1/10 Low
- Heat 2/10 Low 7 d/yr ≥93°F today · 15 d/yr by 30 yrs out
- Wind 1/10 Low
- Air quality 4/10 Moderate 4 unhealthy d/yr today · 6 by 30 yrs out
Nearby sold comps map
Loading sold comps map…
Walkable amenities ~0.75 mi
Loading nearby amenities…
Taxation est. · year 1
- Rental income
- $11,342
- − Mortgage interest
- −$4,476
- − Property taxes
- −$867
- − Insurance
- −$400
- − Repairs & maintenance
- −$907
- − Management
- −$907
- − Depreciation
- −$2,324
- Taxable income
- $1,461
- Est. tax owed @ 24.0%
- −$351
- After-tax cash flow
- $2,315/yr
For passive investors: Depreciation is non-cash, so a rental often shows a tax loss while cash-flowing — sheltering income. Rental losses are passive: they offset passive income freely, and up to $25,000/yr can offset ordinary (W-2) income if you actively participate and your MAGI is under $100k (phasing out to $0 by $150k); unused losses carry forward. On sale, claimed depreciation is recaptured at up to 25%, and gains may owe capital-gains tax (a 1031 exchange can defer both). Figures are a year-1 estimate at your 24.0% rate — not tax advice; consult a CPA.
Schools (NCES district)
No district data.
Livability — Muskegon Heights
- Score
- 61/100
- State rank
- #574
- US rank
- #18269
Category grades
Schools grade is shown separately in the Schools card above.
Census & demographics
- Census place
- Muskegon Heights, MI
- County
- Muskegon County · 107,917 people
- Metro
- Muskegon, MI
- Population (ZIP)
- 26,372
- Household income
- $53,054
- Rent vs Own
- Severe rent burden
- 930.0
Population outlook (Muskegon County) Hauer SSP2
- Today (2025)
- 174,032 people
- By 2030
- 173,365 · -0.4%
- By 2040
- 168,877 · -3.0%
- By 2050
- 160,306 · -7.9%
- By 2075
- 134,426 · -22.8%
- By 2100
- 98,836 · -43.2%
Race, ethnicity, and origin ACS 2023
- Neighborhood character
- Diverse neighborhood (Simpson 0.55)
- Race & ethnicity
- White 59% Black 31% Two or more races 6% Hispanic / Latino 4% Native American 1%
- Common ancestry
- Iranian 6% Romanian 4% Lithuanian 2%
- Foreign-born
- 1% · Canada
- Languages at home
- 97% English-only · Spanish 2%
Political lean MEDSL · Muskegon
- 2024 margin
- Toss-up / Even · D 48.4% · R 50.2% · Other 1.5%
- 2008→2024 swing
- -31.1pp toward R · 2008: 29.3pp · 2024: -1.8pp
- All cycles
- 2024: R+1.8 2020: D+0.6 2016: D+0.9 2012: D+17.8 2008: D+29.3
Not yet ingested
- Civics
- —
Market trends
- HPI YoY
- ▼ -150.02%
- Current HPI
- 209.2698
- Rent YoY
- —
- Metro
- Muskegon, MI
- State GDP YoY
- ▲ 1.37%
- F500 in state
- 28
Industry mix (Fortune 500 HQ in MI)
| Industry | F500 HQs | Revenue |
|---|---|---|
| Automotive Parts | 3 | $48B |
|
||
| Automotive | 2 | $372B |
|
||
| Chemicals | 1 | $45B |
|
||
| Automotive Retail | 1 | $29B |
|
||
| Healthcare / Medical Devices | 1 | $23B |
|
||
| Automotive Technology | 1 | $20B |
|
||
Price history
+150.5% since first listed14 events — show timeline
- 2026-05-21 Pending — REALCOMP
- 2026-05-21 Pending — MiRealSource-MiMLS
- 2026-05-21 Pending — SW Michigan MLS
- 2026-05-18 Listed $79,900 REALCOMP
- 2026-05-18 Listed $79,900 SW Michigan MLS
- 2026-05-18 Listed $79,900 MiRealSource-MiMLS
- 2014-09-30 Listing Removed — SW Michigan MLS
- 1999-12-31 Listing Removed — REALCOMP
- 1999-08-03 Listed $16,900 REALCOMP
- 1999-08-03 Listed $16,900 SW Michigan MLS
- 1999-07-29 Listing Removed — SW Michigan MLS
- 1999-07-29 Listing Removed — REALCOMP
- 1999-05-13 Listed $31,900 SW Michigan MLS
- 1999-05-13 Listed $31,900 REALCOMP
Property tax history
+2.6%/yrLatest (2025): $867 · +2.8% YoY. Source: county tax records.
Cash-flow waterfall
monthlySold comps — $/sqft
last 12 mo · ≤1 miLoading sold comps…