100 Mill Creek Rd Lot 19 · St. Regis, MT
Flood risk 1/10 · Minimal
- FEMA flood zone
- X
- Chance of flooding over 30 yrs
- 0.0%
- Est. flood insurance / yr
- $507 – $1,088
Fire risk 7/10 · Major
- Est. fire insurance / yr
- $918 – $1,706
Heat risk 3/10 · Minor
- Hot days now (above 92°F)
- 7 days/yr
- Hot days in 30 yrs
- 17 days/yr
Wind risk 1/10 · Minimal
- Chance of severe wind over 30 yrs
- —
Air-quality risk 9/10 · Severe
- Unhealthy air days now
- 14 days/yr
- Unhealthy air days in 30 yrs
- 19 days/yr
Risk factors via First Street. Map © Google.
Why this score? — see what drove the B grade
The composite is a weighted blend of 9 inputs, each scored 0–100. Each bar is that input's sub-score; the figure is the points it added to the 100-point composite (weight × sub-score).
- Cash flow +30.0/30.0
- 1% rule +10.0/10.0
- DSCR +10.0/10.0
- ARV discount +7.5/15.0
- Appreciation +6.0/10.0
- Schools +3.4/10.0
- Rent growth +2.5/5.0
- Livability +2.5/5.0
- Condition / age +2.2/5.0
$39,000
🖨 Deal sheet 📄 Offer letter ✓ Due diligence
Key facts
- Large treed lots
- Public ground access
- New bathtub
Tags
Property features AI
Finance
- Financial info: Land is leased
Exterior
- Utilities: Electricity connected; Propane; Public sewer
- Home design: Manufactured home (single wide); Residential property
- Construction: Other foundation
- Exterior features: Private maintained road access; Private road frontage; 0.25-acre lot
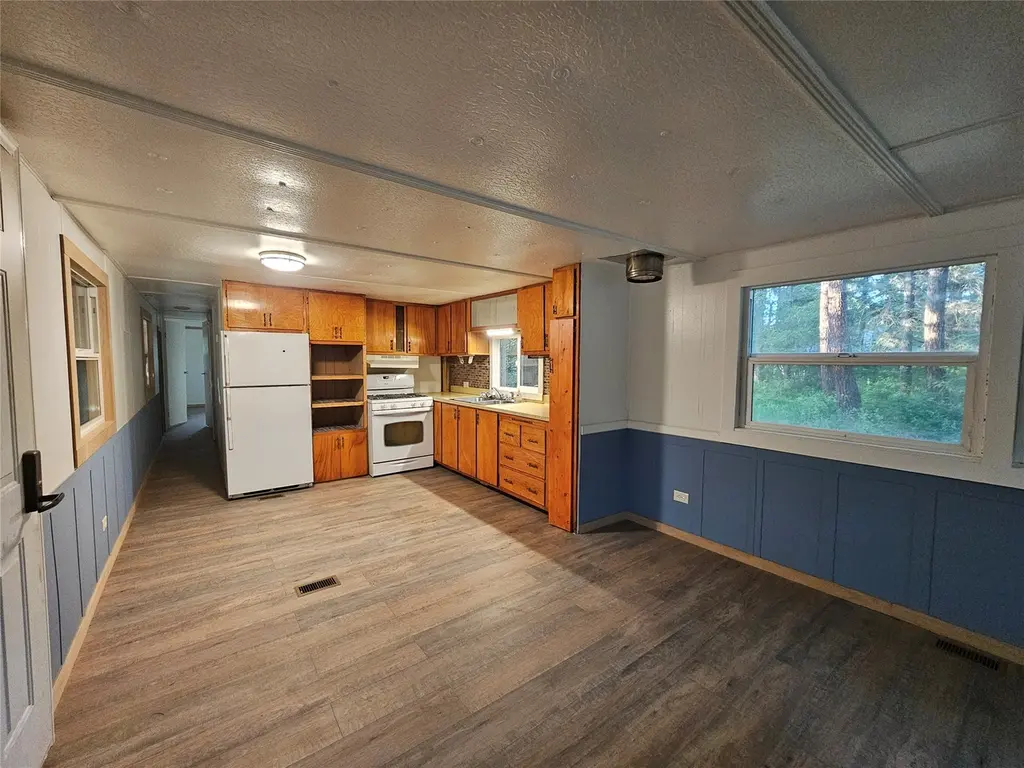
Interior
- Kitchen: Range; Refrigerator
- Bathrooms: 1 full bathroom
- Heating & cooling: Propane heating
- Interior features: Range; Refrigerator
- Laundry & utility: Washer hookup
Neighborhood map
What this means for you Summary
Snapshot
- This is a 2-bed/1.0-bath single-family listed at $39k. Condition is rated fair.
Deal economics
- At list price, monthly cash flow is $382 ($5k/yr) — positive.
- The deal already cash-flows at list — no discount required.
- Meets the 1% rule at list price ($825 rent vs $39k).
Location & tenants
- Location reads: area grade B — affects rentability + tenant quality, not the cash-flow math above.
- St Regis K-12 Schools (rural): math 30% / reading 45% proficiency, ranked #172 of 339 in MT (top 51%) — families likely to look elsewhere, expect single-tenant / working-renter base with shorter leases.
- Market conditions: 27 active listings in the ZIP; 1 comparable units currently listed for rent nearby; 4 units permitted in Mineral County in 2024 (0 in 5+ unit buildings).
Forward outlook
- In year one you build about $1k of equity ($270 loan paydown + $744 appreciation (1.9% local appreciation)).
- Mineral County population projected at -12% by 2050 — secular population decline; favor cash flow + early exit over multi-decade hold.
- At projected returns (1.9% appreciation + 3.0% rent growth), your $11k cash investment doubles in ~2 years — after that, you're playing with house money.
Negotiation context
- Only 7 days on market — expect competitive offers; lowballing is unlikely to land.
Risks & watch-outs
- Climate carrying-cost: major wildfire risk — expect insurance premiums to compound above CPI over the hold.
Questions for the listing agent
- Have any recent inspections been done? Can we get a copy of the seller's disclosures and any deferred-maintenance estimates?
- Built in 1968 — when were the roof, HVAC, electrical panel, plumbing, and water heater last replaced?
- Is there a deadline driving the sale (1031 exchange, divorce, estate, relocation)? That informs how much negotiation room exists.
- What's the average days-on-market for RENTAL listings here right now (not sales)? A rising rental-DOM trend means longer vacancies and softer asking-rent achievability than the comps imply.
- What's the recent tenant-quality profile in this submarket — average credit score on applications, eviction rate, late-payment / NSF rate, and stable-employment percentage? A property-management company in the area should have these aggregated.
- How much new for-sale + rental construction is in the pipeline within 1–3 miles? Heavy new supply typically softens prices + rents 12–24 months out; constrained supply supports both.
Investment metrics
- 1% rule
- 2.12% ✓
- Cap rate
- 18.05%
- Cash-on-cash
- 42.00%
- DSCR
- 2.87
- GRM
- 3.9
CMA / ARV
No comps found within radius.
Projected returns pro-forma
1.91% appreciation · 3.0% rent growth · sell at horizon
- IRR
- 45.9%
- Equity multiple
- 3.46×
- Total profit
- $26,846
- Equity at exit
- $15,187
- IRR
- 46.7%
- Equity multiple
- 6.89×
- Total profit
- $64,351
- Equity at exit
- $21,719
Cash invested: $10,920 (down + closing). Projections, not guarantees.
Landlord ↔ Tenant lean methodology
- Overall (STATE)
- 82 Strongly Landlord-Friendly
- State Montana
- 82 Strongly Landlord-Friendly · R+11
- County
- — inherits STATE
- City
- — inherits STATE
ZIP-level market 59866
- Home prices YoY
- 0.8%
- Active inventory
- 27
- Price-to-rent
- 3.9×
Monthly cashflow live
- Estimated rent
- $825 medium interval (Pro) →
- Mortgage (P&I)
- −$205
- Tax est. 1.5%
- −$49 /mo · $585/yr
- Insurance
- −$16
- HOA
- −$0
- Vacancy / Maint / Mgmt
- −$173
- Net cashflow
- $382
Break-even live
UW: 25.0% down · 7.5% · 30yr · 1.5% tax · 5.0% vac · 8.0% maint · 8.0% mgmt
Financing live
Cash to close
- Down payment
- $9,750
- Closing costs
- $1,170
- Reserves months
- —
- Total cash needed
- —
Loan-product check · same deal, 3 products live
Conventional
25% down · 7.5% · 30yr
- Down + closing
- —
- Monthly P&I
- —
- Monthly cashflow
- —
- DSCR
- —
- Eligible?
- —
Personal DTI + credit; lowest rate.
DSCR
20% down · 8.5% · 30yr
- Down + closing
- —
- Monthly P&I
- —
- Monthly cashflow
- —
- DSCR
- —
- Eligible?
- —
No personal income docs; deal must DSCR.
Hard money
10% down · 12.0% · 12mo
- Down + closing
- —
- Monthly P&I
- —
- Monthly cashflow
- —
- DSCR
- —
- Eligible?
- —
Short-term bridge; refi at stabilization.
Rent comps 1 comps
| Address | Beds | Baths | Sqft | Rent | $/sqft | DOM | Units | Dist |
|---|---|---|---|---|---|---|---|---|
| 1130 Montana 135 Lot 5 St Regis, MT | 2.0 | 1.0 | 600 | $825 | $1.38 | 43d | 1 | 1.07mi |
Listing history 6 events
-
2026-06-18days on market $39,000 Active 7 DOM
-
2026-06-17days on market $39,000 Active 6 DOM
-
2026-06-16days on market $39,000 Active 5 DOM
-
2026-06-15days on market $39,000 Active 4 DOM
-
2026-06-13days on market $39,000 Active 2 DOM
-
2026-06-12$39,000 Active 1 DOM
ⓘ Source: listings_history table (triggers on properties + properties_extension) + one-shot
backfill from property_details.listing_events for pre-trigger history.
Climate risk First Street
- Flood 1/10 Low FEMA zone X · 0% chance over 30 yrs
- Wildfire 7/10 Severe
- Heat 3/10 Moderate 7 d/yr ≥92°F today · 17 d/yr by 30 yrs out
- Wind 1/10 Low
- Air quality 9/10 Extreme 14 unhealthy d/yr today · 19 by 30 yrs out
Nearby sold comps map
Loading sold comps map…
Walkable amenities ~0.75 mi
Loading nearby amenities…
Taxation est. · year 1
- Rental income
- $9,900
- − Mortgage interest
- −$2,185
- − Property taxes
- −$585
- − Insurance
- −$195
- − Repairs & maintenance
- −$792
- − Management
- −$792
- − Depreciation
- −$1,135
- Taxable income
- $4,217
- Est. tax owed @ 24.0%
- −$1,012
- After-tax cash flow
- $3,575/yr
For passive investors: Depreciation is non-cash, so a rental often shows a tax loss while cash-flowing — sheltering income. Rental losses are passive: they offset passive income freely, and up to $25,000/yr can offset ordinary (W-2) income if you actively participate and your MAGI is under $100k (phasing out to $0 by $150k); unused losses carry forward. On sale, claimed depreciation is recaptured at up to 25%, and gains may owe capital-gains tax (a 1031 exchange can defer both). Figures are a year-1 estimate at your 24.0% rate — not tax advice; consult a CPA.
Condition & rehab AI · 9 photos
The property requires significant repairs and maintenance, particularly to the roof and exterior, to improve its condition and value.
Repairs flagged
- Major roof — visible rust and wear
- Major exterior siding — exposed and damaged
- Major windows — some appear boarded up
Value-add opportunities
- Resale paint interior walls — enhances curb appeal
- Resale replace countertops — modernizes kitchen
- Resale repair flooring — improves overall condition
- Resale repair roof — fixes major structural issue
- Resale repair exterior siding — enhances curb appeal
- Resale repair windows — fixes major structural issue
Renovation cost estimate screening
| Repair item | Severity | Est. cost |
|---|---|---|
| roof · visible rust and wear | Major | $15,000–50,000 |
| exterior siding · exposed and damaged | Major | $15,000–50,000 |
| windows · some appear boarded up | Major | $15,000–50,000 |
| Total estimated repair cost · 3 items | $45,000–150,000 |
Value-add ROI direction
- Resale paint interior walls — enhances curb appeal ↑
- Resale replace countertops — modernizes kitchen ↑
- Resale repair flooring — improves overall condition ↑
- Resale repair roof — fixes major structural issue ↑
- Resale repair exterior siding — enhances curb appeal ↑
- Resale repair windows — fixes major structural issue ↑
ⓘ Cost ranges are severity-bucket heuristics (US national rule-of-thumb). Get contractor quotes + a written scope before underwriting a rehab budget.
Schools (NCES district)
- District
- St Regis K-12 Schools
- NCES district ID
- 3024930
- Math proficiency
- 30% ▼ -5.00%
- Reading proficiency
- 45% ▼ -5.00%
- Median HH income
- $36,799
- Composite
- 33.66/100
- National rank
- #10455
- State rank
- #172 of 339 in MT
Livability — St. Regis
No livability data for this city. (Only ~50 U.S. cities are tracked.)
Census & demographics
- Population (ZIP)
- 1,152
Population outlook (Mineral County) Hauer SSP2
- Today (2025)
- 4,193 people
- By 2030
- 4,099 · -2.2%
- By 2040
- 3,852 · -8.1%
- By 2050
- 3,678 · -12.3%
- By 2075
- 3,869 · -7.7%
- By 2100
- 4,331 · +3.3%
Race, ethnicity, and origin ACS 2023
- Neighborhood character
- Predominantly White (87%)
- Race & ethnicity
- White 87% Hispanic / Latino 5% Two or more races 4% Native American 4% Black 1%
- Hispanic origin (detail)
- Mexican 1%
- Common ancestry
- Lithuanian 6% Portuguese 3% Danish 2%
- Languages at home
- 98% English-only · Spanish 2%
Political lean MEDSL · Mineral
- 2024 margin
- Solid R (+48.0) · D 24.3% · R 72.3% · Other 3.4%
- 2008→2024 swing
- -37.6pp toward R · 2008: -10.4pp · 2024: -48.0pp
- All cycles
- 2024: R+48.0 2020: R+44.5 2016: R+40.9 2012: R+25.6 2008: R+10.4
Not yet ingested
- Civics
- —
Market trends
- HPI YoY
- ▲ 1.91%
- Current HPI
- 255.8766
- Rent YoY
- —
- Metro
- —
- State GDP YoY
- ▲ 3.41%
- F500 in state
- 2
Industry mix (Fortune 500 HQ in MT)
| Industry | F500 HQs | Revenue |
|---|---|---|
| Technology / Analytics | 1 | $2B |
|
||
Price history
1 event — show timeline
- 2026-06-11 Listed $39,000 MRMLS
Cash-flow waterfall
monthlySold comps — $/sqft
last 12 mo · ≤1 miLoading sold comps…