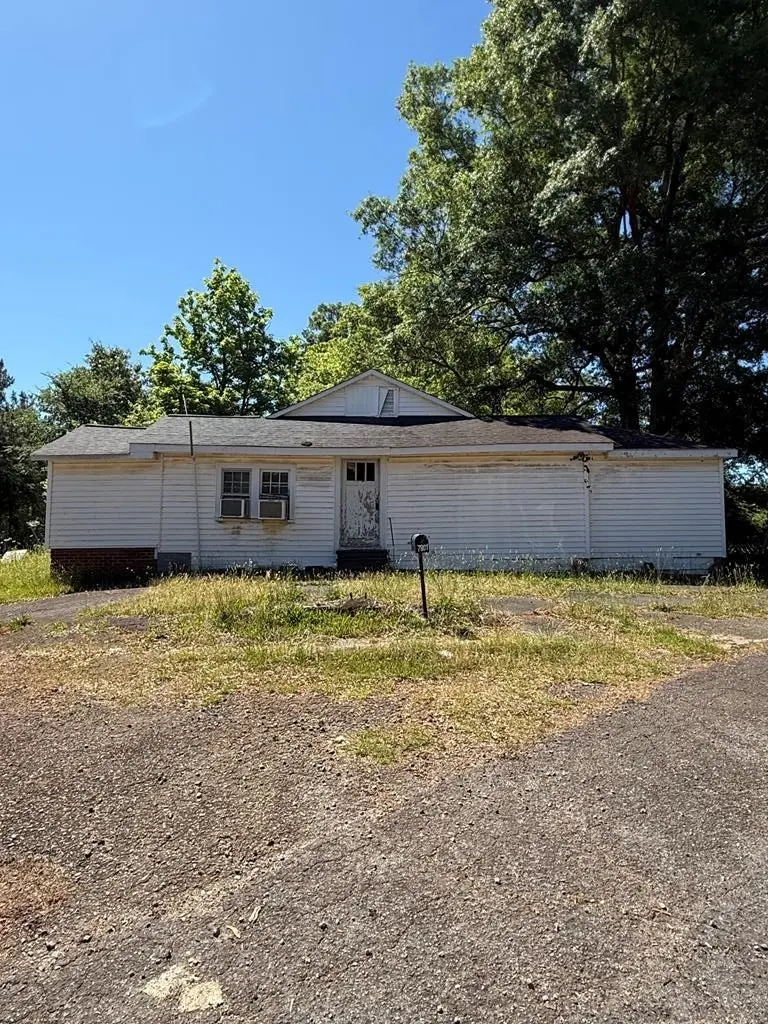
7801 Hwy 246 S · Ninety Six, SC
Flood risk 1/10 · Minimal
- FEMA flood zone
- X (unshaded)
- Chance of flooding over 30 yrs
- 0.0%
- Est. flood insurance / yr
- $507 – $1,088
Fire risk 4/10 · Minor
- Est. fire insurance / yr
- $783 – $1,453
Heat risk 6/10 · Moderate
- Hot days now (above 107°F)
- 7 days/yr
- Hot days in 30 yrs
- 16 days/yr
Wind risk 6/10 · Moderate
- Chance of severe wind over 30 yrs
- 40.0%
Air-quality risk 3/10 · Minor
- Unhealthy air days now
- 2 days/yr
- Unhealthy air days in 30 yrs
- 3 days/yr
Risk factors via First Street. Map © Google.
Why this score? — see what drove the B grade
The composite is a weighted blend of 9 inputs, each scored 0–100. Each bar is that input's sub-score; the figure is the points it added to the 100-point composite (weight × sub-score).
- Cash flow +30.0/30.0
- 1% rule +10.0/10.0
- DSCR +10.0/10.0
- ARV discount +7.5/15.0
- Schools +4.2/10.0
- Livability +3.6/5.0
- Rent growth +2.5/5.0
- Condition / age +2.5/5.0
- Appreciation +0.0/10.0
$72,500
🖨 Deal sheet 📄 Offer letter ✓ Due diligence
Listing remarks
7801 Hwy 246 in Ninety Six offers a rare opportunity to transform a property with endless potential. Nestled in a peaceful setting with plenty of room to work with, this property is ideal for someone looking to add value and bring new life to a home with character. The spacious lot, convenient highway access, and proximity to Greenwood make this location especially appealing for those seeking both privacy and accessibility. Whether you're planning updates, improvements, or a complete reimagining, this property provides the perfect canvas to create something truly special.
Key facts
- Highway access
- Spacious lot
- 2 acre lot
Tags
Property features AI
Exterior
- Parking: Detached parking
- Home design: Single-family detached residence; Residential property
- Exterior features: Cleared and wooded lot; Shed on the property; Has a view
Interior
- Flooring: Vinyl
- Bathrooms: 1 full bathroom
- Heating & cooling: Window unit cooling
- Interior features: Vinyl flooring; Window cooling units
Neighborhood map
What this means for you Summary
Snapshot
- This is a 2-bed/1.0-bath other listed at $72k.
Deal economics
- At list price, monthly cash flow is $939 ($11k/yr) — positive.
- The deal already cash-flows at list — no discount required.
- Meets the 1% rule at list price ($2k rent vs $72k).
- Recommended offer: $70k (3.0% below list) — sets the bar for market timing.
- Cap rate 21.8% vs local median 2.3% in Ninety Six — top-decile yield for the area; either an underpriced asset or a hidden risk that comps aren't pricing in. Stress-test before assuming the spread holds.
Location & tenants
- Location reads 71/100 on livability (#51 in SC) — a middle-class / working-renter tenant base. Strengths: cost of living A+, housing A+, crime B+; Watch: employment C-, health & safety C-, amenities F.
- Greenwood 52 (rural): math 46% / reading 54% proficiency, ranked #8 of 80 in SC (top 10%) — acceptable for families but not a draw, mixed tenant base, ~2y average lease.
- Market conditions: 105 active listings in the ZIP; 193 units permitted in Greenwood County in 2024 (0 in 5+ unit buildings).
Forward outlook
- Local home prices are declining (-3.0%/yr); year-one equity from $501 of loan paydown is wiped out by about $2k of value loss. Plan a longer hold.
- Greenwood County population projected to shrink 8% by 2050 — rents likely to lag national; underwrite the cash flow, not the appreciation.
- At projected returns (-3.0% appreciation + 3.0% rent growth), your $20k cash investment doubles in ~3 years — after that, you're playing with house money.
Negotiation context
- It's been on market 34 days — a 3% lower offer ($70k) is reasonable based on typical stale-listing flexibility.
- Current owner paid $10k; list at $72k implies a 625% gain — meaningful room to come down on a strong offer.
Risks & watch-outs
- Watch-outs: built in 1945 — expect roof / HVAC / electrical / plumbing capex.
- Climate carrying-cost: major wind risk, 40% chance of damaging wind over 30y; extreme-heat days projected 7→16/yr by 2055 (HVAC capex compounding) — expect insurance premiums to compound above CPI over the hold.
Questions for the listing agent
- It's been on market 34 days. Have you received any prior offers? Is the seller open to a 3% concession, seller financing, or rate buy-down credit?
- Built in 1945 — when were the roof, HVAC, electrical panel, plumbing, and water heater last replaced?
- Is there a deadline driving the sale (1031 exchange, divorce, estate, relocation)? That informs how much negotiation room exists.
- What's the average days-on-market for RENTAL listings here right now (not sales)? A rising rental-DOM trend means longer vacancies and softer asking-rent achievability than the comps imply.
- What's the recent tenant-quality profile in this submarket — average credit score on applications, eviction rate, late-payment / NSF rate, and stable-employment percentage? A property-management company in the area should have these aggregated.
- How much new for-sale + rental construction is in the pipeline within 1–3 miles? Heavy new supply typically softens prices + rents 12–24 months out; constrained supply supports both.
Investment metrics
- 1% rule
- 2.52% ✓
- Cap rate
- 21.84%
- Cash-on-cash
- 55.53%
- DSCR
- 3.47
- GRM
- 3.3
CMA / ARV
No comps found within radius.
Projected returns pro-forma
-3.0% appreciation · 3.0% rent growth · sell at horizon
- IRR
- 53.9%
- Equity multiple
- 3.37×
- Total profit
- $48,116
- Equity at exit
- $10,810
- IRR
- 59.0%
- Equity multiple
- 6.87×
- Total profit
- $119,065
- Equity at exit
- $6,268
Cash invested: $20,300 (down + closing). Projections, not guarantees.
Landlord ↔ Tenant lean methodology
- Overall (STATE)
- 90 Strongly Landlord-Friendly
- State South Carolina
- 90 Strongly Landlord-Friendly · R+6
- County
- — inherits STATE
- City
- — inherits STATE
ZIP-level market 29666
- Active inventory
- 105
- Price-to-rent
- 3.3×
Monthly cashflow live
- Estimated rent
- $1,827 medium interval (Pro) →
- Mortgage (P&I)
- −$380
- Tax from tax record
- −$93 /mo · $1,122/yr
- Insurance
- −$30
- HOA
- −$0
- Vacancy / Maint / Mgmt
- −$384
- Net cashflow
- $939
Break-even live
UW: 25.0% down · 7.5% · 30yr · 1.5% tax · 5.0% vac · 8.0% maint · 8.0% mgmt
Financing live
Cash to close
- Down payment
- $18,125
- Closing costs
- $2,175
- Reserves months
- —
- Total cash needed
- —
Loan-product check · same deal, 3 products live
Conventional
25% down · 7.5% · 30yr
- Down + closing
- —
- Monthly P&I
- —
- Monthly cashflow
- —
- DSCR
- —
- Eligible?
- —
Personal DTI + credit; lowest rate.
DSCR
20% down · 8.5% · 30yr
- Down + closing
- —
- Monthly P&I
- —
- Monthly cashflow
- —
- DSCR
- —
- Eligible?
- —
No personal income docs; deal must DSCR.
Hard money
10% down · 12.0% · 12mo
- Down + closing
- —
- Monthly P&I
- —
- Monthly cashflow
- —
- DSCR
- —
- Eligible?
- —
Short-term bridge; refi at stabilization.
Listing history 17 events
-
2026-06-19days on market $72,500 Active 34 DOM
-
2026-06-18days on market $72,500 Active 33 DOM
-
2026-06-17days on market $72,500 Active 32 DOM
-
2026-06-16days on market $72,500 Active 31 DOM
-
2026-06-15days on market $72,500 Active 30 DOM
-
2026-06-14days on market $72,500 Active 28 DOM
-
2026-06-12days on market $72,500 Active 27 DOM
-
2026-06-09days on market $72,500 Active 24 DOM
-
2026-06-08days on market $72,500 Active 23 DOM
-
2026-06-07days on market $72,500 Active 22 DOM
-
2026-06-07days on market $72,500 Active 21 DOM
-
2026-06-02days on market $72,500 Active 17 DOM
-
2026-06-01days on market $72,500 Active 16 DOM
-
2026-05-31days on market $72,500 Active 15 DOM
-
2026-05-30days on market $72,500 Active 14 DOM
-
2026-05-16$72,500 Active
-
2025-02-14soldstatus $10,000
ⓘ Source: listings_history table (triggers on properties + properties_extension) + one-shot
backfill from property_details.listing_events for pre-trigger history.
Tax reassessment forecast SC · Resets to sale price
- Current annual tax
- $1,122 · $93/mo
- Projected year-2 tax
- $1,122 · $93/mo
- Expected delta
- $0/yr ($0/mo · 0.0%)
ⓘ Screening estimate from a state-policy table — verify with the county assessor before closing.
Climate risk First Street
- Flood 1/10 Low FEMA zone X (unshaded) · 0% chance over 30 yrs
- Wildfire 4/10 Moderate
- Heat 6/10 Major 7 d/yr ≥107°F today · 16 d/yr by 30 yrs out
- Wind 6/10 Major 40% chance of damaging wind over 30 yrs
- Air quality 3/10 Moderate 2 unhealthy d/yr today · 3 by 30 yrs out
Nearby sold comps map
Loading sold comps map…
Walkable amenities ~0.75 mi
Loading nearby amenities…
Taxation est. · year 1
- Rental income
- $21,924
- − Mortgage interest
- −$4,061
- − Property taxes
- −$1,122
- − Insurance
- −$362
- − Repairs & maintenance
- −$1,754
- − Management
- −$1,754
- − Depreciation
- −$2,109
- Taxable income
- $10,762
- Est. tax owed @ 24.0%
- −$2,583
- After-tax cash flow
- $8,691/yr
For passive investors: Depreciation is non-cash, so a rental often shows a tax loss while cash-flowing — sheltering income. Rental losses are passive: they offset passive income freely, and up to $25,000/yr can offset ordinary (W-2) income if you actively participate and your MAGI is under $100k (phasing out to $0 by $150k); unused losses carry forward. On sale, claimed depreciation is recaptured at up to 25%, and gains may owe capital-gains tax (a 1031 exchange can defer both). Figures are a year-1 estimate at your 24.0% rate — not tax advice; consult a CPA.
Schools (NCES district)
- District
- Greenwood 52
- NCES district ID
- 4502400
- Math proficiency
- 46% ▬ 0.00%
- Reading proficiency
- 54% ▲ 5.00%
- Median HH income
- $45,562
- Composite
- 42.33/100
- National rank
- #3255
- State rank
- #8 of 80 in SC
Livability — Ninety Six
- Score
- 71/100
- State rank
- #51
- US rank
- #6950
Category grades
Schools grade is shown separately in the Schools card above.
Census & demographics
- Population (ZIP)
- 6,751
Population outlook (Greenwood County) Hauer SSP2
- Today (2025)
- 69,627 people
- By 2030
- 68,905 · -1.0%
- By 2040
- 66,640 · -4.3%
- By 2050
- 63,768 · -8.4%
- By 2075
- 55,769 · -19.9%
- By 2100
- 47,293 · -32.1%
Race, ethnicity, and origin ACS 2023
- Neighborhood character
- Predominantly White (79%)
- Race & ethnicity
- White 79% Black 13% Hispanic / Latino 5% Two or more races 4%
- Common ancestry
- Romanian 6% Serbian 3% Slovak 2%
- Foreign-born
- 2% · Canada, South Korea
- Languages at home
- 98% English-only · Spanish 1%
Political lean MEDSL · Greenwood
- 2024 margin
- Strong R (+29.0) · D 34.9% · R 63.8% · Other 1.3%
- 2008→2024 swing
- -13.3pp toward R · 2008: -15.7pp · 2024: -29.0pp
- All cycles
- 2024: R+29.0 2020: R+22.8 2016: R+21.8 2012: R+15.4 2008: R+15.7
Not yet ingested
- Civics
- —
Market trends
- HPI YoY
- ▼ -119.76%
- Current HPI
- 159.4154
- Rent YoY
- —
- Metro
- —
- State GDP YoY
- ▲ 4.51%
- F500 in state
- 2
Industry mix (Fortune 500 HQ in SC)
| Industry | F500 HQs | Revenue |
|---|---|---|
| Packaging | 1 | $7B |
|
||
Price history
+625.0% since first listed2 events — show timeline
- 2026-05-16 Listed $72,500 GAOR
- 2025-02-14 Sold (Public Records) $10,000 Public Records
Property tax history
+0.9%/yrLatest (2025): $1,122 · +160.2% YoY. Source: county tax records.
Cash-flow waterfall
monthlySold comps — $/sqft
last 12 mo · ≤1 miLoading sold comps…