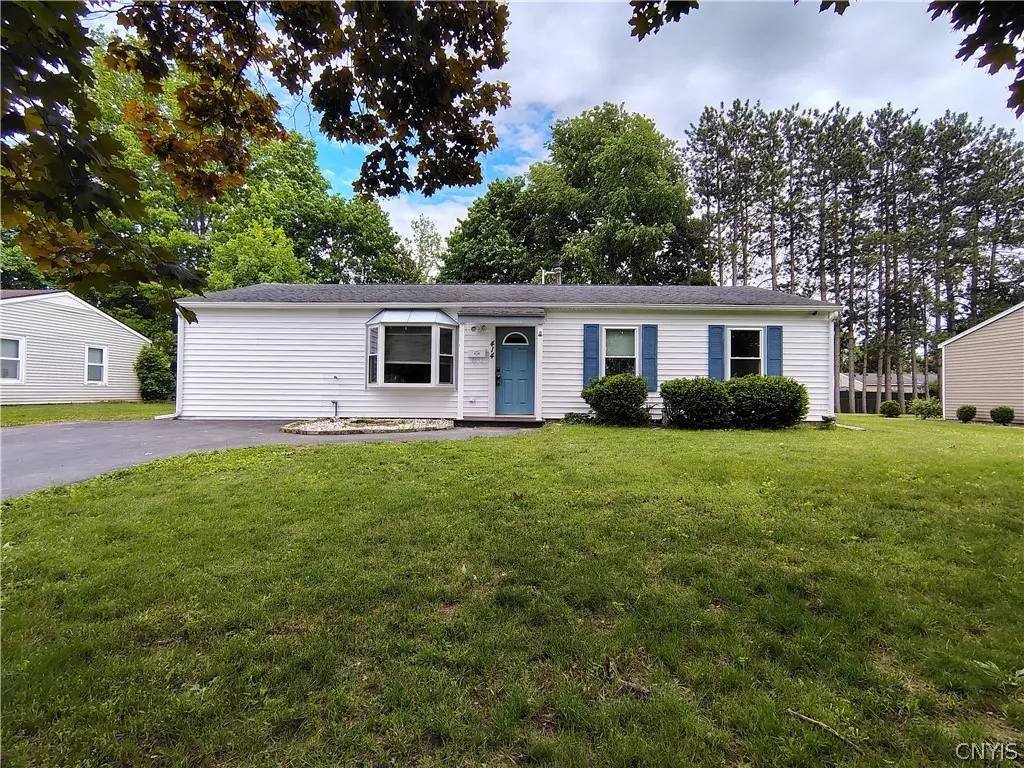
414 Williamsburg Rd · Utica, NY
Flood risk 1/10 · Minimal
- FEMA flood zone
- X (unshaded)
- Chance of flooding over 30 yrs
- 0.0%
- Est. flood insurance / yr
- $507 – $1,088
Fire risk 2/10 · Minimal
- Est. fire insurance / yr
- $691 – $1,283
Heat risk 3/10 · Minor
- Hot days now (above 96°F)
- 7 days/yr
- Hot days in 30 yrs
- 16 days/yr
Wind risk 2/10 · Minimal
- Chance of severe wind over 30 yrs
- 1.0%
Air-quality risk 2/10 · Minimal
- Unhealthy air days now
- 0 days/yr
- Unhealthy air days in 30 yrs
- 1 days/yr
Risk factors via First Street. Map © Google.
Why this score? — see what drove the D grade
The composite is a weighted blend of 9 inputs, each scored 0–100. Each bar is that input's sub-score; the figure is the points it added to the 100-point composite (weight × sub-score).
- Cash flow +14.7/30.0
- ARV discount +7.3/15.0
- DSCR +4.5/10.0
- Livability +4.0/5.0
- 1% rule +3.2/10.0
- Schools +2.9/10.0
- Rent growth +2.5/5.0
- Condition / age +2.5/5.0
- Appreciation +0.0/10.0
$199,900
🖨 Deal sheet (PDF) 📄 Offer letter ✓ Due diligence
Listing remarks MLS
This adorable 3 bedroom ranch in a peaceful North Utica neighborhood is conveniently located just minutes from shopping and close to the Elementary school. Move right in to this beautifully renovated and tastefully decorated home. The updated kitchen features lots of cabinet space and stainless steel appliances. Plenty of natural light shines through the new windows and doors throughout. Enjoy your morning coffee or entertain friends on the Trex composite deck in the fenced in backyard. Enjoy easy living in this beauty. So many updates! A must see!
Key facts
- Kraftmaid cabinetry
- Storage shed
- Rear deck
Tags
Property features AI
Exterior
- Parking: No garage
- Utilities: Electricity connected (circuit breakers); Public water connected; Sewer connected; High-speed internet available; Cable available
- Home design: Single-story home; Pitched shingle roof; Vinyl siding; Slab foundation; Existing/resale property; Rectangular lot near public transit (75 x 110)
- Construction: Built with vinyl siding; Copper plumbing
- Exterior features: Blacktop driveway; Deck; Fully fenced yard; Shed(s)/storage
Interior
- Kitchen: Dishwasher; Free-standing range; Microwave; Oven; Refrigerator; Eat-in kitchen
- Bedrooms: Four main-level bedrooms
- Flooring: Carpet; Laminate; Varies
- Bathrooms: One full bathroom on the main level
- Heating & cooling: Gas forced-air heating; Central air conditioning
- Interior features: Ceiling fan(s); Eat-in kitchen; Separate/formal living room; Natural woodwork; Thermal windows; Accessible bedroom; Main level primary
- Laundry & utility: Main-level laundry; Gas water heater; Tankless water heater
Neighborhood map
What this means for you Summary
Snapshot
- This is a 3-bed/1.0-bath single-family listed at $200k.
Deal economics
- At list price, monthly cash flow is $51 ($615/yr) — positive.
- The deal already cash-flows at list — no discount required.
- To meet the 1% rule (rent ≥ 1% of price), the offer needs to be $165k (17.5% below list).
- Recommended offer: $165k (17.5% below list) — sets the bar for 1% rule.
Location & tenants
- Location reads 80/100 on livability (#104 in NY, #1,589 nationally) — a professional / high-income tenant draw. Strengths: commute A+, cost of living A+, housing A+; Watch: employment D, crime F.
- Utica City School District (urban): math 33% / reading 38% proficiency, ranked #562 of 590 in NY (top 95%) — families likely to look elsewhere, expect single-tenant / working-renter base with shorter leases; 71% free/reduced lunch — lower-income household profile, screen leases tightly.
- Zoned schools: General Herkimer Elementary School (math 29% / reading 42%, grade F, #1,566 of 2,108 statewide, top 74%, 597 students, 76% FRL); John F Kennedy Middle School (math 27% / reading 35%, grade F, #534 of 729 statewide, top 73%, 695 students, 77% FRL); Thomas R Proctor High School (math 86% / reading 62%, grade B+, #659 of 1,100 statewide, top 60%, 2,675 students, 76% FRL) — zoned schools at 76% FRL track the district average.
- Market conditions: 150 active listings in the ZIP; 204 units permitted in Oneida County in 2024 (68 in 5+ unit buildings).
- This rent runs 34% of the median local income ($58k/yr) — at the standard rent-burdened threshold; future hikes will face affordability resistance.
Forward outlook
- Local home prices are declining (-3.0%/yr); year-one equity from $1k of loan paydown is wiped out by about $6k of value loss. Plan a longer hold.
- Oneida County population projected at -12% by 2050 — secular population decline; favor cash flow + early exit over multi-decade hold.
Negotiation context
- It's been on market 20 days — a 2% lower offer ($197k) is reasonable based on typical stale-listing flexibility.
- 2 sale attempts since 7y ago with the ask held roughly flat each time — persistent listings suggest the price (not the market) is what's stuck; bring a comps-based counter.
- Current owner paid $100k; list at $200k implies a 100% gain — meaningful room to come down on a strong offer.
Risks & watch-outs
- Watch-outs: built in 1959 — expect roof / HVAC / electrical / plumbing capex.
Questions for the listing agent
- Built in 1959 — when were the roof, HVAC, electrical panel, plumbing, and water heater last replaced?
- Is there a deadline driving the sale (1031 exchange, divorce, estate, relocation)? That informs how much negotiation room exists.
- Schools are D-rated, which usually means shorter tenancies and higher turnover. Who's the typical renter profile here, and what's been the actual vacancy rate?
- Crime grade is F in this area — have there been break-ins, vandalism, or insurance claims at this property in the last 3 years? What carrier currently insures it and at what premium?
- The area grade is low — what's the realistic commute time and amenity access for the typical tenant pool here? Any planned neighborhood developments (good or bad) we should know about?
- What's the average days-on-market for RENTAL listings here right now (not sales)? A rising rental-DOM trend means longer vacancies and softer asking-rent achievability than the comps imply.
- What's the recent tenant-quality profile in this submarket — average credit score on applications, eviction rate, late-payment / NSF rate, and stable-employment percentage? A property-management company in the area should have these aggregated.
- How much new for-sale + rental construction is in the pipeline within 1–3 miles? Heavy new supply typically softens prices + rents 12–24 months out; constrained supply supports both.
Investment metrics
- 1% rule
- 0.82% ✗
- Cap rate
- 6.60%
- Cash-on-cash
- 1.10%
- DSCR
- 1.05
- GRM
- 10.1
CMA / ARV
- ARV (on-the-fly)
- $198,875
- Comps found
- 12
Show comp detail 12 sales within ~0.75 mi
| Address | Dist | Beds/Ba | Sqft | Sold | Price | $/sf | Match |
|---|---|---|---|---|---|---|---|
| 508 Deerwood Rd | 0.29mi | 3/1.0 | 900 (-3%) | 4mo | $168,000 | $187 | 78 |
| 1216 Crestview Ave | 0.15mi | 2/1.0 (-1) | 950 (+3%) | 8mo | $210,900 | $222 | 77 |
| 445 Parklane Dr | 0.20mi | 3/1.0 | 950 (+3%) | 15mo | $182,000 | $192 | 74 |
| 435 Brody Dr | 0.42mi | 3/1.0 | 912 (-1%) | 7mo | $210,000 | $230 | 72 |
| 429 Brody Dr | 0.41mi | 2/1.0 (-1) | 960 (+4%) | 3mo | $135,000 | $141 | 67 |
| 418 Fiore Dr | 0.48mi | 3/1.5 | 936 (+1%) | 12mo | $187,000 | $200 | 64 |
| 455 Lee Blvd | 0.38mi | 2/1.0 (-1) | 864 (-7%) | 8mo | $219,900 | $255 | 59 |
| 454 Elmhurst Rd | 0.63mi | 3/1.0 | 988 (+7%) | 5mo | $212,000 | $215 | 55 |
| 402 Northrup Dr | 0.30mi | 4/1.5 (+1) | 1,032 (+12%) | 10mo | $226,600 | $220 | 52 |
| 704 Burth Pl | 0.75mi | 3/1.0 | 952 (+3%) | 14mo | $199,280 | $209 | 49 |
| 414 Woodburne Dr | 0.74mi | 3/1.0 | 957 (+4%) | 15mo | $185,000 | $193 | 47 |
| 427 Elmhurst Rd | 0.71mi | 2/1.0 (-1) | 977 (+6%) | 8mo | $214,900 | $220 | 46 |
Match score weights: distance 35% · size 25% · config 20% · recency 20%. Top-matched comps best support the ARV.
Projected returns pro-forma
-3.0% appreciation · 3.0% rent growth · sell at horizon
- IRR
- -14.6%
- Equity multiple
- 0.48×
- Total profit
- $-29,182
- Equity at exit
- $29,806
- IRR
- -5.9%
- Equity multiple
- 0.62×
- Total profit
- $-21,430
- Equity at exit
- $17,284
Cash invested: $55,972 (down + closing). Projections, not guarantees.
Landlord ↔ Tenant lean methodology
- Overall (STATE)
- 15 Strongly Tenant-Friendly
- State New York
- 15 Strongly Tenant-Friendly · D+10
- County
- — inherits STATE
- City
- — inherits STATE
ZIP-level market 13502
- Home prices YoY
- -12.1%
- Active inventory
- 150
- Price-to-rent
- 10.1×
Monthly cashflow live
- Estimated rent
- $1,649 medium interval (Pro) →
- Mortgage (P&I)
- −$1,048
- Tax from tax record
- −$120 /mo · $1,435/yr
- Insurance
- −$83
- HOA
- −$0
- Vacancy / Maint / Mgmt
- −$346
- Net cashflow
- $51
Break-even live
Sensitivity live
| Price | -10% $164 | -5% $108 | +0% $51 | +5% $-5 | +10% $-62 |
|---|---|---|---|---|---|
| Rent | -10% $-79 | -5% $-14 | +0% $51 | +5% $116 | +10% $182 |
| Rate | -1.0pp $152 | -0.5pp $102 | base $51 | +0.5pp $-1 | +1.0pp $-53 |
UW: 25.0% down · 7.5% · 30yr · 1.5% tax · 5.0% vac · 8.0% maint · 8.0% mgmt
Financing live
Cash to close
- Down payment
- $49,975
- Closing costs
- $5,997
- Reserves months
- —
- Total cash needed
- —
Loan-product check · same deal, 3 products live
Conventional
25% down · 7.5% · 30yr
- Down + closing
- —
- Monthly P&I
- —
- Monthly cashflow
- —
- DSCR
- —
- Eligible?
- —
Personal DTI + credit; lowest rate.
DSCR
20% down · 8.5% · 30yr
- Down + closing
- —
- Monthly P&I
- —
- Monthly cashflow
- —
- DSCR
- —
- Eligible?
- —
No personal income docs; deal must DSCR.
Hard money
10% down · 12.0% · 12mo
- Down + closing
- —
- Monthly P&I
- —
- Monthly cashflow
- —
- DSCR
- —
- Eligible?
- —
Short-term bridge; refi at stabilization.
Listing history 16 events
-
2026-06-22days on market $199,900 Active 20 DOM
-
2026-06-19days on market $199,900 Active 18 DOM
-
2026-06-18days on market $199,900 Active 17 DOM
-
2026-06-17days on market $199,900 Active 16 DOM
-
2026-06-16days on market $199,900 Active 15 DOM
-
2026-06-15price $199,900 Active 14 DOM
-
2026-06-15days on market $209,900 Active 14 DOM
-
2026-06-14days on market $209,900 Active 12 DOM
-
2026-06-13days on market $209,900 Active 11 DOM
-
2026-06-10days on market $209,900 Active 9 DOM
-
2026-06-09days on market $209,900 Active 8 DOM
-
2026-06-08days on market $209,900 Active 7 DOM
-
2026-06-07days on market $209,900 Active 6 DOM
-
2026-06-03days on market $209,900 Active 2 DOM
-
2026-06-01remarks 699-char remark
-
2026-06-01$209,900 Active 1 DOM
ⓘ Source: listings_history table (triggers on properties + properties_extension) + one-shot
backfill from property_details.listing_events for pre-trigger history.
Tax reassessment forecast NY · Partial reset (capped growth)
- Current annual tax
- $1,435 · $120/mo
- Projected year-2 tax
- $2,407 · $201/mo
- Expected delta
- +$971/yr (+$81/mo · 67.7%)
ⓘ Screening estimate from a state-policy table — verify with the county assessor before closing.
Climate risk First Street
- Flood 1/10 Low FEMA zone X (unshaded) · 0% chance over 30 yrs
- Wildfire 2/10 Low
- Heat 3/10 Moderate 7 d/yr ≥96°F today · 16 d/yr by 30 yrs out
- Wind 2/10 Low 100% chance of damaging wind over 30 yrs
- Air quality 2/10 Low 0 unhealthy d/yr today · 1 by 30 yrs out
Nearby sold comps map
Loading sold comps map…
Walkable amenities ~0.75 mi
Loading nearby amenities…
Taxation est. · year 1
- Rental income
- $19,785
- − Mortgage interest
- −$11,198
- − Property taxes
- −$1,435
- − Insurance
- −$1,000
- − Repairs & maintenance
- −$1,583
- − Management
- −$1,583
- − Depreciation
- −$5,815
- Taxable loss
- −$2,829
- Est. tax savings @ 24.0%
- +$679
- After-tax cash flow
- $1,294/yr
For passive investors: Depreciation is non-cash, so a rental often shows a tax loss while cash-flowing — sheltering income. Rental losses are passive: they offset passive income freely, and up to $25,000/yr can offset ordinary (W-2) income if you actively participate and your MAGI is under $100k (phasing out to $0 by $150k); unused losses carry forward. On sale, claimed depreciation is recaptured at up to 25%, and gains may owe capital-gains tax (a 1031 exchange can defer both). Figures are a year-1 estimate at your 24.0% rate — not tax advice; consult a CPA.
Schools (NCES district)
- District
- Utica City School District
- NCES district ID
- 3629370
- Math proficiency
- 33% ▼ -7.00%
- Reading proficiency
- 38% ▲ 2.00%
- Median HH income
- $31,834
- Composite
- 29.01/100
- National rank
- #6613
- State rank
- #562 of 590 in NY
Livability — Utica
- Score
- 80/100
- State rank
- #104
- US rank
- #1589
Category grades
Schools grade is shown separately in the Schools card above.
Census & demographics
- Census place
- Utica, NY
- County
- Oneida County · 89,710 people
- City population
- 72,968
- Metro
- Utica-Rome, NY
- Population (ZIP)
- 34,037
- Household income
- $57,835
- Rent vs Own
- Severe rent burden
- 1604.0
Population outlook (Oneida County) Hauer SSP2
- Today (2025)
- 225,223 people
- By 2030
- 220,384 · -2.1%
- By 2040
- 209,071 · -7.2%
- By 2050
- 197,920 · -12.1%
- By 2075
- 175,541 · -22.1%
- By 2100
- 148,491 · -34.1%
Race, ethnicity, and origin ACS 2023
- Neighborhood character
- Predominantly White (71%)
- Race & ethnicity
- White 71% Hispanic / Latino 11% Black 9% Two or more races 7% Asian 5%
- Hispanic origin (detail)
- Mexican 2% Puerto Rican 5% Dominican 2%
- Common ancestry
- Romanian 11% Lithuanian 3% American 2%
- Foreign-born
- 12% · Canada, Philippines, China
- Languages at home
- 81% English-only · Spanish 7% Russian/Polish/Slavic 4% Other Asian/Pacific 3%
Political lean MEDSL · Oneida
- 2024 margin
- Strong R (+21.3) · D 39.4% · R 60.6%
- 2008→2024 swing
- -15.2pp toward R · 2008: -6.1pp · 2024: -21.3pp
- All cycles
- 2024: R+21.3 2020: R+15.5 2016: R+21.1 2012: R+5.3 2008: R+6.1
Not yet ingested
- Civics
- —
Market trends
- HPI YoY
- ▼ -50.76%
- Current HPI
- 368.3955
- Rent YoY
- —
- Metro
- Utica-Rome, NY
- State GDP YoY
- ▲ 2.60%
- F500 in state
- 92
Industry mix (Fortune 500 HQ in NY)
| Industry | F500 HQs | Revenue |
|---|---|---|
| Financial Services | 10 | $950B |
|
||
| Consumer Goods | 9 | $162B |
|
||
| Insurance | 4 | $225B |
|
||
| Telecommunications | 2 | $144B |
|
||
| Pharmaceuticals | 2 | $112B |
|
||
| Media / Entertainment | 2 | $69B |
|
||
Price history
+91.0% since first listed4 events — show timeline
- 2026-06-01 Listed $209,900 CNYIS
- 2019-06-21 Sold (Public Records) $100,000 Public Records
- 2019-06-19 Sold (MLS) $100,000 CNYIS
- 2019-04-18 Listed $109,900 CNYIS
Property tax history
-0.3%/yrLatest (2025): $1,435 · -33.5% YoY. Source: county tax records.
Cash-flow waterfall
monthlySold comps — $/sqft
last 12 mo · ≤1 miLoading sold comps…