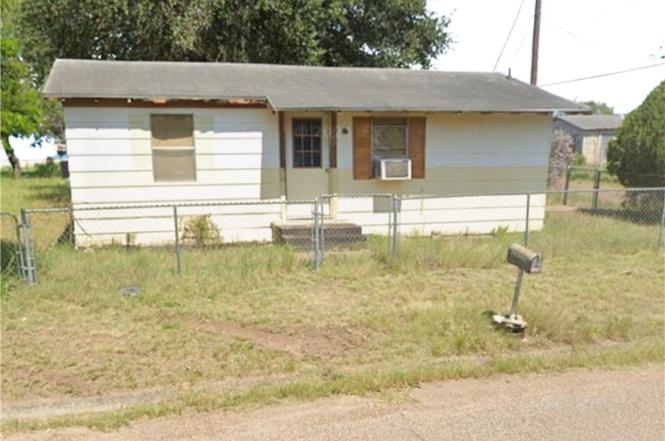
412 West Magnolia · Hebbronville, TX
Flood risk 4/10 · Minor
- FEMA flood zone
- —
- Chance of flooding over 30 yrs
- 0.24%
- Est. flood insurance / yr
- —
Fire risk 5/10 · Moderate
- Est. fire insurance / yr
- $1,222 – $2,270
Heat risk 9/10 · Severe
- Hot days now (above 111°F)
- 6 days/yr
- Hot days in 30 yrs
- 18 days/yr
Wind risk 8/10 · Major
- Chance of severe wind over 30 yrs
- 93.0%
Air-quality risk 1/10 · Minimal
- Unhealthy air days now
- 0 days/yr
- Unhealthy air days in 30 yrs
- 0 days/yr
Risk factors via First Street. Map © Google.
Why this score? — see what drove the B grade
The composite is a weighted blend of 9 inputs, each scored 0–100. Each bar is that input's sub-score; the figure is the points it added to the 100-point composite (weight × sub-score).
- Cash flow +30.0/30.0
- 1% rule +10.0/10.0
- DSCR +10.0/10.0
- ARV discount +7.5/15.0
- Appreciation +4.5/10.0
- Livability +3.1/5.0
- Schools +2.6/10.0
- Rent growth +2.5/5.0
- Condition / age +2.5/5.0
$41,500
🖨 Deal sheet (PDF) 📄 Offer letter ✓ Due diligence
Listing remarks
Investor Special!! Located in a quiet rural community, known for great hunting, this 3 bedroom 1 bath home sits on an oversized corner lot with endless potential. This home is in need of repairs offering the opportunity for a remodel or flip. The property does offer plenty of space to also build, add a garage, workshop, or even a pool to maximize the property's value. Whether you're looking for your next investment project or a fixer-upper to make our own, this property is a rare find with room to grow. Don't miss out_ bring your vision to make it happen.
Key facts
- Oversized corner lot
- Room to grow
- Plenty of space
Tags
Neighborhood map
What this means for you Summary
Snapshot
- This is a 3-bed/1.0-bath single-family listed at $42k.
Deal economics
- At list price, monthly cash flow is $344 ($4k/yr) — positive.
- The deal already cash-flows at list — no discount required.
- Meets the 1% rule at list price ($820 rent vs $42k).
- Recommended offer: $41k (1.5% below list) — sets the bar for market timing.
Location & tenants
- Location reads 61/100 on livability (#1,032 in TX) — a middle-class / working-renter tenant base. Strengths: cost of living A+, housing A+; Watch: crime D+, schools D-, amenities F.
- Jim Hogg County ISD (town): math 31% / reading 31% proficiency, ranked #622 of 826 in TX (top 75%) — families likely to look elsewhere, expect single-tenant / working-renter base with shorter leases.
- Market conditions: 36 active listings in the ZIP.
Forward outlook
- Local home prices are declining (-0.9%/yr); year-one equity from $287 of loan paydown is wiped out by about $396 of value loss. Plan a longer hold.
- Jim Hogg County population projected at -10% by 2050 — secular population decline; favor cash flow + early exit over multi-decade hold.
- At projected returns (-0.9% appreciation + 3.0% rent growth), your $12k cash investment doubles in ~3 years — after that, you're playing with house money.
Negotiation context
- It's been on market 18 days — a 2% lower offer ($41k) is reasonable based on typical stale-listing flexibility.
Risks & watch-outs
- Watch-outs: built in 1900 — expect roof / HVAC / electrical / plumbing capex.
- Climate carrying-cost: severe wind risk, 93% chance of damaging wind over 30y; moderate wildfire risk; extreme-heat days projected 6→18/yr by 2055 (HVAC capex compounding) — expect insurance premiums to compound above CPI over the hold.
Questions for the listing agent
- Built in 1900 — when were the roof, HVAC, electrical panel, plumbing, and water heater last replaced?
- Is there a deadline driving the sale (1031 exchange, divorce, estate, relocation)? That informs how much negotiation room exists.
- Schools are D-rated, which usually means shorter tenancies and higher turnover. Who's the typical renter profile here, and what's been the actual vacancy rate?
- Crime grade is D in this area — have there been break-ins, vandalism, or insurance claims at this property in the last 3 years? What carrier currently insures it and at what premium?
- What's the average days-on-market for RENTAL listings here right now (not sales)? A rising rental-DOM trend means longer vacancies and softer asking-rent achievability than the comps imply.
- What's the recent tenant-quality profile in this submarket — average credit score on applications, eviction rate, late-payment / NSF rate, and stable-employment percentage? A property-management company in the area should have these aggregated.
- How much new for-sale + rental construction is in the pipeline within 1–3 miles? Heavy new supply typically softens prices + rents 12–24 months out; constrained supply supports both.
Investment metrics
- 1% rule
- 1.98% ✓
- Cap rate
- 16.25%
- Cash-on-cash
- 35.57%
- DSCR
- 2.58
- GRM
- 4.2
CMA / ARV
No comps found within radius.
Projected returns pro-forma
-0.95% appreciation · 3.0% rent growth · sell at horizon
- IRR
- 34.8%
- Equity multiple
- 2.63×
- Total profit
- $18,919
- Equity at exit
- $10,106
- IRR
- 39.3%
- Equity multiple
- 5.15×
- Total profit
- $48,281
- Equity at exit
- $10,688
Cash invested: $11,620 (down + closing). Projections, not guarantees.
Landlord ↔ Tenant lean methodology
- Overall (STATE)
- 87 Strongly Landlord-Friendly
- State Texas
- 87 Strongly Landlord-Friendly · R+5
- County
- — inherits STATE
- City
- — inherits STATE
ZIP-level market 78361
- Home prices YoY
- -0.9%
- Active inventory
- 36
- Price-to-rent
- 4.2×
Monthly cashflow live
- Estimated rent
- $820 medium interval (Pro) →
- Mortgage (P&I)
- −$218
- Tax from tax record
- −$68 /mo · $819/yr
- Insurance
- −$17
- HOA
- −$0
- Vacancy / Maint / Mgmt
- −$172
- Net cashflow
- $344
Break-even live
Sensitivity live
| Price | -10% $368 | -5% $356 | +0% $344 | +5% $333 | +10% $321 |
|---|---|---|---|---|---|
| Rent | -10% $280 | -5% $312 | +0% $344 | +5% $377 | +10% $409 |
| Rate | -1.0pp $365 | -0.5pp $355 | base $344 | +0.5pp $334 | +1.0pp $323 |
UW: 25.0% down · 7.5% · 30yr · 1.5% tax · 5.0% vac · 8.0% maint · 8.0% mgmt
Financing live
Cash to close
- Down payment
- $10,375
- Closing costs
- $1,245
- Reserves months
- —
- Total cash needed
- —
Loan-product check · same deal, 3 products live
Conventional
25% down · 7.5% · 30yr
- Down + closing
- —
- Monthly P&I
- —
- Monthly cashflow
- —
- DSCR
- —
- Eligible?
- —
Personal DTI + credit; lowest rate.
DSCR
20% down · 8.5% · 30yr
- Down + closing
- —
- Monthly P&I
- —
- Monthly cashflow
- —
- DSCR
- —
- Eligible?
- —
No personal income docs; deal must DSCR.
Hard money
10% down · 12.0% · 12mo
- Down + closing
- —
- Monthly P&I
- —
- Monthly cashflow
- —
- DSCR
- —
- Eligible?
- —
Short-term bridge; refi at stabilization.
Listing history 3 events
-
2025-04-06status Pending
-
2025-04-01historical Active Under Contract
-
2025-03-18$41,500 Active
ⓘ Source: listings_history table (triggers on properties + properties_extension) + one-shot
backfill from property_details.listing_events for pre-trigger history.
Tax reassessment forecast TX · Resets to sale price
- Current annual tax
- $819 · $68/mo
- Projected year-2 tax
- $819 · $68/mo
- Expected delta
- $0/yr ($0/mo · 0.0%)
ⓘ Screening estimate from a state-policy table — verify with the county assessor before closing.
Climate risk First Street
- Flood 4/10 Moderate 24% chance over 30 yrs
- Wildfire 5/10 Major
- Heat 9/10 Extreme 6 d/yr ≥111°F today · 18 d/yr by 30 yrs out
- Wind 8/10 Severe 93% chance of damaging wind over 30 yrs
- Air quality 1/10 Low 0 unhealthy d/yr today · 0 by 30 yrs out
Nearby sold comps map
Loading sold comps map…
Walkable amenities ~0.75 mi
Loading nearby amenities…
Taxation est. · year 1
- Rental income
- $9,837
- − Mortgage interest
- −$2,325
- − Property taxes
- −$819
- − Insurance
- −$208
- − Repairs & maintenance
- −$787
- − Management
- −$787
- − Depreciation
- −$1,207
- Taxable income
- $3,705
- Est. tax owed @ 24.0%
- −$889
- After-tax cash flow
- $3,244/yr
For passive investors: Depreciation is non-cash, so a rental often shows a tax loss while cash-flowing — sheltering income. Rental losses are passive: they offset passive income freely, and up to $25,000/yr can offset ordinary (W-2) income if you actively participate and your MAGI is under $100k (phasing out to $0 by $150k); unused losses carry forward. On sale, claimed depreciation is recaptured at up to 25%, and gains may owe capital-gains tax (a 1031 exchange can defer both). Figures are a year-1 estimate at your 24.0% rate — not tax advice; consult a CPA.
Schools (NCES district)
- District
- Jim Hogg County ISD
- NCES district ID
- 4824750
- Math proficiency
- 31% ▼ -15.00%
- Reading proficiency
- 31% ▼ -2.00%
- Median HH income
- $35,870
- Composite
- 25.69/100
- National rank
- #7391
- State rank
- #622 of 826 in TX
Livability — Hebbronville
- Score
- 61/100
- State rank
- #1032
- US rank
- #18361
Category grades
Schools grade is shown separately in the Schools card above.
Census & demographics
- Census place
- Hebbronville, TX
- Population (ZIP)
- 4,764
Population outlook (Jim Hogg County) Hauer SSP2
- Today (2025)
- 5,023 people
- By 2030
- 4,897 · -2.5%
- By 2040
- 4,722 · -6.0%
- By 2050
- 4,510 · -10.2%
- By 2075
- 3,827 · -23.8%
- By 2100
- 2,794 · -44.4%
Race, ethnicity, and origin ACS 2023
- Neighborhood character
- Predominantly Hispanic (78%)
- Race & ethnicity
- Hispanic / Latino 78% Two or more races 40% White 21%
- Hispanic origin (detail)
- Mexican 76%
- Foreign-born
- 1% · Canada
- Languages at home
- 41% English-only · Spanish 58% Tagalog/Filipino 1%
Political lean MEDSL · Jim Hogg
- 2024 margin
- Lean D (+8.3) · D 54.0% · R 45.7%
- 2008→2024 swing
- -39.3pp toward R · 2008: 47.6pp · 2024: 8.3pp
- All cycles
- 2024: D+8.3 2020: D+17.9 2016: D+56.9 2012: D+56.7 2008: D+47.6
Not yet ingested
- Civics
- —
Market trends
- HPI YoY
- ▼ -0.95%
- Current HPI
- 99.0946
- Rent YoY
- —
- Metro
- —
- State GDP YoY
- ▲ 3.95%
- F500 in state
- 110
Industry mix (Fortune 500 HQ in TX)
| Industry | F500 HQs | Revenue |
|---|---|---|
| Energy | 16 | $1,198B |
|
||
| Technology | 5 | $198B |
|
||
| Engineering / Construction | 4 | $72B |
|
||
| Energy Services | 3 | $60B |
|
||
| Utilities | 3 | $41B |
|
||
| Healthcare | 2 | $330B |
|
||
Price history
3 events — show timeline
- 2025-04-06 Pending — CBMLS
- 2025-04-01 Contingent — CBMLS
- 2025-03-18 Listed $41,500 CBMLS
Property tax history
+6.1%/yrLatest (2025): $819 · -3.2% YoY. Source: county tax records.
Cash-flow waterfall
monthlySold comps — $/sqft
last 12 mo · ≤1 miLoading sold comps…