 🌊 Lakefront
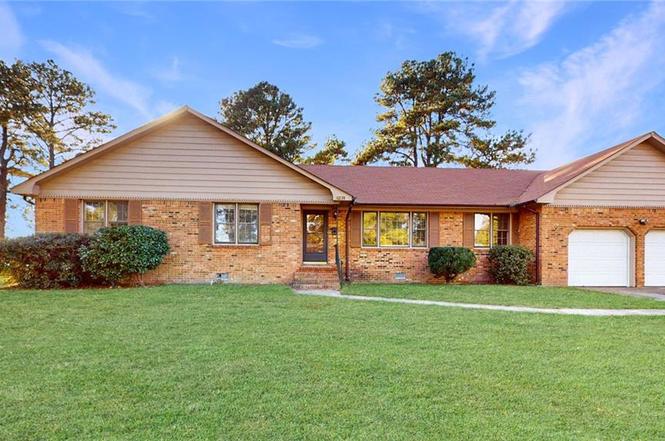
1231 Darren Dr · Portsmouth, VA
Flood risk 1/10 · Minimal
- FEMA flood zone
- X (unshaded)
- Chance of flooding over 30 yrs
- 0.0%
- Est. flood insurance / yr
- $507 – $1,088
Fire risk 1/10 · Minimal
- Est. fire insurance / yr
- $666 – $1,236
Heat risk 9/10 · Severe
- Hot days now (above 106°F)
- 7 days/yr
- Hot days in 30 yrs
- 15 days/yr
Wind risk 8/10 · Major
- Chance of severe wind over 30 yrs
- 80.0%
Air-quality risk 2/10 · Minimal
- Unhealthy air days now
- 2 days/yr
- Unhealthy air days in 30 yrs
- 2 days/yr
Risk factors via First Street. Map © Google.
Why this score? — see what drove the C- grade
The composite is a weighted blend of 9 inputs, each scored 0–100. Each bar is that input's sub-score; the figure is the points it added to the 100-point composite (weight × sub-score).
- ARV discount +15.0/15.0
- Cash flow +13.1/30.0
- Rent growth +5.0/5.0
- DSCR +3.9/10.0
- Schools +3.9/10.0
- Livability +3.7/5.0
- 1% rule +3.6/10.0
- Condition / age +2.5/5.0
- Appreciation +0.0/10.0
$270,000
🖨 Deal sheet (PDF) 📄 Offer letter ✓ Due diligence
Listing remarks
Discover the incredible potential of this single-family brick home located in a desirable Portsmouth neighborhood! Featuring a spacious 2-car garage, a large backyard for entertaining, and a solid brick exterior, this property is a true gem waiting to shine. With nearby schools and convenient access to shopping, dining, and major highways, the location is great for families and commuters alike. This property has the potential to truly be a diamond in one of Portsmouth’s most sought-after areas. Don’t miss the chance to bring your vision to life and unlock the value this home has to offer. Ask about the 3D virtual tour today!
Key facts
- Large backyard
- Solid brick exterior
- Nearby schools
Tags
Neighborhood map
What this means for you Summary
Snapshot
- This is a 3-bed/2.0-bath single-family listed at $270k.
Deal economics
- At list price, monthly cash flow is $-9 ($-110/yr) — negative.
- To cash-flow at today's rent, offer at most $268k (0.6% below list).
- To meet the 1% rule (rent ≥ 1% of price), the offer needs to be $233k (13.7% below list).
- Recommended offer: $233k (13.7% below list) — sets the bar for 1% rule.
- Cap rate 6.3% vs local median 4.6% in Portsmouth — top-decile yield for the area; either an underpriced asset or a hidden risk that comps aren't pricing in. Stress-test before assuming the spread holds.
Location & tenants
- Location reads 73/100 on livability (#172 in VA) — a middle-class / working-renter tenant base. Strengths: amenities A+, cost of living A+, housing A+; Watch: employment C-, crime F, commute F.
- Portsmouth City Public School District (urban): math 34% / reading 58% proficiency, ranked #107 of 131 in VA (top 82%) — families likely to look elsewhere, expect single-tenant / working-renter base with shorter leases.
- Zoned schools: Lakeview Elementary (math 22% / reading 47%, grade F, #966 of 1,108 statewide, top 89%, 419 students, 100% FRL); William E. Waters Middle (math 47% / reading 72%, grade B, #160 of 342 statewide, top 48%, 534 students, 99% FRL); I.C. Norcom High (math 39% / reading 58%, grade D, #301 of 319 statewide, top 95%, 1,043 students, 100% FRL) — zoned schools average 100% FRL vs 60% district-wide (40 pts higher); higher-poverty schools than district average — tighter screening recommended.
- Market conditions: Rents rising fast (+11.9%/yr); 170 active listings in the ZIP; 13 comparable units currently listed for rent nearby; rentals at typical pace (median 26d on market — plan ~3-4 weeks tenant-placement turnaround); 300 units permitted in Portsmouth city in 2024 (112 in 5+ unit buildings).
- This rent runs 45% of the median local income ($62k/yr) — at the standard rent-burdened threshold; future hikes will face affordability resistance.
Forward outlook
- Local home prices are declining (-3.0%/yr); year-one equity from $2k of loan paydown is wiped out by about $8k of value loss. Plan a longer hold.
Negotiation context
- It's been on market 48 days — a 3% lower offer ($262k) is reasonable based on typical stale-listing flexibility.
- 2 sale attempts with the ask held roughly flat each time — persistent listings suggest the price (not the market) is what's stuck; bring a comps-based counter.
Risks & watch-outs
- Climate carrying-cost: severe wind risk, 80% chance of damaging wind over 30y; extreme-heat days projected 7→15/yr by 2055 (HVAC capex compounding) — expect insurance premiums to compound above CPI over the hold.
Questions for the listing agent
- What do current leases actually rent for vs. the listed asking? Can we see a recent rent roll and the last 12 months of T-12 income?
- It's been on market 48 days. Have you received any prior offers? Is the seller open to a 14% concession, seller financing, or rate buy-down credit?
- Built in 1976 — when were the roof, HVAC, electrical panel, plumbing, and water heater last replaced?
- Is there a deadline driving the sale (1031 exchange, divorce, estate, relocation)? That informs how much negotiation room exists.
- Schools are B-rated — typically a magnet for longer-tenancy family renters. What's the average tenant stay here, and is there a school-zone premium baked into asking?
- Crime grade is F in this area — have there been break-ins, vandalism, or insurance claims at this property in the last 3 years? What carrier currently insures it and at what premium?
- This sits on a lake — are riparian / water-frontage rights deeded with the parcel? Any dock permits, shoreline easements, or HOA water-use restrictions?
- What's the documented flood / surge / shoreline-erosion history here (FEMA AND non-FEMA — e.g., storm surge, creek backup, septic-field saturation)?
- Any water-quality or seasonal algae-bloom issues that affect tenant satisfaction or short-term-rental demand?
- What's the average days-on-market for RENTAL listings here right now (not sales)? A rising rental-DOM trend means longer vacancies and softer asking-rent achievability than the comps imply.
- What's the recent tenant-quality profile in this submarket — average credit score on applications, eviction rate, late-payment / NSF rate, and stable-employment percentage? A property-management company in the area should have these aggregated.
- How much new for-sale + rental construction is in the pipeline within 1–3 miles? Heavy new supply typically softens prices + rents 12–24 months out; constrained supply supports both.
Investment metrics
- 1% rule
- 0.86% ✗
- Cap rate
- 6.25%
- Cash-on-cash
- -0.15%
- DSCR
- 0.99
- GRM
- 9.7
CMA / ARV
- ARV (on-the-fly)
- $491,584
- Comps found
- 12
Show comp detail 12 sales within ~0.75 mi
| Address | Dist | Beds/Ba | Sqft | Sold | Price | $/sf | Match |
|---|---|---|---|---|---|---|---|
| 1231 Darren Dr | 0.00mi | 3/2.0 | 1,979 (0%) | 1mo | $300,000 | $152 | 99 |
| 204 Wynn St | 0.17mi | 4/2.5 (+1) | 2,000 (+1%) | 2mo | $380,000 | $190 | 82 |
| 1618 Belafonte Dr | 0.36mi | 4/3.0 (+1) | 2,068 (+4%) | 1mo | $389,900 | $189 | 66 |
| 1136 Horne Ave | 0.11mi | 3/3.0 | 1,748 (-12%) | 7mo | $320,000 | $183 | 65 |
| 1419 Welcome Rd | 0.31mi | 3/2.0 | 1,760 (-11%) | 4mo | $346,150 | $197 | 64 |
| 1325 Warfield Dr | 0.48mi | 4/2.0 (+1) | 1,900 (-4%) | 5mo | $350,000 | $184 | 62 |
| 1103 Clay St | 0.49mi | 4/2.5 (+1) | 2,070 (+5%) | 8mo | $375,000 | $181 | 56 |
| 904 Darren Dr | 0.61mi | 3/2.0 | 1,809 (-9%) | 2mo | $325,000 | $180 | 55 |
| 1107 Clay St | 0.47mi | 4/2.5 (+1) | 2,065 (+4%) | 11mo | $342,750 | $166 | 55 |
| 2 Ross Ct | 0.39mi | 3/2.0 | 1,684 (-15%) | 4mo | $315,000 | $187 | 54 |
| 3 Ross Ct | 0.36mi | 3/2.0 | 1,692 (-14%) | 8mo | $274,900 | $162 | 53 |
| 902 Mineo Ln | 0.62mi | 4/2.5 (+1) | 1,700 (-14%) | 1mo | $325,000 | $191 | 40 |
Match score weights: distance 35% · size 25% · config 20% · recency 20%. Top-matched comps best support the ARV.
Projected returns pro-forma
-3.0% appreciation · 8.0% rent growth · sell at horizon
- IRR
- -11.1%
- Equity multiple
- 0.58×
- Total profit
- $-31,999
- Equity at exit
- $40,258
- IRR
- 4.1%
- Equity multiple
- 1.36×
- Total profit
- $27,530
- Equity at exit
- $23,345
Cash invested: $75,600 (down + closing). Projections, not guarantees.
Landlord ↔ Tenant lean methodology
- Overall (STATE)
- 55 Moderately Landlord-Leaning
- State Virginia
- 55 Moderately Landlord-Leaning · D+2
- County
- — inherits STATE
- City
- — inherits STATE
ZIP-level market 23701
- Rents YoY
- 11.9%
- Active inventory
- 170
- Price-to-rent
- 9.7×
Monthly cashflow live
- Estimated rent
- $2,330 high interval (Pro) →
- Mortgage (P&I)
- −$1,416
- Tax from tax record
- −$322 /mo · $3,859/yr
- Insurance
- −$112
- HOA
- −$0
- Vacancy / Maint / Mgmt
- −$489
- Net cashflow
- $-9
Break-even live
Sensitivity live
| Price | -10% $144 | -5% $67 | +0% $-9 | +5% $-86 | +10% $-162 |
|---|---|---|---|---|---|
| Rent | -10% $-193 | -5% $-101 | +0% $-9 | +5% $83 | +10% $175 |
| Rate | -1.0pp $127 | -0.5pp $59 | base $-9 | +0.5pp $-79 | +1.0pp $-150 |
UW: 25.0% down · 7.5% · 30yr · 1.5% tax · 5.0% vac · 8.0% maint · 8.0% mgmt
Financing live
Cash to close
- Down payment
- $67,500
- Closing costs
- $8,100
- Reserves months
- —
- Total cash needed
- —
Loan-product check · same deal, 3 products live
Conventional
25% down · 7.5% · 30yr
- Down + closing
- —
- Monthly P&I
- —
- Monthly cashflow
- —
- DSCR
- —
- Eligible?
- —
Personal DTI + credit; lowest rate.
DSCR
20% down · 8.5% · 30yr
- Down + closing
- —
- Monthly P&I
- —
- Monthly cashflow
- —
- DSCR
- —
- Eligible?
- —
No personal income docs; deal must DSCR.
Hard money
10% down · 12.0% · 12mo
- Down + closing
- —
- Monthly P&I
- —
- Monthly cashflow
- —
- DSCR
- —
- Eligible?
- —
Short-term bridge; refi at stabilization.
Rent comps 13 comps
| Address | Beds | Baths | Sqft | Rent | $/sqft | DOM | Units | Dist |
|---|---|---|---|---|---|---|---|---|
| 1217 Lakeview Dr Portsmouth, VA | 4.0 | 2.0 | 1425 | $2,550 | $1.79 | 9d | 1 | 0.41mi |
| 705 Warfield Dr Portsmouth, VA | 3.0 | 1.5 | 1269 | $2,100 | $1.65 | 19d | 1 | 0.84mi |
| 203 Median Cir Portsmouth, VA | 4.0 | 2.5 | 2200 | $2,195 | $1.00 | 25d | 1 | 0.84mi |
| 521 Weaver Cir Portsmouth, VA | 4.0 | 2.0 | 1890 | $2,125 | $1.12 | 45d | 1 | 0.89mi |
| 113 Bedford Pl Portsmouth, VA | 4.0 | 2.5 | 1939 | $2,400 | $1.24 | 45d | 1 | 0.95mi |
| 113 Bedford Pl Portsmouth, VA | 4.0 | 2.5 | 1939 | $2,400 | $1.24 | 19d | 1 | 0.95mi |
| 1203 Baskerville Ln Portsmouth, VA | 4.0 | 2.0 | 1550 | $2,300 | $1.48 | 14d | 1 | 1.21mi |
| 1203 Baskerville Ln Portsmouth, VA | 4.0 | 2.0 | 1550 | $900 | $0.58 | 25d | 1 | 1.21mi |
| 3711 Bay Cres Chesapeake, VA | 4.0 | 2.5 | 1915 | $2,300 | $1.20 | 18d | 1 | 1.24mi |
| 108 Marcy St Portsmouth, VA | 4.0 | 2.5 | 2100 | $2,500 | $1.19 | 45d | 1 | 1.27mi |
| 1507 Hodges Ferry Rd Portsmouth, VA | 3.0 | 1.5 | 1827 | $1,650 | $0.90 | 45d | 1 | 1.39mi |
| 528 Normandy St Portsmouth, VA | 3.0 | 2.5 | 2262 | $2,800 | $1.24 | 25d | 1 | 1.39mi |
| 207 Falcon Ave Portsmouth, VA | 3.0 | 2.5 | 1720 | $3,000 | $1.74 | 45d | 1 | 1.50mi |
Listing history 6 events
-
2026-04-28status Under Contract
-
2026-04-21historical Active Under Contract
-
2026-04-07status Active
-
2026-02-23status Under Contract
-
2026-02-12historical Active Under Contract
-
2026-01-26$270,000 Active
ⓘ Source: listings_history table (triggers on properties + properties_extension) + one-shot
backfill from property_details.listing_events for pre-trigger history.
Tax reassessment forecast VA · Resets to sale price
- Current annual tax
- $3,859 · $322/mo
- Projected year-2 tax
- $3,859 · $322/mo
- Expected delta
- $0/yr ($0/mo · 0.0%)
ⓘ Screening estimate from a state-policy table — verify with the county assessor before closing.
Climate risk First Street
- Flood 1/10 Low FEMA zone X (unshaded) · 0% chance over 30 yrs
- Wildfire 1/10 Low
- Heat 9/10 Extreme 7 d/yr ≥106°F today · 15 d/yr by 30 yrs out
- Wind 8/10 Severe 80% chance of damaging wind over 30 yrs
- Air quality 2/10 Low 2 unhealthy d/yr today · 2 by 30 yrs out
Nearby sold comps map
Loading sold comps map…
Walkable amenities ~0.75 mi
Loading nearby amenities…
Taxation est. · year 1
- Rental income
- $27,961
- − Mortgage interest
- −$15,124
- − Property taxes
- −$3,859
- − Insurance
- −$1,350
- − Repairs & maintenance
- −$2,237
- − Management
- −$2,237
- − Depreciation
- −$7,855
- Taxable loss
- −$4,700
- Est. tax savings @ 24.0%
- +$1,128
- After-tax cash flow
- $1,018/yr
For passive investors: Depreciation is non-cash, so a rental often shows a tax loss while cash-flowing — sheltering income. Rental losses are passive: they offset passive income freely, and up to $25,000/yr can offset ordinary (W-2) income if you actively participate and your MAGI is under $100k (phasing out to $0 by $150k); unused losses carry forward. On sale, claimed depreciation is recaptured at up to 25%, and gains may owe capital-gains tax (a 1031 exchange can defer both). Figures are a year-1 estimate at your 24.0% rate — not tax advice; consult a CPA.
Schools (NCES district)
- District
- Portsmouth City Public School District
- NCES district ID
- 5103000
- Math proficiency
- 34% ▼ -40.00%
- Reading proficiency
- 58% ▼ -12.00%
- Median HH income
- $46,152
- Composite
- 39.01/100
- National rank
- #4071
- State rank
- #107 of 131 in VA
Livability — Portsmouth
- Score
- 73/100
- State rank
- #172
- US rank
- #5381
Category grades
Schools grade is shown separately in the Schools card above.
Census & demographics
- Census place
- Portsmouth, VA
- County
- Portsmouth City · 96,366 people
- City population
- 96,366
- Metro
- Virginia Beach-Norfolk-Newport News, VA-NC
- Population (ZIP)
- 24,298
- Household income
- $62,349
- Rent vs Own
- Severe rent burden
- 580.0
Population outlook (Portsmouth County) Hauer SSP2
- Today (2025)
- 96,730 people
- By 2030
- 96,760 · +0.0%
- By 2040
- 96,573 · -0.2%
- By 2050
- 95,606 · -1.2%
- By 2075
- 93,579 · -3.3%
- By 2100
- 83,756 · -13.4%
Race, ethnicity, and origin ACS 2023
- Neighborhood character
- Diverse neighborhood (Simpson 0.58)
- Race & ethnicity
- Black 52% White 39% Two or more races 6% Hispanic / Latino 3%
- Common ancestry
- Italian 1% Romanian 1% Slovak 1%
- Foreign-born
- 2% · Canada
- Languages at home
- 96% English-only · Spanish 2%
Political lean MEDSL · Portsmouth
- 2024 margin
- Solid D (+38.6) · D 68.6% · R 30.0% · Other 1.4%
- 2008→2024 swing
- -0.7pp no change · 2008: 39.3pp · 2024: 38.6pp
- All cycles
- 2024: D+38.6 2020: D+40.8 2016: D+36.5 2012: D+39.6 2008: D+39.3
Not yet ingested
- Civics
- —
Market trends
- HPI YoY
- ▼ -218.96%
- Current HPI
- 310.8218
- Rent YoY
- ▲ 11.92%
- Metro
- Virginia Beach-Norfolk-Newport News, VA-NC
- State GDP YoY
- ▲ 2.40%
- F500 in state
- 50
Industry mix (Fortune 500 HQ in VA)
| Industry | F500 HQs | Revenue |
|---|---|---|
| Aerospace / Defense | 4 | $236B |
|
||
| Technology / Defense | 3 | $32B |
|
||
| Financial Services | 2 | $176B |
|
||
| Utilities | 2 | $27B |
|
||
| Insurance | 2 | $25B |
|
||
| Technology | 2 | $15B |
|
||
Price history
6 events — show timeline
- 2026-04-28 Pending — REINMLS
- 2026-04-21 Contingent — REINMLS
- 2026-04-07 Relisted — REINMLS
- 2026-02-23 Pending — REINMLS
- 2026-02-12 Contingent — REINMLS
- 2026-01-26 Listed $270,000 REINMLS
Property tax history
-9.4%/yrLatest (2025): $3,859 · +1.5% YoY. Source: county tax records.
Cash-flow waterfall
monthlySold comps — $/sqft
last 12 mo · ≤1 miLoading sold comps…