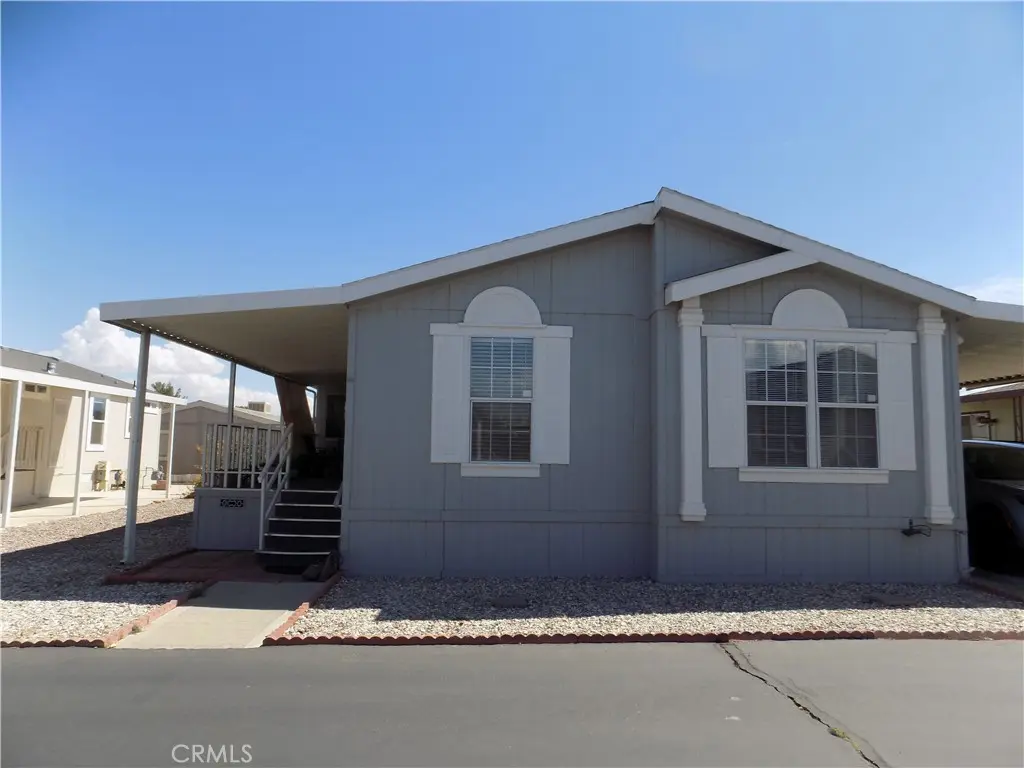
14000 El Evado Rd #62 · Victorville, CA
Flood risk 1/10 · Minimal
- FEMA flood zone
- X (unshaded)
- Chance of flooding over 30 yrs
- 0.0%
- Est. flood insurance / yr
- $507 – $1,088
Fire risk 5/10 · Moderate
- Est. fire insurance / yr
- $659 – $1,223
Heat risk 7/10 · Major
- Hot days now (above 99°F)
- 1 days/yr
- Hot days in 30 yrs
- 3 days/yr
Wind risk 1/10 · Minimal
- Chance of severe wind over 30 yrs
- —
Air-quality risk 9/10 · Severe
- Unhealthy air days now
- 22 days/yr
- Unhealthy air days in 30 yrs
- 28 days/yr
Risk factors via First Street. Map © Google.
Why this score? — see what drove the C+ grade
The composite is a weighted blend of 9 inputs, each scored 0–100. Each bar is that input's sub-score; the figure is the points it added to the 100-point composite (weight × sub-score).
- Cash flow +30.0/30.0
- 1% rule +10.0/10.0
- DSCR +10.0/10.0
- Rent growth +2.9/5.0
- Livability +2.7/5.0
- Condition / age +2.5/5.0
- Schools +2.2/10.0
- ARV discount +1.0/15.0
- Appreciation +0.0/10.0
$100,000
🖨 Deal sheet 📄 Offer letter ✓ Due diligence
Listing remarks MLS
This is Senior living at it's best! Located in a quiet 55+ community in Victorville near shopping & dining. The master room has a walk in closet and spacious bathroom. The kitchen cabinets were recently painted. Large storage shed. Covered parking. This property requires Park Approval. Please contact the park for more details on approval, requirements and other park information.
Key facts
- White cabinets
- Granite counter tops
- Skylight
Tags
Property features AI
Finance
- Other: Lot density approximately 0–1 unit per acre
- Financial info: Land lease of $925 monthly (park-provided)
- HOA & community: Senior community; Manager approval required; Breed restrictions for pets
Exterior
- Parking: Located in Seasons park (park name: Sasons)
- Utilities: Natural gas connected; Public/district water; Public sewer; Standard electric service; Cable connected; Electricity connected; Water connected; Sewer connected
- Home design: Mobile home remains on site; Double-wide mobile body type; Single-story; Entry on main level
- Construction: Year built per public records; Mobile home (23 ft wide by 12 ft long)
- Exterior features: Community pool; Suburban setting
Interior
- Kitchen: Kitchen open to family room; Remodeled kitchen; Granite counters
- Bedrooms: Bedrooms located on the ground floor; Walk-in closet
- Flooring: Vinyl flooring; Laminate flooring
- Bathrooms: 2 full bathrooms; Shower in tub; Separate shower; Bathroom closet
- Heating & cooling: Central furnace
- Interior features: All bedrooms on main level; Main entry; One-level home
- Laundry & utility: Inside laundry in a dedicated room; Washer included; Dryer included
Neighborhood map
What this means for you Summary
Snapshot
- This is a 3-bed/2.0-bath manufactured listed at $100k.
Deal economics
- At list price, monthly cash flow is $1k ($15k/yr) — positive.
- The deal already cash-flows at list — no discount required.
- Meets the 1% rule at list price ($2k rent vs $100k).
- Recommended offer: $97k (3.0% below list) — sets the bar for market timing.
- Cap rate 21.7% vs local median 4.2% in Victorville — top-decile yield for the area; either an underpriced asset or a hidden risk that comps aren't pricing in. Stress-test before assuming the spread holds.
Location & tenants
- Location reads 54/100 on livability (#906 in CA) — a working-class tenant base; expect higher turnover. Strengths: housing A+; Watch: employment D+, schools D-, crime F.
- Victor Elementary (urban): math 25% / reading 25% proficiency, ranked #408 of 517 in CA (top 79%) — low school quality limits family demand, transient renter base, plan for 1-2y turnover; 70% free/reduced lunch — lower-income household profile, screen leases tightly.
- Market conditions: Rents rising (+1.7%/yr); 369 active listings in the ZIP; 16 comparable units currently listed for rent nearby; rentals leasing fast (median 2d on market — plan ~1-2 weeks tenant-placement turnaround); solid renter incomes; 5,458 units permitted in San Bernardino County in 2024 (1,500 in 5+ unit buildings).
- This rent runs 33% of the median local income ($88k/yr) — at the standard rent-burdened threshold; future hikes will face affordability resistance.
Forward outlook
- Local home prices are declining (-3.0%/yr); year-one equity from $691 of loan paydown is wiped out by about $3k of value loss. Plan a longer hold.
- San Bernardino County population projected at +15% by 2050 — modest demand growth; plan on rents tracking national, not racing it.
- At projected returns (-3.0% appreciation + 1.7% rent growth), your $28k cash investment doubles in ~3 years — after that, you're playing with house money.
Negotiation context
- It's been on market 50 days — a 3% lower offer ($97k) is reasonable based on typical stale-listing flexibility.
- 3 sale attempts since 3y ago with the ask held roughly flat each time — persistent listings suggest the price (not the market) is what's stuck; bring a comps-based counter.
- Current owner paid $86k; 16% above their basis — modest negotiation headroom, anchor on the comps not their cost.
Risks & watch-outs
- Climate carrying-cost: moderate wildfire risk; extreme-heat days projected 1→3/yr by 2055 (HVAC capex compounding) — expect insurance premiums to compound above CPI over the hold.
Questions for the listing agent
- It's been on market 50 days. Have you received any prior offers? Is the seller open to a 3% concession, seller financing, or rate buy-down credit?
- Is there a deadline driving the sale (1031 exchange, divorce, estate, relocation)? That informs how much negotiation room exists.
- Schools are D-rated, which usually means shorter tenancies and higher turnover. Who's the typical renter profile here, and what's been the actual vacancy rate?
- Crime grade is F in this area — have there been break-ins, vandalism, or insurance claims at this property in the last 3 years? What carrier currently insures it and at what premium?
- What's the average days-on-market for RENTAL listings here right now (not sales)? A rising rental-DOM trend means longer vacancies and softer asking-rent achievability than the comps imply.
- What's the recent tenant-quality profile in this submarket — average credit score on applications, eviction rate, late-payment / NSF rate, and stable-employment percentage? A property-management company in the area should have these aggregated.
- How much new for-sale + rental construction is in the pipeline within 1–3 miles? Heavy new supply typically softens prices + rents 12–24 months out; constrained supply supports both.
Investment metrics
- 1% rule
- 2.40% ✓
- Cap rate
- 21.69%
- Cash-on-cash
- 55.00%
- DSCR
- 3.45
- GRM
- 3.5
CMA / ARV
- ARV (on-the-fly)
- $87,444
- Comps found
- 11
Show comp detail 11 sales within ~0.75 mi
| Address | Dist | Beds/Ba | Sqft | Sold | Price | $/sf | Match |
|---|---|---|---|---|---|---|---|
| 14000 El Evado Rd #70 | 0.00mi | 3/2.0 | 1,427 (+3%) | 13mo | $129,900 | $91 | 84 |
| 14000 El Evado Rd #65 | 0.00mi | 3/2.0 | 1,449 (+4%) | 10mo | $125,000 | $86 | 84 |
| 14000 El Evado Rd #100 | 0.00mi | 2/2.0 (-1) | 1,440 (+4%) | 10mo | $114,900 | $80 | 80 |
| 14000 El Evado Rd #12 | 0.00mi | 3/2.0 | 1,296 (-7%) | 12mo | $102,000 | $79 | 79 |
| 14000 El Evado Rd #19 | 0.00mi | 4/2.0 (+1) | 1,536 (+11%) | 5mo | $89,999 | $59 | 73 |
| 14000 El Evado Rd #30 | 0.00mi | 3/2.0 | 1,248 (-10%) | 23mo | $65,999 | $53 | 64 |
| 14000 El Evado Rd #87 | 0.00mi | 2/2.0 (-1) | 1,248 (-10%) | 20mo | $70,000 | $56 | 62 |
| 14000 El Evado Rd #44 | 0.00mi | 2/2.0 (-1) | 1,248 (-10%) | 20mo | $45,000 | $36 | 62 |
| 14000 El Evado Rd #17 | 0.00mi | 2/2.0 (-1) | 1,218 (-12%) | 22mo | $77,000 | $63 | 56 |
| 14411 Palmdale Rd #56 | 0.11mi | 2/2.0 (-1) | 1,248 (-10%) | 23mo | $47,000 | $38 | 54 |
| 14580 Gravilla | 0.66mi | 3/2.0 | 1,248 (-10%) | 7mo | $326,000 | $261 | 46 |
Match score weights: distance 35% · size 25% · config 20% · recency 20%. Top-matched comps best support the ARV.
Projected returns pro-forma
-3.0% appreciation · 1.69% rent growth · sell at horizon
- IRR
- 51.8%
- Equity multiple
- 3.23×
- Total profit
- $62,396
- Equity at exit
- $14,910
- IRR
- 56.6%
- Equity multiple
- 6.25×
- Total profit
- $147,055
- Equity at exit
- $8,646
Cash invested: $28,000 (down + closing). Projections, not guarantees.
Landlord ↔ Tenant lean methodology
- Overall (STATE)
- 18 Strongly Tenant-Friendly
- State California
- 18 Strongly Tenant-Friendly · D+13
- County
- — inherits STATE
- City
- — inherits STATE
ZIP-level market 92392
- Home prices YoY
- -9.0%
- Rents YoY
- 1.7%
- Active inventory
- 369
- Price-to-rent
- 3.5×
Monthly cashflow live
- Estimated rent
- $2,398 high interval (Pro) →
- Mortgage (P&I)
- −$524
- Tax from tax record
- −$45 /mo · $545/yr
- Insurance
- −$42
- HOA
- −$0
- Vacancy / Maint / Mgmt
- −$504
- Net cashflow
- $1,283
Break-even live
UW: 25.0% down · 7.5% · 30yr · 1.5% tax · 5.0% vac · 8.0% maint · 8.0% mgmt
Financing live
Cash to close
- Down payment
- $25,000
- Closing costs
- $3,000
- Reserves months
- —
- Total cash needed
- —
Loan-product check · same deal, 3 products live
Conventional
25% down · 7.5% · 30yr
- Down + closing
- —
- Monthly P&I
- —
- Monthly cashflow
- —
- DSCR
- —
- Eligible?
- —
Personal DTI + credit; lowest rate.
DSCR
20% down · 8.5% · 30yr
- Down + closing
- —
- Monthly P&I
- —
- Monthly cashflow
- —
- DSCR
- —
- Eligible?
- —
No personal income docs; deal must DSCR.
Hard money
10% down · 12.0% · 12mo
- Down + closing
- —
- Monthly P&I
- —
- Monthly cashflow
- —
- DSCR
- —
- Eligible?
- —
Short-term bridge; refi at stabilization.
Rent comps 16 comps
| Address | Beds | Baths | Sqft | Rent | $/sqft | DOM | Units | Dist |
|---|---|---|---|---|---|---|---|---|
| 14450 El Evado Rd Victorville, CA | 2.0–3.0 | 1.0–2.0 | 895 | $2,075 | $2.32 | 1d | 3 | 0.40mi |
| 14485 Seneca Rd Victorville, CA | 2.0–3.0 | 2.0 | 1123 | $2,545 | $2.27 | 1d | 6 | 0.62mi |
| 13730 San Martin Rd Unit B Victorville, CA | 2.0 | 1.0 | 1000 | $1,500 | $1.50 | 23d | 1 | 0.70mi |
| 14440 Stivers Rd Victorville, CA | 3.0 | 2.0 | 994 | $1,950 | $1.96 | 10d | 1 | 0.83mi |
| 14610 Green River Rd Victorville, CA | 3.0 | 2.5 | 1493 | $2,595 | $1.74 | 1d | 1 | 0.84mi |
| 14374 Borego Rd Victorville, CA | 1.0–2.0 | 1.0–2.0 | 842 | $2,080 | $2.47 | 1d | 12 | 0.95mi |
| 14344 Mcart Rd Victorville, CA | 2.0–3.0 | 2.0 | 1042 | $2,395 | $2.30 | 1d | 5 | 0.95mi |
| 13489 Monterey Way Victorville, CA | 3.0 | 2.0 | 927 | $2,195 | $2.37 | 1d | 1 | 1.12mi |
| 15230 Seneca Rd Victorville, CA | 1.0–3.0 | 1.0–2.0 | 805 | $2,005 | $2.49 | 1d | 12 | 1.15mi |
| 14861 Ann Dr Victorville, CA | 3.0 | 3.0 | 1657 | $2,395 | $1.45 | 1d | 1 | 1.18mi |
| 14304 Gray Fox Ln Victorville, CA | 3.0 | 2.5 | 1795 | $2,600 | $1.45 | 14d | 1 | 1.28mi |
| 14979 Buckskin Rd Victorville, CA | 3.0 | 2.0 | 1277 | $2,250 | $1.76 | 1d | 1 | 1.33mi |
| 13755 Hanford Ct Victorville, CA | 3.0 | 2.0 | 1867 | $2,397 | $1.28 | 1d | 1 | 1.35mi |
| 13629 Dry Creek Rd Victorville, CA | 3.0 | 2.0 | 1512 | $2,400 | $1.59 | 1d | 1 | 1.43mi |
| 15083 Brown Ln Victorville, CA | 4.0 | 2.0 | 1842 | $2,150 | $1.17 | 1d | 1 | 1.44mi |
| 15112 Brown Ln Victorville, CA | 3.0 | 2.0 | 1400 | $850 | $0.61 | 1d | 1 | 1.47mi |
Listing history 24 events
-
2026-06-18days on market $100,000 Active 50 DOM
-
2026-06-17days on market $100,000 Active 49 DOM
-
2026-06-16days on market $100,000 Active 48 DOM
-
2026-06-15days on market $100,000 Active 47 DOM
-
2026-06-13days on market $100,000 Active 45 DOM
-
2026-06-13pricedays on market $100,000 Active 44 DOM
-
2026-06-09days on market $103,000 Active 41 DOM
-
2026-06-08days on market $103,000 Active 40 DOM
-
2026-06-07remarks 693-char remark
-
2026-06-07days on market $103,000 Active 39 DOM
-
2026-06-04days on market $103,000 Active 36 DOM
-
2026-06-03days on market $103,000 Active 35 DOM
-
2026-06-02days on market $103,000 Active 34 DOM
-
2026-06-01days on market $103,000 Active 33 DOM
-
2026-05-31days on market $103,000 Active 32 DOM
-
2026-04-29$103,000 Active
-
2026-02-06historical
-
2025-12-17price $103,000
-
2025-10-10price $105,000
-
2025-09-17$110,000 Active
-
2023-04-12soldstatus $86,000 Closed Sale 387-char remark
Show marketing remark (387 chars)
This is Senior living at it's best! Located in a quiet 55+ community in Victorville near shopping & dining. The master room has a walk in closet and spacious bathroom. The kitchen cabinets were recently painted. Large storage shed. Covered parking. This property requires Park Approval. Please contact the park for more details on approval, requirements and other park information.
-
2023-03-22historical Active Under Contract 387-char remark
Show marketing remark (387 chars)
This is Senior living at it's best! Located in a quiet 55+ community in Victorville near shopping & dining. The master room has a walk in closet and spacious bathroom. The kitchen cabinets were recently painted. Large storage shed. Covered parking. This property requires Park Approval. Please contact the park for more details on approval, requirements and other park information.
-
2023-01-21$86,000 Active 387-char remark
Show marketing remark (387 chars)
This is Senior living at it's best! Located in a quiet 55+ community in Victorville near shopping & dining. The master room has a walk in closet and spacious bathroom. The kitchen cabinets were recently painted. Large storage shed. Covered parking. This property requires Park Approval. Please contact the park for more details on approval, requirements and other park information.
-
2023-01-21historical $86,000 387-char remark
Show marketing remark (387 chars)
This is Senior living at it's best! Located in a quiet 55+ community in Victorville near shopping & dining. The master room has a walk in closet and spacious bathroom. The kitchen cabinets were recently painted. Large storage shed. Covered parking. This property requires Park Approval. Please contact the park for more details on approval, requirements and other park information.
ⓘ Source: listings_history table (triggers on properties + properties_extension) + one-shot
backfill from property_details.listing_events for pre-trigger history.
Tax reassessment forecast CA · Resets to sale price
- Current annual tax
- $545 · $45/mo
- Projected year-2 tax
- $760 · $63/mo
- Expected delta
- +$215/yr (+$18/mo · 39.6%)
ⓘ Screening estimate from a state-policy table — verify with the county assessor before closing.
Climate risk First Street
- Flood 1/10 Low FEMA zone X (unshaded) · 0% chance over 30 yrs
- Wildfire 5/10 Major
- Heat 7/10 Severe 1 d/yr ≥99°F today · 3 d/yr by 30 yrs out
- Wind 1/10 Low
- Air quality 9/10 Extreme 22 unhealthy d/yr today · 28 by 30 yrs out
Nearby sold comps map
Loading sold comps map…
Walkable amenities ~0.75 mi
Loading nearby amenities…
Taxation est. · year 1
- Rental income
- $28,781
- − Mortgage interest
- −$5,602
- − Property taxes
- −$545
- − Insurance
- −$500
- − Repairs & maintenance
- −$2,302
- − Management
- −$2,302
- − Depreciation
- −$2,909
- Taxable income
- $14,621
- Est. tax owed @ 24.0%
- −$3,509
- After-tax cash flow
- $11,891/yr
For passive investors: Depreciation is non-cash, so a rental often shows a tax loss while cash-flowing — sheltering income. Rental losses are passive: they offset passive income freely, and up to $25,000/yr can offset ordinary (W-2) income if you actively participate and your MAGI is under $100k (phasing out to $0 by $150k); unused losses carry forward. On sale, claimed depreciation is recaptured at up to 25%, and gains may owe capital-gains tax (a 1031 exchange can defer both). Figures are a year-1 estimate at your 24.0% rate — not tax advice; consult a CPA.
Schools (NCES district)
- District
- Victor Elementary
- NCES district ID
- 0641040
- Math proficiency
- 25% ▬ 0.00%
- Reading proficiency
- 25% ▼ -9.00%
- Median HH income
- $44,949
- Composite
- 21.58/100
- National rank
- #8304
- State rank
- #408 of 517 in CA
Livability — Victorville
- Score
- 54/100
- State rank
- #906
- US rank
- #24038
Category grades
Schools grade is shown separately in the Schools card above.
Census & demographics
- Census place
- Victorville, CA
- County
- San Bernardino County · 2,030,291 people
- City population
- 154,418
- Metro
- Riverside-San Bernardino-Ontario, CA
- Population (ZIP)
- 65,429
- Household income
- $87,681
- Rent vs Own
- Severe rent burden
- 1879.0
Population outlook (San Bernardino County) Hauer SSP2
- Today (2025)
- 2,300,329 people
- By 2030
- 2,378,907 · +3.4%
- By 2040
- 2,523,137 · +9.7%
- By 2050
- 2,642,388 · +14.9%
- By 2075
- 2,880,769 · +25.2%
- By 2100
- 2,909,436 · +26.5%
Race, ethnicity, and origin ACS 2023
- Neighborhood character
- Diverse neighborhood (Simpson 0.62)
- Race & ethnicity
- Hispanic / Latino 55% Two or more races 24% White 22% Black 14% Asian 4% Native American 2%
- Hispanic origin (detail)
- Mexican 47%
- Common ancestry
- Portuguese 1% Romanian 1%
- Foreign-born
- 20% · Canada, China, Vietnam
- Languages at home
- 57% English-only · Spanish 38% Tagalog/Filipino 2% Other Indo-European 1%
Political lean MEDSL · San Bernardino
- 2024 margin
- Toss-up / Even · D 47.5% · R 49.7% · Other 2.8%
- 2008→2024 swing
- -8.5pp toward R · 2008: 6.3pp · 2024: -2.1pp
- All cycles
- 2024: R+2.1 2020: D+10.7 2016: D+9.8 2012: D+5.4 2008: D+6.3
Not yet ingested
- Civics
- —
Market trends
- HPI YoY
- ▼ -35.57%
- Current HPI
- 358.5152
- Rent YoY
- ▲ 1.69%
- Metro
- Riverside-San Bernardino-Ontario, CA
- State GDP YoY
- ▲ 3.21%
- F500 in state
- 116
Industry mix (Fortune 500 HQ in CA)
| Industry | F500 HQs | Revenue |
|---|---|---|
| Technology | 27 | $1,492B |
|
||
| Financial Services | 3 | $174B |
|
||
| Retail | 3 | $44B |
|
||
| Insurance | 3 | $26B |
|
||
| Media / Entertainment | 2 | $115B |
|
||
| Pharmaceuticals / Biotech | 2 | $62B |
|
||
Price history
+19.8% since first listed9 events — show timeline
- 2026-04-29 Listed $103,000 CRMLS
- 2026-02-06 Listing Removed — CRMLS
- 2025-12-17 Price Changed $103,000 CRMLS
- 2025-10-10 Price Changed $105,000 CRMLS
- 2025-09-17 Listed $110,000 CRMLS
- 2023-04-12 Sold (MLS) $86,000 CRMLS
- 2023-03-22 Contingent — CRMLS
- 2023-01-21 Listed $86,000 CRMLS
- 2023-01-21 Coming Soon $86,000 CRMLS
Property tax history
+2.9%/yrLatest (2025): $545 · +5.1% YoY. Source: county tax records.
Cash-flow waterfall
monthlySold comps — $/sqft
last 12 mo · ≤1 miLoading sold comps…