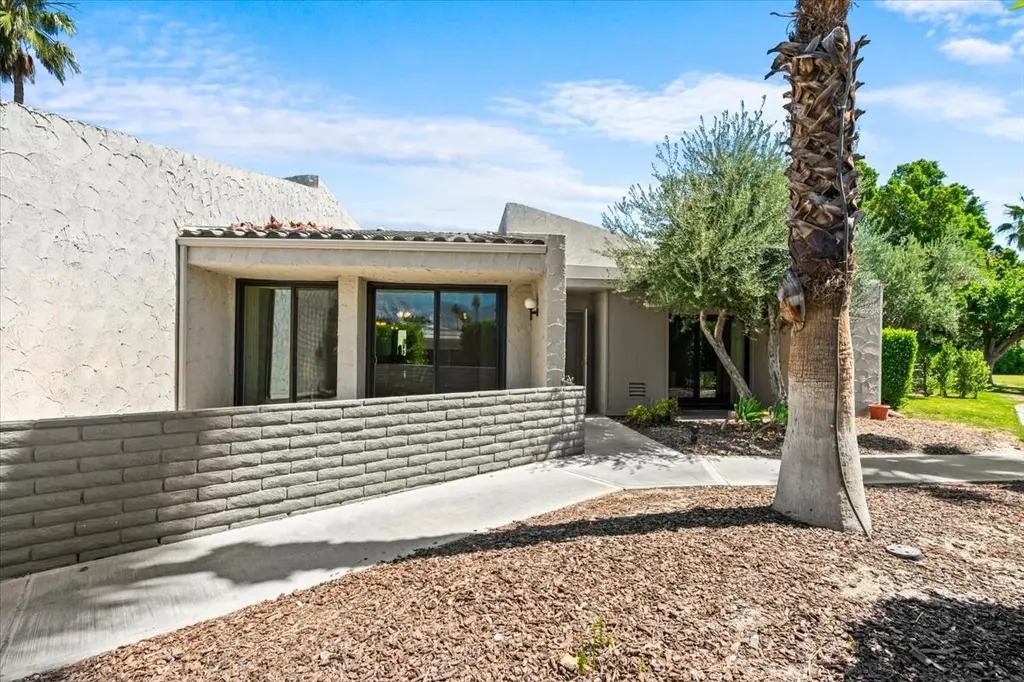
2620 N Whitewater Clb Unit D · Palm Springs, CA
Flood risk 1/10 · Minimal
- FEMA flood zone
- X
- Chance of flooding over 30 yrs
- 0.0%
- Est. flood insurance / yr
- $507 – $1,088
Fire risk 1/10 · Minimal
- Est. fire insurance / yr
- $659 – $1,223
Heat risk 9/10 · Severe
- Hot days now (above 112°F)
- 7 days/yr
- Hot days in 30 yrs
- 20 days/yr
Wind risk 1/10 · Minimal
- Chance of severe wind over 30 yrs
- —
Air-quality risk 5/10 · Moderate
- Unhealthy air days now
- 8 days/yr
- Unhealthy air days in 30 yrs
- 11 days/yr
Risk factors via First Street. Map © Google.
Why this score? — see what drove the C grade
The composite is a weighted blend of 9 inputs, each scored 0–100. Each bar is that input's sub-score; the figure is the points it added to the 100-point composite (weight × sub-score).
- Cash flow +20.1/30.0
- ARV discount +15.0/15.0
- 1% rule +7.4/10.0
- DSCR +6.4/10.0
- Livability +3.3/5.0
- Schools +2.7/10.0
- Rent growth +2.6/5.0
- Condition / age +2.5/5.0
- Appreciation +0.0/10.0
$310,000
🖨 Deal sheet 📄 Offer letter ✓ Due diligence
Listing remarks
Welcome to 2620 N Whitewater Club Drive, a beautifully maintained desert getaway located in the gated community of Palm Springs Country Club. Surrounded by manicured greenbelts and framed by incredible mountain views, this spacious 2-bedroom, 2-bath residence offers approximately 1,420 square feet of relaxed desert living just minutes from the heart of downtown. Step inside to an airy open-concept layout filled with natural light. The open kitchen showcases modern cabinetry and modern touches, flowing seamlessly into the generous living and dining spaces designed for both comfort and entertaining. Additional improvements include recently replaced modern dual-pane windows and sliding glass d
Key facts
- Gated community
- High-speed internet
- Move-in-ready condo
Tags
Property features AI
Finance
- Other: Property is fee simple; Pool and spa: community heated in-ground pool and heated in-ground spa (fenced, community)
- HOA & community: Monthly association fee (approximately $730); Association covers cable TV, water, trash, and security; Association amenities include controlled access, grounds maintenance, guest parking and greenbelt/park; Association pet rules apply; Gated community with community mailbox
Exterior
- Parking: 2 total parking spaces; Detached 2-space carport; Covered, unassigned guest parking available
- Security: Gated community with automatic gate and card/code access; Controlled access; Community security included in association
- Utilities: Water provided by Desert Water District; Sewer connected and paid; Cable TV available
- Home design: Condominium (attached); Bungalow style; Single-story (ground level, no unit above); Front door faces south
- Construction: Stucco exterior; Common roof; Slab foundation; Builder-reported year built
- Exterior features: Community-controlled access and gated community with automatic gate and card/code access; Community maintenance and management; Guest parking; Community greenbelt/park; Enclosed patio; Stucco wall fencing; Sprinkler system with timer; Private lot location; Greenbelt view; Mountain and park/greenbelt views
Interior
- Kitchen: Laminate counters; Skylight(s); Electric cooktop; Electric oven with warmer oven drawer; Microwave oven; Refrigerator; Dishwasher; Disposal
- Bedrooms: Master suite with walk-in closet
- Flooring: Tile
- Bathrooms: 2 full bathrooms; Double vanities; Shower stall and shower over tub options; Combination shower & tub
- Heating & cooling: Central forced air heating (electric); Central air conditioning; Ceiling fan(s)
- Interior features: Open floorplan; In-closet stack laundry; Storage; Ground-level entry with no steps; Vertical blinds
- Laundry & utility: Washer; Dryer; Stackable washer/dryer hookup (in closet)
Neighborhood map
What this means for you Summary
Snapshot
- This is a 2-bed/2.0-bath condo listed at $310k.
Deal economics
- At list price, monthly cash flow is $388 ($5k/yr) — positive.
- The deal already cash-flows at list — no discount required.
- Meets the 1% rule at list price ($4k rent vs $310k).
- Recommended offer: $301k (3.0% below list) — sets the bar for market timing.
- Cap rate 7.8% vs local median 2.7% in Palm Springs — top-decile yield for the area; either an underpriced asset or a hidden risk that comps aren't pricing in. Stress-test before assuming the spread holds.
Location & tenants
- Location reads 66/100 on livability (#348 in CA) — a middle-class / working-renter tenant base. Strengths: amenities A+, commute A+; Watch: schools C-, crime F, cost of living F.
- Palm Springs Unified (suburban): math 21% / reading 42% proficiency, ranked #328 of 517 in CA (top 63%) — families likely to look elsewhere, expect single-tenant / working-renter base with shorter leases; 73% free/reduced lunch — lower-income household profile, screen leases tightly.
- Market conditions: Rents flat; 647 active listings in the ZIP; 40 comparable units currently listed for rent nearby; rentals lingering (median 44d on market — plan ~5-8 weeks vacancy on turnover, expect pricing pressure); 65% of comp listings sitting > 30 days — soft ceiling on asking rent; 9,195 units permitted in Riverside County in 2024 (1,512 in 5+ unit buildings).
- At $3,830/mo this rent would consume 64% of the median local household income ($72k/yr) (locally 1866% of renters already pay >50% of income on rent) — very limited rent-growth headroom before tenants either downsize or default.
Forward outlook
- Local home prices are declining (-3.0%/yr); year-one equity from $2k of loan paydown is wiped out by about $9k of value loss. Plan a longer hold.
- Riverside County population projected at +22% by 2050 — long-run rental-demand tailwind backs the buy-and-hold thesis.
Negotiation context
- It's been on market 37 days — a 3% lower offer ($301k) is reasonable based on typical stale-listing flexibility.
- Current owner paid $97k; list at $310k implies a 220% gain — meaningful room to come down on a strong offer.
Risks & watch-outs
- Climate carrying-cost: extreme-heat days projected 7→20/yr by 2055 (HVAC capex compounding) — expect insurance premiums to compound above CPI over the hold.
Questions for the listing agent
- It's been on market 37 days. Have you received any prior offers? Is the seller open to a 3% concession, seller financing, or rate buy-down credit?
- Built in 1978 — when were the roof, HVAC, electrical panel, plumbing, and water heater last replaced?
- What does the HOA fee cover, when was the last increase, and are there any pending special assessments or reserve-fund shortfalls?
- Any open or pending special assessments — roof, HVAC, plumbing, elevator, façade? What's the per-unit balance and payoff schedule, and is the seller paying it off at close or rolling it to the buyer?
- Is there a deadline driving the sale (1031 exchange, divorce, estate, relocation)? That informs how much negotiation room exists.
- Crime grade is F in this area — have there been break-ins, vandalism, or insurance claims at this property in the last 3 years? What carrier currently insures it and at what premium?
- What's the average days-on-market for RENTAL listings here right now (not sales)? A rising rental-DOM trend means longer vacancies and softer asking-rent achievability than the comps imply.
- What's the recent tenant-quality profile in this submarket — average credit score on applications, eviction rate, late-payment / NSF rate, and stable-employment percentage? A property-management company in the area should have these aggregated.
- How much new apartment / multifamily construction is in the pipeline within 1–3 miles? Heavy new supply (>2% of stock underway) typically softens rents 12–24 months out; light construction supports rent growth.
Investment metrics
- 1% rule
- 1.24% ✓
- Cap rate
- 7.79%
- Cash-on-cash
- 5.36%
- DSCR
- 1.24
- GRM
- 6.7
CMA / ARV
- ARV (median comp)
- $373,715
- List price
- $310,000
- Delta
- -17.05%
- Verdict
- UNDERPRICED
- Comps
- 20 within 1.0 mi
Projected returns pro-forma
-3.0% appreciation · 0.46% rent growth · sell at horizon
- IRR
- -11.4%
- Equity multiple
- 0.60×
- Total profit
- $-34,711
- Equity at exit
- $46,222
- IRR
- -7.2%
- Equity multiple
- 0.61×
- Total profit
- $-34,170
- Equity at exit
- $26,803
Cash invested: $86,800 (down + closing). Projections, not guarantees.
Landlord ↔ Tenant lean methodology
- Overall (STATE)
- 18 Strongly Tenant-Friendly
- State California
- 18 Strongly Tenant-Friendly · D+13
- County
- — inherits STATE
- City
- — inherits STATE
ZIP-level market 92262
- Rents YoY
- 0.5%
- Active inventory
- 647
- Price-to-rent
- 6.7×
Monthly cashflow live
- Estimated rent
- $3,830 high interval (Pro) →
- Mortgage (P&I)
- −$1,626
- Tax from tax record
- −$153 /mo · $1,833/yr
- Insurance
- −$129
- HOA
- −$730
- Vacancy / Maint / Mgmt
- −$804
- Net cashflow
- $388
Break-even live
UW: 25.0% down · 7.5% · 30yr · 1.5% tax · 5.0% vac · 8.0% maint · 8.0% mgmt
Financing live
Cash to close
- Down payment
- $77,500
- Closing costs
- $9,300
- Reserves months
- —
- Total cash needed
- —
Loan-product check · same deal, 3 products live
Conventional
25% down · 7.5% · 30yr
- Down + closing
- —
- Monthly P&I
- —
- Monthly cashflow
- —
- DSCR
- —
- Eligible?
- —
Personal DTI + credit; lowest rate.
DSCR
20% down · 8.5% · 30yr
- Down + closing
- —
- Monthly P&I
- —
- Monthly cashflow
- —
- DSCR
- —
- Eligible?
- —
No personal income docs; deal must DSCR.
Hard money
10% down · 12.0% · 12mo
- Down + closing
- —
- Monthly P&I
- —
- Monthly cashflow
- —
- DSCR
- —
- Eligible?
- —
Short-term bridge; refi at stabilization.
Rent comps 40 comps
| Address | Beds | Baths | Sqft | Rent | $/sqft | DOM | Units | Dist |
|---|---|---|---|---|---|---|---|---|
| 2522 N Whitewater Club Dr Unit C Palm Springs, CA | 2.0 | 2.0 | 1101 | $4,320 | $3.92 | 43d | 1 | 0.16mi |
| 2660 N Farrell Dr Palm Springs, CA | 3.0 | 2.0 | 1696 | $4,900 | $2.89 | 43d | 1 | 0.17mi |
| 2750 E Vincentia Rd Palm Springs, CA | 3.0 | 2.0 | 1826 | $4,400 | $2.41 | 24d | 1 | 0.24mi |
| 2455 E Rogers Rd Palm Springs, CA | 3.0 | 2.0 | 1403 | $3,900 | $2.78 | 24d | 1 | 0.24mi |
| 3010 E Verona Rd Palm Springs, CA | 3.0 | 2.0 | 1700 | $4,500 | $2.65 | 43d | 1 | 0.24mi |
| 3033 E Verona Rd Palm Springs, CA | 3.0 | 2.0 | 1652 | $2,999 | $1.82 | 24d | 1 | 0.28mi |
| 2415 E Finley Rd Palm Springs, CA | 3.0 | 2.0 | 1600 | $3,560 | $2.23 | 43d | 1 | 0.29mi |
| 2342 N San Gorgonio Rd Palm Springs, CA | 3.0 | 3.0 | 1700 | $4,275 | $2.51 | 43d | 1 | 0.33mi |
| 2184 E Powell Rd Palm Springs, CA | 3.0 | 2.0 | 1391 | $3,500 | $2.52 | 15d | 1 | 0.33mi |
| 2184 E Powell Rd Palm Springs, CA | 3.0 | 2.0 | 1391 | $3,500 | $2.52 | 43d | 1 | 0.33mi |
| 2375 N San Antonio Rd Palm Springs, CA | 3.0 | 2.0 | 1382 | $3,600 | $2.60 | 24d | 1 | 0.34mi |
| 2290 N Victoria Rd Palm Springs, CA | 3.0 | 3.0 | 1752 | $5,270 | $3.01 | 43d | 1 | 0.40mi |
| 2240 N San Gorgonio Rd Palm Springs, CA | 3.0 | 2.0 | 1260 | $3,600 | $2.86 | 24d | 1 | 0.40mi |
| 2601 N Cerritos Rd Palm Springs, CA | 3.0 | 2.0 | 1224 | $3,095 | $2.53 | 16d | 1 | 0.42mi |
| 2525 N Cerritos Rd Palm Springs, CA | 3.0 | 2.0 | 1345 | $7,495 | $5.57 | 15d | 1 | 0.43mi |
| 2525 N Cerritos Rd Palm Springs, CA | 3.0 | 2.0 | 1345 | $7,495 | $5.57 | 43d | 1 | 0.43mi |
| 2200 Acacia Rd E Palm Springs, CA | 3.0 | 2.0 | 1597 | $5,800 | $3.63 | 43d | 1 | 0.43mi |
| 2200 Acacia Rd E Palm Springs, CA | 3.0 | 2.0 | 1597 | $5,800 | $3.63 | 20d | 1 | 0.43mi |
| 2235 N Los Alamos Rd Palm Springs, CA | 3.0 | 2.0 | 1399 | $5,000 | $3.57 | 43d | 1 | 0.46mi |
| 2223 N Magnolia Rd Palm Springs, CA | 3.0 | 2.0 | 1472 | $3,600 | $2.45 | 24d | 1 | 0.46mi |
| 2600 N Chuperosa Rd Palm Springs, CA | 3.0 | 2.0 | 1447 | $3,875 | $2.68 | 43d | 1 | 0.48mi |
| 3005 N Chuperosa Rd Palm Springs, CA | 3.0 | 2.0 | 1134 | $3,500 | $3.09 | 43d | 1 | 0.54mi |
| 2990 N Bahada Rd Palm Springs, CA | 3.0 | 2.0 | 1550 | $6,000 | $3.87 | 43d | 1 | 0.54mi |
| 2295 Nicola Rd E Palm Springs, CA | 3.0 | 2.0 | 1338 | $3,990 | $2.98 | 43d | 1 | 0.56mi |
| 2630 N Biskra Rd Palm Springs, CA | 3.0 | 2.0 | 1450 | $2,900 | $2.00 | 4d | 1 | 0.57mi |
| 3663 E Paseo Barbara Palm Springs, CA | 3.0 | 2.0 | 1708 | $3,499 | $2.05 | 43d | 1 | 0.95mi |
| 3370 E Avenida Fey Norte Palm Springs, CA | 3.0 | 2.0 | 1518 | $5,500 | $3.62 | 43d | 1 | 0.95mi |
| 1181 Sunflower Ln Palm Springs, CA | 2.0 | 2.0 | 1068 | $3,000 | $2.81 | 43d | 1 | 0.98mi |
| 1331 E Luna Way Palm Springs, CA | 3.0 | 2.0 | 1512 | $4,900 | $3.24 | 43d | 1 | 0.98mi |
| 2564 N Aurora Dr Palm Springs, CA | 3.0 | 2.0 | 1354 | $3,500 | $2.58 | 43d | 1 | 1.01mi |
| 1751 E Sandalwood Dr Palm Springs, CA | 2.0 | 2.0 | 1050 | $2,600 | $2.48 | 24d | 1 | 1.11mi |
| 1411 N Sunrise Way Palm Springs, CA | 2.0 | 2.0 | 1067 | $1,899 | $1.78 | 43d | 1 | 1.15mi |
| 1407 N Sunrise Way #29 Palm Springs, CA | 2.0 | 2.0 | 1100 | $2,750 | $2.50 | 43d | 1 | 1.17mi |
| 1407 N Sunrise Way Palm Springs, CA | 1.0–2.0 | 1.0–2.0 | 935 | $2,750 | $2.94 | 7d | 2 | 1.17mi |
| 1123 E El Cid Palm Springs, CA | 3.0 | 2.0 | 1722 | $4,775 | $2.77 | 43d | 1 | 1.19mi |
| 1405 N Sunrise Way #2 Palm Springs, CA | 2.0 | 2.0 | 1170 | $2,200 | $1.88 | 43d | 1 | 1.20mi |
| 915 E Racquet Club Rd Palm Springs, CA | 3.0 | 2.0 | 1225 | $7,480 | $6.11 | 15d | 1 | 1.20mi |
| 915 E Racquet Club Rd Palm Springs, CA | 3.0 | 2.0 | 1225 | $7,480 | $6.11 | 43d | 1 | 1.20mi |
| 1020 N Cerritos Dr Palm Springs, CA | 3.0 | 2.0 | 1516 | $13,950 | $9.20 | 43d | 1 | 1.29mi |
| 688 E Spencer Dr Palm Springs, CA | 3.0 | 2.0 | 1225 | $7,560 | $6.17 | 43d | 1 | 1.33mi |
HOA detail condo
- Monthly dues
- $730 · $8,760/yr
- Likely covers
- watersecurity
- Assessments
- None detected in remarks — confirm with the listing agent.
Listing history 17 events
-
2026-06-18days on market $310,000 Active 37 DOM
-
2026-06-17days on market $310,000 Active 36 DOM
-
2026-06-16days on market $310,000 Active 35 DOM
-
2026-06-15days on market $310,000 Active 34 DOM
-
2026-06-13days on market $310,000 Active 32 DOM
-
2026-06-13days on market $310,000 Active 31 DOM
-
2026-06-09days on market $310,000 Active 28 DOM
-
2026-06-08pricedays on market $310,000 Active 27 DOM
-
2026-06-07days on market $325,000 Active 26 DOM
-
2026-06-04days on market $325,000 Active 23 DOM
-
2026-06-03days on market $325,000 Active 22 DOM
-
2026-06-02days on market $325,000 Active 21 DOM
-
2026-06-01days on market $325,000 Active 20 DOM
-
2026-05-31days on market $325,000 Active 19 DOM
-
2026-04-22$325,000 Active 1475-char remark
-
2001-11-14soldstatus $97,000
-
1995-10-19soldstatus $75,000
ⓘ Source: listings_history table (triggers on properties + properties_extension) + one-shot
backfill from property_details.listing_events for pre-trigger history.
Tax reassessment forecast CA · Resets to sale price
- Current annual tax
- $1,833 · $153/mo
- Projected year-2 tax
- $2,356 · $196/mo
- Expected delta
- +$523/yr (+$44/mo · 28.5%)
ⓘ Screening estimate from a state-policy table — verify with the county assessor before closing.
Climate risk First Street
- Flood 1/10 Low FEMA zone X · 0% chance over 30 yrs
- Wildfire 1/10 Low
- Heat 9/10 Extreme 7 d/yr ≥112°F today · 20 d/yr by 30 yrs out
- Wind 1/10 Low
- Air quality 5/10 Major 8 unhealthy d/yr today · 11 by 30 yrs out
Nearby sold comps map
Loading sold comps map…
Walkable amenities ~0.75 mi
Loading nearby amenities…
Taxation est. · year 1
- Rental income
- $45,957
- − Mortgage interest
- −$17,365
- − Property taxes
- −$1,833
- − Insurance
- −$1,550
- − Repairs & maintenance
- −$3,677
- − Management
- −$3,677
- − HOA
- −$8,760
- − Depreciation
- −$9,018
- Taxable income
- $78
- Est. tax owed @ 24.0%
- −$19
- After-tax cash flow
- $4,636/yr
For passive investors: Depreciation is non-cash, so a rental often shows a tax loss while cash-flowing — sheltering income. Rental losses are passive: they offset passive income freely, and up to $25,000/yr can offset ordinary (W-2) income if you actively participate and your MAGI is under $100k (phasing out to $0 by $150k); unused losses carry forward. On sale, claimed depreciation is recaptured at up to 25%, and gains may owe capital-gains tax (a 1031 exchange can defer both). Figures are a year-1 estimate at your 24.0% rate — not tax advice; consult a CPA.
Schools (NCES district)
- District
- Palm Springs Unified
- NCES district ID
- 0629550
- Math proficiency
- 21% ▼ -7.00%
- Reading proficiency
- 42% ▬ 0.00%
- Median HH income
- $43,638
- Composite
- 26.76/100
- National rank
- #7131
- State rank
- #328 of 517 in CA
Livability — Palm Springs
- Score
- 66/100
- State rank
- #348
- US rank
- #11850
Category grades
Schools grade is shown separately in the Schools card above.
Census & demographics
- Census place
- Palm Springs, CA
- County
- Riverside County · 2,287,001 people
- City population
- 46,786
- Metro
- Riverside-San Bernardino-Ontario, CA
- Population (ZIP)
- 26,887
- Household income
- $71,672
- Rent vs Own
- Severe rent burden
- 1866.0
Population outlook (Riverside County) Hauer SSP2
- Today (2025)
- 2,664,475 people
- By 2030
- 2,802,692 · +5.2%
- By 2040
- 3,050,904 · +14.5%
- By 2050
- 3,256,783 · +22.2%
- By 2075
- 3,655,058 · +37.2%
- By 2100
- 3,766,594 · +41.4%
Race, ethnicity, and origin ACS 2023
- Neighborhood character
- Diverse neighborhood (Simpson 0.58)
- Race & ethnicity
- White 58% Hispanic / Latino 27% Two or more races 13% Black 9% Asian 3%
- Hispanic origin (detail)
- Mexican 24%
- Common ancestry
- Lithuanian 3% Slovak 3% Italian 2%
- Foreign-born
- 17% · Canada, China
- Languages at home
- 75% English-only · Spanish 19% French/Haitian/Cajun 1% German/W. Germanic 1%
Political lean MEDSL · Riverside
- 2024 margin
- Toss-up / Even · D 48.0% · R 49.3% · Other 2.6%
- 2008→2024 swing
- -3.6pp toward R · 2008: 2.3pp · 2024: -1.3pp
- All cycles
- 2024: R+1.3 2020: D+8.0 2016: D+4.3 2012: R+0.4 2008: D+2.3
Not yet ingested
- Civics
- —
Market trends
- HPI YoY
- ▼ -1082.67%
- Current HPI
- 434.0524
- Rent YoY
- ▲ 0.46%
- Metro
- Riverside-San Bernardino-Ontario, CA
- State GDP YoY
- ▲ 3.21%
- F500 in state
- 116
Industry mix (Fortune 500 HQ in CA)
| Industry | F500 HQs | Revenue |
|---|---|---|
| Technology | 27 | $1,492B |
|
||
| Financial Services | 3 | $174B |
|
||
| Retail | 3 | $44B |
|
||
| Insurance | 3 | $26B |
|
||
| Media / Entertainment | 2 | $115B |
|
||
| Pharmaceuticals / Biotech | 2 | $62B |
|
||
Price history
+313.3% since first listed4 events — show timeline
- 2026-06-08 Price Changed $310,000 GPSMLS
- 2026-04-22 Listed $325,000 GPSMLS
- 2001-11-14 Sold (Public Records) $97,000 Public Records
- 1995-10-19 Sold (Public Records) $75,000 Public Records
Property tax history
+1.9%/yrLatest (2025): $1,833 · -2.2% YoY. Source: county tax records.
Cash-flow waterfall
monthlySold comps — $/sqft
last 12 mo · ≤1 miLoading sold comps…