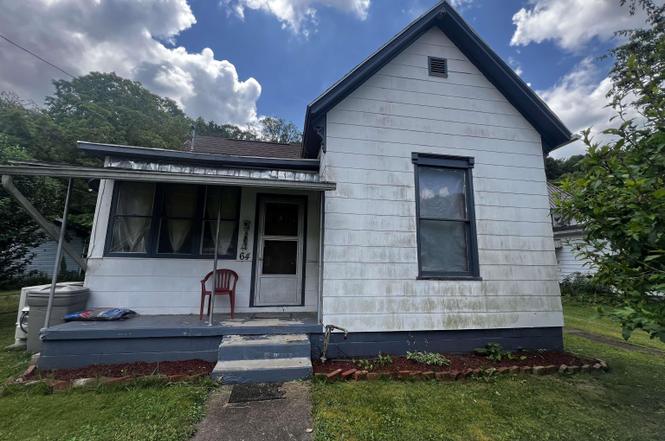
64 Carolina Ave · Salem, WV
Flood risk 9/10 · Severe
- FEMA flood zone
- X (unshaded)
- Chance of flooding over 30 yrs
- 0.99%
- Est. flood insurance / yr
- $507 – $1,088
Fire risk 4/10 · Minor
- Est. fire insurance / yr
- $787 – $1,461
Heat risk 4/10 · Minor
- Hot days now (above 97°F)
- 7 days/yr
- Hot days in 30 yrs
- 19 days/yr
Wind risk 1/10 · Minimal
- Chance of severe wind over 30 yrs
- 1.0%
Air-quality risk 2/10 · Minimal
- Unhealthy air days now
- 0 days/yr
- Unhealthy air days in 30 yrs
- 1 days/yr
Risk factors via First Street. Map © Google.
Why this score? — see what drove the B- grade
The composite is a weighted blend of 9 inputs, each scored 0–100. Each bar is that input's sub-score; the figure is the points it added to the 100-point composite (weight × sub-score).
- Cash flow +30.0/30.0
- 1% rule +10.0/10.0
- DSCR +10.0/10.0
- Appreciation +6.9/10.0
- Livability +3.3/5.0
- Schools +3.0/10.0
- Rent growth +2.5/5.0
- Condition / age +2.5/5.0
- ARV discount +0.3/15.0
$60,999
🖨 Deal sheet 📄 Offer letter ✓ Due diligence
Listing remarks
Private well. City sewer. Newer roof. Walls need to be finished in dining room. Large storage shed and cellar both on their own lots. 2 large bedrooms. Close proximity to Rails to Trails and tennis courts.
Key facts
- Private well
- Newer roof
- City sewer
Tags
Property features AI
Finance
- HOA & community: Tennis court(s) in the community
Exterior
- Parking: On-street parking
- Security: Smoke detector(s)
- Utilities: Well (private) water source; Public sewer; Cable available
- Home design: Single-family detached residence; One story
- Construction: Block and wood siding construction; Shingle roof
- Exterior features: Porch; Level lot
Interior
- Kitchen: Dishwasher; Range; Refrigerator
- Bedrooms: Total of 6 rooms (bedroom count not specified)
- Flooring: Vinyl
- Bathrooms: 1 full bathroom
- Heating & cooling: Baseboard heating; Wood heating; Ceiling fan(s)
- Interior features: Dishwasher; Dryer; Refrigerator; Range; Washer; Vinyl flooring; Ceiling fan(s); Baseboard heating; Wood heating; Smoke detector(s)
- Laundry & utility: Washer; Dryer
Neighborhood map
What this means for you Summary
Snapshot
- This is a 3-bed/1.0-bath single-family listed at $61k.
Deal economics
- At list price, monthly cash flow is $379 ($5k/yr) — positive.
- The deal already cash-flows at list — no discount required.
- Meets the 1% rule at list price ($1k rent vs $61k).
- Recommended offer: $54k (12.0% below list) — sets the bar for market timing.
Location & tenants
- Location reads 66/100 on livability (#106 in WV) — a middle-class / working-renter tenant base. Strengths: crime A+, cost of living A+, housing A+; Watch: health & safety C-, amenities F, commute F.
- Harrison County Schools (town): math 29% / reading 43% proficiency, ranked #12 of 55 in WV (top 22%) — families likely to look elsewhere, expect single-tenant / working-renter base with shorter leases.
- Zoned schools: Salem Elementary (math 52% / reading 47%, grade D, #49 of 377 statewide, top 16%, 189 students, 0% FRL); Robert C Byrd High School (math 22% / reading 52%, grade F, #32 of 110 statewide, top 34%, 765 students, 0% FRL) — zoned schools average 0% FRL vs 43% district-wide (43 pts lower); this property's tenant base skews higher-income than the district average.
- Market conditions: 13 active listings in the ZIP; 84 units permitted in Harrison County in 2024 (5 in 5+ unit buildings).
Forward outlook
- In year one you build about $3k of equity ($421 loan paydown + $2k appreciation (3.8% local appreciation)).
- Harrison County population projected at -11% by 2050 — secular population decline; favor cash flow + early exit over multi-decade hold.
- At projected returns (3.8% appreciation + 3.0% rent growth), your $17k cash investment doubles in ~3 years — after that, you're playing with house money.
Negotiation context
- It's been on market 350 days — a 12% lower offer ($54k) is reasonable based on typical stale-listing flexibility.
- 2 sale attempts; this cycle's ask has dropped $5k (8%) from the opening price — seller is motivated, your offer sets the floor, not the list.
Risks & watch-outs
- Watch-outs: flood insurance adds $66/mo; built in 1900 — expect roof / HVAC / electrical / plumbing capex.
- Climate carrying-cost: severe flood risk — expect insurance premiums to compound above CPI over the hold.
Questions for the listing agent
- It's been on market 350 days. Have you received any prior offers? Is the seller open to a 12% concession, seller financing, or rate buy-down credit?
- Built in 1900 — when were the roof, HVAC, electrical panel, plumbing, and water heater last replaced?
- What's the actual annual flood-insurance premium (NFIP or private), and is the property in a SFHA with mandatory coverage?
- Why hasn't it sold? Are there any deal-killer items the seller is aware of (foundation, flood, title, zoning, code violations)?
- Is there a deadline driving the sale (1031 exchange, divorce, estate, relocation)? That informs how much negotiation room exists.
- Schools are F-rated, which usually means shorter tenancies and higher turnover. Who's the typical renter profile here, and what's been the actual vacancy rate?
- What's the average days-on-market for RENTAL listings here right now (not sales)? A rising rental-DOM trend means longer vacancies and softer asking-rent achievability than the comps imply.
- What's the recent tenant-quality profile in this submarket — average credit score on applications, eviction rate, late-payment / NSF rate, and stable-employment percentage? A property-management company in the area should have these aggregated.
- How much new for-sale + rental construction is in the pipeline within 1–3 miles? Heavy new supply typically softens prices + rents 12–24 months out; constrained supply supports both.
Investment metrics
- 1% rule
- 1.80% ✓
- Cap rate
- 15.05%
- Cash-on-cash
- 31.29%
- DSCR
- 2.39
- GRM
- 4.6
CMA / ARV
- ARV (on-the-fly)
- $52,572
- Comps found
- 5
Show comp detail 5 sales within ~0.75 mi
| Address | Dist | Beds/Ba | Sqft | Sold | Price | $/sf | Match |
|---|---|---|---|---|---|---|---|
| 73 Walnut St | 0.19mi | 3/1.0 | 1,199 (-11%) | 7mo | $35,000 | $29 | 66 |
| 6 Summit St | 0.46mi | 2/2.0 (-1) | 1,369 (+2%) | 13mo | $130,000 | $95 | 56 |
| 121 Valley St | 0.61mi | 3/1.0 | 1,543 (+14%) | 2mo | $60,000 | $39 | 46 |
| 71 Oak St | 0.20mi | 3/1.5 | 1,147 (-15%) | 21mo | $45,000 | $39 | 46 |
| 124 Valley St | 0.59mi | 3/2.0 | 1,525 (+13%) | 24mo | $192,000 | $126 | 27 |
Match score weights: distance 35% · size 25% · config 20% · recency 20%. Top-matched comps best support the ARV.
Projected returns pro-forma
3.8% appreciation · 3.0% rent growth · sell at horizon
- IRR
- 34.1%
- Equity multiple
- 3.00×
- Total profit
- $34,154
- Equity at exit
- $30,210
- IRR
- 33.6%
- Equity multiple
- 5.96×
- Total profit
- $84,725
- Equity at exit
- $48,846
Cash invested: $17,080 (down + closing). Projections, not guarantees.
Landlord ↔ Tenant lean methodology
- Overall (STATE)
- 83 Strongly Landlord-Friendly
- State West Virginia
- 83 Strongly Landlord-Friendly · R+22
- County
- — inherits STATE
- City
- — inherits STATE
ZIP-level market 26426
- Home prices YoY
- 2.2%
- Active inventory
- 13
- Price-to-rent
- 4.6×
Monthly cashflow live
- Estimated rent
- $1,097 medium interval (Pro) →
- Mortgage (P&I)
- −$320
- Tax est. 1.5%
- −$76 /mo · $915/yr
- Insurance
- −$25
- Flood insurance flood zone
- −$66 /mo · $798/yr
- HOA
- −$0
- Vacancy / Maint / Mgmt
- −$230
- Net cashflow
- $379
Break-even live
UW: 25.0% down · 7.5% · 30yr · 1.5% tax · 5.0% vac · 8.0% maint · 8.0% mgmt
Financing live
Cash to close
- Down payment
- $15,250
- Closing costs
- $1,830
- Reserves months
- —
- Total cash needed
- —
Loan-product check · same deal, 3 products live
Conventional
25% down · 7.5% · 30yr
- Down + closing
- —
- Monthly P&I
- —
- Monthly cashflow
- —
- DSCR
- —
- Eligible?
- —
Personal DTI + credit; lowest rate.
DSCR
20% down · 8.5% · 30yr
- Down + closing
- —
- Monthly P&I
- —
- Monthly cashflow
- —
- DSCR
- —
- Eligible?
- —
No personal income docs; deal must DSCR.
Hard money
10% down · 12.0% · 12mo
- Down + closing
- —
- Monthly P&I
- —
- Monthly cashflow
- —
- DSCR
- —
- Eligible?
- —
Short-term bridge; refi at stabilization.
Listing history 20 events
-
2026-06-19days on market $60,999 Active 350 DOM
-
2026-06-18days on market $60,999 Active 349 DOM
-
2026-06-17days on market $60,999 Active 348 DOM
-
2026-06-16days on market $60,999 Active 347 DOM
-
2026-06-15days on market $60,999 Active 346 DOM
-
2026-06-14days on market $60,999 Active 344 DOM
-
2026-06-12days on market $60,999 Active 343 DOM
-
2026-06-09days on market $60,999 Active 340 DOM
-
2026-06-08days on market $60,999 Active 339 DOM
-
2026-06-07days on market $60,999 Active 338 DOM
-
2026-06-05days on market $60,999 Active 335 DOM
-
2026-06-03days on market $60,999 Active 334 DOM
-
2026-06-02days on market $60,999 Active 333 DOM
-
2026-06-01days on market $60,999 Active 332 DOM
-
2026-05-31days on market $60,999 Active 331 DOM
-
2026-05-30days on market $60,999 Active 330 DOM
-
2026-04-08status Active
-
2026-03-24historical Active Under Contract
-
2025-12-30price $60,999
-
2025-07-05$66,000 Active
ⓘ Source: listings_history table (triggers on properties + properties_extension) + one-shot
backfill from property_details.listing_events for pre-trigger history.
Climate risk First Street
- Flood 9/10 Extreme FEMA zone X (unshaded) · 99% chance over 30 yrs
- Wildfire 4/10 Moderate
- Heat 4/10 Moderate 7 d/yr ≥97°F today · 19 d/yr by 30 yrs out
- Wind 1/10 Low 100% chance of damaging wind over 30 yrs
- Air quality 2/10 Low 0 unhealthy d/yr today · 1 by 30 yrs out
Nearby sold comps map
Loading sold comps map…
Walkable amenities ~0.75 mi
Loading nearby amenities…
Taxation est. · year 1
- Rental income
- $13,169
- − Mortgage interest
- −$3,417
- − Property taxes
- −$915
- − Insurance
- −$1,102
- − Repairs & maintenance
- −$1,053
- − Management
- −$1,053
- − Depreciation
- −$1,775
- Taxable income
- $3,853
- Est. tax owed @ 24.0%
- −$925
- After-tax cash flow
- $3,622/yr
For passive investors: Depreciation is non-cash, so a rental often shows a tax loss while cash-flowing — sheltering income. Rental losses are passive: they offset passive income freely, and up to $25,000/yr can offset ordinary (W-2) income if you actively participate and your MAGI is under $100k (phasing out to $0 by $150k); unused losses carry forward. On sale, claimed depreciation is recaptured at up to 25%, and gains may owe capital-gains tax (a 1031 exchange can defer both). Figures are a year-1 estimate at your 24.0% rate — not tax advice; consult a CPA.
Schools (NCES district)
- District
- Harrison County Schools
- NCES district ID
- 5400510
- Math proficiency
- 29% ▼ -10.00%
- Reading proficiency
- 43% ▼ -3.00%
- Median HH income
- $43,269
- Composite
- 30.48/100
- National rank
- #6222
- State rank
- #12 of 55 in WV
Livability — Salem
- Score
- 66/100
- State rank
- #106
- US rank
- #11585
Category grades
Schools grade is shown separately in the Schools card above.
Census & demographics
- Census place
- Salem, WV
- City population
- 7,302
- Population (ZIP)
- 7,302
Population outlook (Harrison County) Hauer SSP2
- Today (2025)
- 67,273 people
- By 2030
- 65,963 · -1.9%
- By 2040
- 63,033 · -6.3%
- By 2050
- 59,999 · -10.8%
- By 2075
- 52,524 · -21.9%
- By 2100
- 42,654 · -36.6%
Race, ethnicity, and origin ACS 2023
- Neighborhood character
- Predominantly White (95%)
- Race & ethnicity
- White 95% Hispanic / Latino 1% Two or more races 1%
- Common ancestry
- Serbian 3% Romanian 2% Iranian 2%
- Foreign-born
- 1% · Canada
- Languages at home
- 99% English-only · Other Indo-European 1%
Political lean MEDSL · Harrison
- 2024 margin
- Solid R (+41.0) · D 28.5% · R 69.4% · Other 2.1%
- 2008→2024 swing
- -27.6pp toward R · 2008: -13.3pp · 2024: -41.0pp
- All cycles
- 2024: R+41.0 2020: R+37.6 2016: R+39.5 2012: R+23.5 2008: R+13.3
Not yet ingested
- Civics
- —
Market trends
- HPI YoY
- ▲ 3.80%
- Current HPI
- 174.3458
- Rent YoY
- —
- Metro
- —
- State GDP YoY
- —
- F500 in state
- 0
Price history
-7.6% since first listed4 events — show timeline
- 2026-04-08 Relisted — NCWVREIN
- 2026-03-24 Contingent — NCWVREIN
- 2025-12-30 Price Changed $60,999 NCWVREIN
- 2025-07-05 Listed $66,000 NCWVREIN
Property tax history
-13.8%/yrLatest (2025): $72 · -78.4% YoY. Source: county tax records.
Cash-flow waterfall
monthlySold comps — $/sqft
last 12 mo · ≤1 miLoading sold comps…