309 Sauvignon Pt · San Marcos, TX
Flood risk 1/10 · Minimal
- FEMA flood zone
- X (unshaded)
- Chance of flooding over 30 yrs
- 0.0%
- Est. flood insurance / yr
- $507 – $1,088
Fire risk 3/10 · Minor
- Est. fire insurance / yr
- $1,222 – $2,270
Heat risk 8/10 · Major
- Hot days now (above 108°F)
- 7 days/yr
- Hot days in 30 yrs
- 23 days/yr
Wind risk 8/10 · Major
- Chance of severe wind over 30 yrs
- 80.0%
Air-quality risk 2/10 · Minimal
- Unhealthy air days now
- 0 days/yr
- Unhealthy air days in 30 yrs
- 1 days/yr
Risk factors via First Street. Map © Google.
Why this score? — see what drove the D grade
The composite is a weighted blend of 9 inputs, each scored 0–100. Each bar is that input's sub-score; the figure is the points it added to the 100-point composite (weight × sub-score).
- Cash flow +13.5/30.0
- ARV discount +8.1/15.0
- DSCR +4.1/10.0
- 1% rule +4.0/10.0
- Livability +4.0/5.0
- Condition / age +4.0/5.0
- Rent growth +2.0/5.0
- Schools +2.0/10.0
- Appreciation +0.0/10.0
$228,999
🖨 Deal sheet (PDF) 📄 Offer letter ✓ Due diligence
Listing remarks
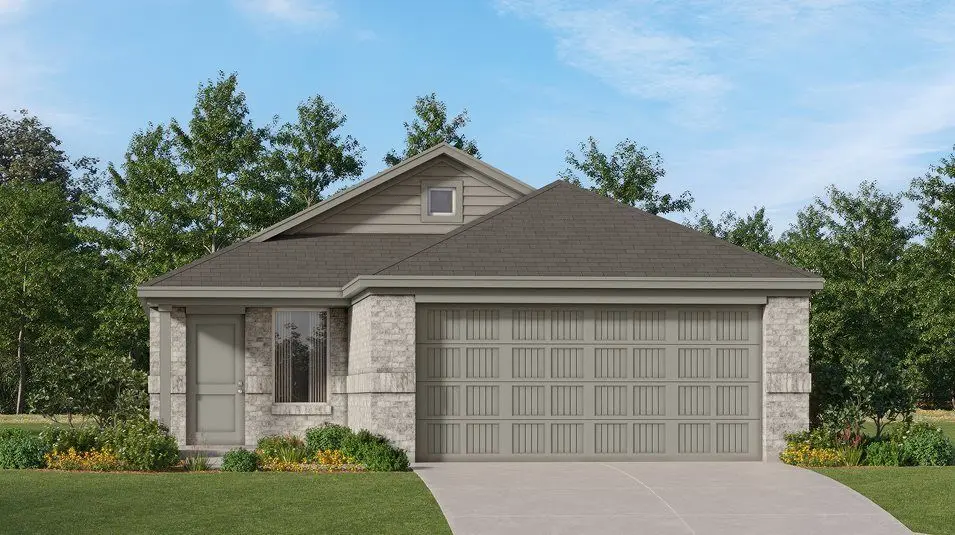
The Pinehollow - This single-level home showcases a spacious open floorplan shared between the kitchen, dining area and family room for easy entertaining. An owner's suite enjoys a private location in a rear corner of the home, complemented by an en-suite bathroom and walk-in closet. There are three secondary bedrooms along the side of the home, which are comfortable spaces for household members and overnight guests. Estimated Completion September 2026. The completion date, prices and features may vary and are subject to change. Please verify with Lennar directly. Photos are for illustrative purposes only.
Key facts
- Walk-in closet
- Open floorplan
- Secondary bedrooms
Tags
Property features AI
Finance
- Other: Address: 309 Sauvignon Point, New Braunfels, TX 78130; Listing status: Active; Last modified: 2026-05-22
- Financial info: List price $250,999
Exterior
- Parking: 2 total parking spaces; 2-car garage
- Home design: Single-family home (spec new construction)
- Exterior features: Living area of 1600 (listed)
Interior
- Bedrooms: 4 bedrooms
- Bathrooms: 2 full bathrooms
- Interior features: Spec new construction (Pinehollow plan)
Neighborhood map
What this means for you Summary
Snapshot
- This is a 4-bed/2.0-bath single-family listed at $229k. Condition is rated good.
Deal economics
- At list price, monthly cash flow is $8 ($93/yr) — positive.
- The deal already cash-flows at list — no discount required.
- To meet the 1% rule (rent ≥ 1% of price), the offer needs to be $206k (9.8% below list).
- Recommended offer: $206k (9.8% below list) — sets the bar for 1% rule.
- Cap rate 6.3% vs local median 3.2% in San Marcos — top-decile yield for the area; either an underpriced asset or a hidden risk that comps aren't pricing in. Stress-test before assuming the spread holds.
Location & tenants
- Location reads 81/100 on livability (#30 in TX, #1,601 nationally) — a professional / high-income tenant draw. Strengths: amenities A+, cost of living A+, health & safety A+; Watch: crime D+, employment F.
- San Marcos CISD (rural): math 18% / reading 31% proficiency, ranked #731 of 826 in TX (top 88%) — low school quality limits family demand, transient renter base, plan for 1-2y turnover; 63% free/reduced lunch — lower-income household profile, screen leases tightly.
- Zoned schools: Bowie El (math 17% / reading 28%, grade F, #3,311 of 4,322 statewide, top 77%, 479 students, 74% FRL); Goodnight Middle (math 9% / reading 24%, grade F, #1,536 of 1,662 statewide, top 93%, 866 students, 85% FRL); San Marcos H S (math 26% / reading 31%, grade F, #1,157 of 1,632 statewide, top 72%, 2,536 students, 76% FRL) — zoned schools average 79% FRL vs 63% district-wide (15 pts higher); higher-poverty schools than district average — tighter screening recommended.
- Market conditions: Rents soft (-2.0%/yr); 1931 active listings in the ZIP; 6 comparable units currently listed for rent nearby; rentals leasing fast (median 4d on market — plan ~1-2 weeks tenant-placement turnaround); solid renter incomes; 5,270 units permitted in Hays County in 2024 (1,464 in 5+ unit buildings).
Forward outlook
- Local home prices are declining (-3.0%/yr); year-one equity from $2k of loan paydown is wiped out by about $7k of value loss. Plan a longer hold.
- Hays County population projected at +93% by 2050 — long-run rental-demand tailwind backs the buy-and-hold thesis.
Negotiation context
- It's been on market 19 days — a 2% lower offer ($226k) is reasonable based on typical stale-listing flexibility.
Risks & watch-outs
- Climate carrying-cost: severe wind risk, 80% chance of damaging wind over 30y; extreme-heat days projected 7→23/yr by 2055 (HVAC capex compounding) — expect insurance premiums to compound above CPI over the hold.
Questions for the listing agent
- What does the HOA fee cover, when was the last increase, and are there any pending special assessments or reserve-fund shortfalls?
- Is there a deadline driving the sale (1031 exchange, divorce, estate, relocation)? That informs how much negotiation room exists.
- Schools are F-rated, which usually means shorter tenancies and higher turnover. Who's the typical renter profile here, and what's been the actual vacancy rate?
- Crime grade is D in this area — have there been break-ins, vandalism, or insurance claims at this property in the last 3 years? What carrier currently insures it and at what premium?
- The area grade is low — what's the realistic commute time and amenity access for the typical tenant pool here? Any planned neighborhood developments (good or bad) we should know about?
- What's the average days-on-market for RENTAL listings here right now (not sales)? A rising rental-DOM trend means longer vacancies and softer asking-rent achievability than the comps imply.
- What's the recent tenant-quality profile in this submarket — average credit score on applications, eviction rate, late-payment / NSF rate, and stable-employment percentage? A property-management company in the area should have these aggregated.
- How much new for-sale + rental construction is in the pipeline within 1–3 miles? Heavy new supply typically softens prices + rents 12–24 months out; constrained supply supports both.
Investment metrics
- 1% rule
- 0.90% ✗
- Cap rate
- 6.33%
- Cash-on-cash
- 0.14%
- DSCR
- 1.01
- GRM
- 9.2
CMA / ARV
- ARV (on-the-fly)
- $232,000
- Comps found
- 12
Show comp detail 12 sales within ~0.75 mi
| Address | Dist | Beds/Ba | Sqft | Sold | Price | $/sf | Match |
|---|---|---|---|---|---|---|---|
| 255 Zyra Ave | 0.00mi | 4/2.0 | 1,600 (0%) | 1mo | $229,999 | $144 | 99 |
| 215 Zyra Ave | 0.00mi | 4/2.0 | 1,600 (0%) | 1mo | $227,999 | $142 | 99 |
| 271 Zyra Ave | 0.00mi | 4/2.0 | 1,600 (0%) | 1mo | $230,999 | $144 | 99 |
| 235 Zyra Ave | 0.00mi | 4/2.0 | 1,575 (-2%) | 1mo | $227,999 | $145 | 97 |
| 414 Sauvignon Pt | 0.00mi | 4/2.0 | 1,575 (-2%) | 1mo | $228,999 | $145 | 97 |
| 3103 Dispatch Dr | 0.00mi | 4/2.0 | 1,667 (+4%) | 1mo | $236,999 | $142 | 92 |
| 3144 Dispatch Dr | 0.00mi | 4/2.0 | 1,667 (+4%) | 1mo | $250,999 | $151 | 92 |
| 3140 Dispatch Dr | 0.00mi | 3/2.0 (-1) | 1,474 (-8%) | 0mo | $212,999 | $145 | 82 |
| 3188 Dispatch Dr | 0.00mi | 3/2.0 (-1) | 1,474 (-8%) | 1mo | $211,999 | $144 | 81 |
| 3164 Dispatch Dr | 0.00mi | 3/2.0 (-1) | 1,474 (-8%) | 1mo | $216,999 | $147 | 81 |
| 239 Zyra Ave | 0.00mi | 3/2.0 (-1) | 1,402 (-12%) | 0mo | $218,999 | $156 | 74 |
| 251 Zyra Ave | 0.00mi | 3/2.0 (-1) | 1,402 (-12%) | 1mo | $217,999 | $155 | 74 |
Match score weights: distance 35% · size 25% · config 20% · recency 20%. Top-matched comps best support the ARV.
Projected returns pro-forma
-3.0% appreciation · 0.0% rent growth · sell at horizon
- IRR
- -19.6%
- Equity multiple
- 0.34×
- Total profit
- $-42,610
- Equity at exit
- $34,144
- IRR
- -20.7%
- Equity multiple
- 0.07×
- Total profit
- $-59,628
- Equity at exit
- $19,800
Cash invested: $64,120 (down + closing). Projections, not guarantees.
Landlord ↔ Tenant lean methodology
- Overall (STATE)
- 87 Strongly Landlord-Friendly
- State Texas
- 87 Strongly Landlord-Friendly · R+5
- County
- — inherits STATE
- City
- — inherits STATE
ZIP-level market 78130
- Rents YoY
- -2.0%
- Active inventory
- 1931
- Price-to-rent
- 9.2×
Monthly cashflow live
- Estimated rent
- $2,065 high interval (Pro) →
- Mortgage (P&I)
- −$1,201
- Tax est. 1.5%
- −$286 /mo · $3,435/yr
- Insurance
- −$95
- HOA
- −$41
- Vacancy / Maint / Mgmt
- −$434
- Net cashflow
- $8
Break-even live
Sensitivity live
| Price | -10% $166 | -5% $87 | +0% $8 | +5% $-71 | +10% $-151 |
|---|---|---|---|---|---|
| Rent | -10% $-155 | -5% $-74 | +0% $8 | +5% $89 | +10% $171 |
| Rate | -1.0pp $123 | -0.5pp $66 | base $8 | +0.5pp $-52 | +1.0pp $-112 |
UW: 25.0% down · 7.5% · 30yr · 1.5% tax · 5.0% vac · 8.0% maint · 8.0% mgmt
Financing live
Cash to close
- Down payment
- $57,250
- Closing costs
- $6,870
- Reserves months
- —
- Total cash needed
- —
Loan-product check · same deal, 3 products live
Conventional
25% down · 7.5% · 30yr
- Down + closing
- —
- Monthly P&I
- —
- Monthly cashflow
- —
- DSCR
- —
- Eligible?
- —
Personal DTI + credit; lowest rate.
DSCR
20% down · 8.5% · 30yr
- Down + closing
- —
- Monthly P&I
- —
- Monthly cashflow
- —
- DSCR
- —
- Eligible?
- —
No personal income docs; deal must DSCR.
Hard money
10% down · 12.0% · 12mo
- Down + closing
- —
- Monthly P&I
- —
- Monthly cashflow
- —
- DSCR
- —
- Eligible?
- —
Short-term bridge; refi at stabilization.
Rent comps 6 comps
| Address | Beds | Baths | Sqft | Rent | $/sqft | DOM | Units | Dist |
|---|---|---|---|---|---|---|---|---|
| 259 Ottawa WAY New Braunfels, TX | 4.0 | 2.5 | 2173 | $2,150 | $0.99 | 0d | 1 | 0.04mi |
| 3188 Dispatch DR New Braunfels, TX | 3.0 | 2.0 | 1474 | $1,700 | $1.15 | 4d | 1 | 0.04mi |
| 3175 Dispatch DR New Braunfels, TX | 4.0 | 2.0 | 1850 | $2,250 | $1.22 | 0d | 1 | 0.04mi |
| 2452 Creek Rd Canyon Lake, TX | 4.0 | 2.5 | 1952 | $1,600 | $0.82 | 9d | 1 | 0.04mi |
| 3135 Dispatch DR New Braunfels, TX | 3.0 | 2.0 | 1474 | $1,690 | $1.15 | 25d | 1 | 0.04mi |
| 3179 Dispatch DR New Braunfels, TX | 4.0 | 2.0 | 1850 | $2,250 | $1.22 | 0d | 1 | 0.04mi |
HOA detail
- Monthly dues
- $41 · $492/yr
Listing history 14 events
-
2026-06-21days on market $228,999 Active 19 DOM
-
2026-06-18days on market $228,999 Active 16 DOM
-
2026-06-17days on market $228,999 Active 15 DOM
-
2026-06-16days on market $228,999 Active 14 DOM
-
2026-06-15days on market $228,999 Active 13 DOM
-
2026-06-13statusdays on market $228,999 Active 11 DOM
-
2026-06-09days on market $228,999 Price Change 7 DOM
-
2026-06-08days on market $228,999 Price Change 6 DOM
-
2026-06-07days on market $228,999 Price Change 5 DOM
-
2026-06-05days on market $228,999 Price Change 2 DOM
-
2026-06-02remarks 613-char remark
-
2026-06-02pricestatusdays on market $228,999 Price Change 1 DOM
-
2026-06-01days on market $230,999 Active 10 DOM
-
2026-05-31pricedays on market $230,999 Active 9 DOM
ⓘ Source: listings_history table (triggers on properties + properties_extension) + one-shot
backfill from property_details.listing_events for pre-trigger history.
Climate risk First Street
- Flood 1/10 Low FEMA zone X (unshaded) · 0% chance over 30 yrs
- Wildfire 3/10 Moderate
- Heat 8/10 Severe 7 d/yr ≥108°F today · 23 d/yr by 30 yrs out
- Wind 8/10 Severe 80% chance of damaging wind over 30 yrs
- Air quality 2/10 Low 0 unhealthy d/yr today · 1 by 30 yrs out
Nearby sold comps map
Loading sold comps map…
Walkable amenities ~0.75 mi
Loading nearby amenities…
Taxation est. · year 1
- Rental income
- $24,779
- − Mortgage interest
- −$12,828
- − Property taxes
- −$3,435
- − Insurance
- −$1,145
- − Repairs & maintenance
- −$1,982
- − Management
- −$1,982
- − HOA
- −$492
- − Depreciation
- −$6,662
- Taxable loss
- −$3,747
- Est. tax savings @ 24.0%
- +$899
- After-tax cash flow
- $992/yr
For passive investors: Depreciation is non-cash, so a rental often shows a tax loss while cash-flowing — sheltering income. Rental losses are passive: they offset passive income freely, and up to $25,000/yr can offset ordinary (W-2) income if you actively participate and your MAGI is under $100k (phasing out to $0 by $150k); unused losses carry forward. On sale, claimed depreciation is recaptured at up to 25%, and gains may owe capital-gains tax (a 1031 exchange can defer both). Figures are a year-1 estimate at your 24.0% rate — not tax advice; consult a CPA.
Condition & rehab AI · 19 photos
This single-level home features a spacious open floorplan with modern finishes and a good condition. It is ready for immediate occupancy and minor cosmetic updates could further enhance its value.
Value-add opportunities
- Resale Paint exterior siding — Enhances curb appeal
- Rental Replace window seals — Improves energy efficiency and reduces maintenance costs
Renovation cost estimate screening
Value-add ROI direction
- Resale Paint exterior siding — Enhances curb appeal ↑
- Rental Replace window seals — Improves energy efficiency and reduces maintenance costs ↑
ⓘ Cost ranges are severity-bucket heuristics (US national rule-of-thumb). Get contractor quotes + a written scope before underwriting a rehab budget.
Schools (NCES district)
- District
- San Marcos CISD
- NCES district ID
- 4838970
- Math proficiency
- 18% ▼ -16.00%
- Reading proficiency
- 31% ▼ -8.00%
- Median HH income
- $34,538
- Composite
- 20.11/100
- National rank
- #8644
- State rank
- #731 of 826 in TX
Livability — San Marcos
- Score
- 81/100
- State rank
- #30
- US rank
- #1601
Category grades
Schools grade is shown separately in the Schools card above.
Census & demographics
- County
- Comal County · 206,262 people
- City population
- 144,962
- Metro
- San Antonio-New Braunfels, TX
- Population (ZIP)
- 104,009
- Household income
- $83,064
- Rent vs Own
- Severe rent burden
- 2912.0
Population outlook (Hays County) Hauer SSP2
- Today (2025)
- 286,948 people
- By 2030
- 336,923 · +17.4%
- By 2040
- 441,894 · +54.0%
- By 2050
- 553,462 · +92.9%
- By 2075
- 838,261 · +192.1%
- By 2100
- 1,063,658 · +270.7%
Race, ethnicity, and origin ACS 2023
- Neighborhood character
- Majority White (58%)
- Race & ethnicity
- White 58% Hispanic / Latino 37% Two or more races 19% Black 2%
- Hispanic origin (detail)
- Mexican 32%
- Common ancestry
- Romanian 2% Lithuanian 2% Slovak 2%
- Foreign-born
- 7% · Canada
- Languages at home
- 78% English-only · Spanish 20% German/W. Germanic 1%
Political lean MEDSL · Hays
- 2024 margin
- Lean D (+5.7) · D 52.1% · R 46.5% · Other 1.4%
- 2008→2024 swing
- +7.7pp toward D · 2008: -2.0pp · 2024: 5.7pp
- All cycles
- 2024: D+5.7 2020: D+10.8 2016: R+0.9 2012: R+10.4 2008: R+2.0
Not yet ingested
- Civics
- —
Market trends
- HPI YoY
- ▼ -190.61%
- Current HPI
- 173.7128
- Rent YoY
- ▼ -1.97%
- Metro
- San Antonio-New Braunfels, TX
- State GDP YoY
- ▲ 3.95%
- F500 in state
- 110
Industry mix (Fortune 500 HQ in TX)
| Industry | F500 HQs | Revenue |
|---|---|---|
| Energy | 16 | $1,198B |
|
||
| Technology | 5 | $198B |
|
||
| Engineering / Construction | 4 | $72B |
|
||
| Energy Services | 3 | $60B |
|
||
| Utilities | 3 | $41B |
|
||
| Healthcare | 2 | $330B |
|
||
Cash-flow waterfall
monthlySold comps — $/sqft
last 12 mo · ≤1 miLoading sold comps…