205 3rd Ave Unit 17L · New York, NY
Flood risk 1/10 · Minimal
- FEMA flood zone
- X (unshaded)
- Chance of flooding over 30 yrs
- 0.0%
- Est. flood insurance / yr
- $507 – $1,088
Fire risk 1/10 · Minimal
- Est. fire insurance / yr
- $691 – $1,283
Heat risk 6/10 · Moderate
- Hot days now (above 99°F)
- 7 days/yr
- Hot days in 30 yrs
- 15 days/yr
Wind risk 6/10 · Moderate
- Chance of severe wind over 30 yrs
- 27.0%
Air-quality risk 4/10 · Minor
- Unhealthy air days now
- 5 days/yr
- Unhealthy air days in 30 yrs
- 7 days/yr
Risk factors via First Street. Map © Google.
Why this score? — see what drove the B- grade
The composite is a weighted blend of 9 inputs, each scored 0–100. Each bar is that input's sub-score; the figure is the points it added to the 100-point composite (weight × sub-score).
- Cash flow +19.1/30.0
- Appreciation +9.7/10.0
- 1% rule +7.7/10.0
- ARV discount +7.5/15.0
- DSCR +6.0/10.0
- Schools +5.0/10.0
- Rent growth +4.8/5.0
- Livability +3.8/5.0
- Condition / age +2.5/5.0
$599,000
🖨 Deal sheet (PDF) 📄 Offer letter ✓ Due diligence
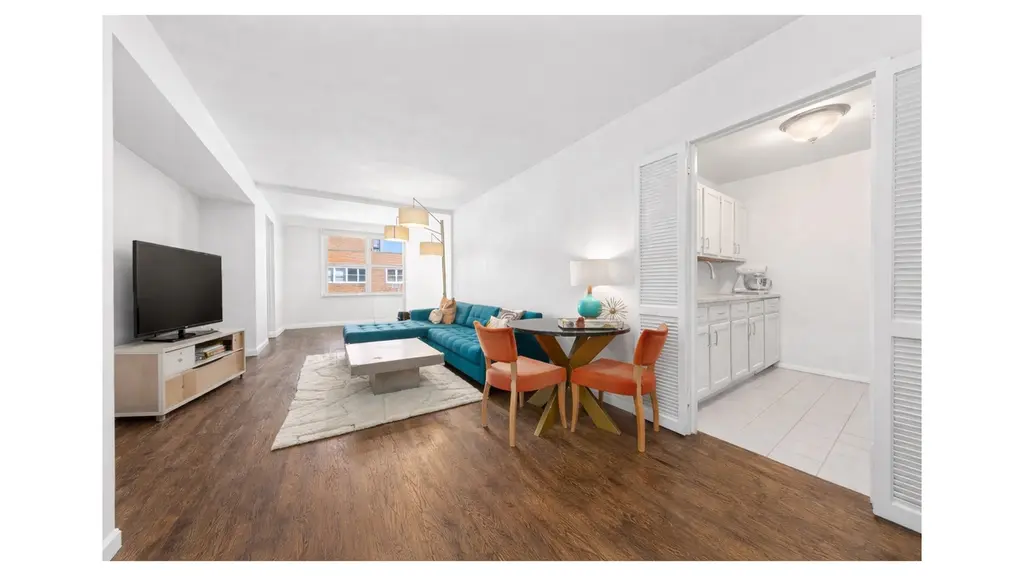
Listing remarks
Incredible sun-lit high-floor renovated one bedroom with Empire State Building views. Welcome home to 205 Third Avenue, Apartment 17L - a beautifully newly renovated residence with a smart, flexible layout in the highly sought-after Gramercy Park Towers. Perfectly positioned just four blocks from Union Square, this home sits in the heart of Gramercy. Oversized windows flood the space with natural light while framing iconic Empire State Building views. The expansive living room is complemented by custom walnut-framed, frosted glass sliding doors, creating a seamless separation between living and sleeping areas and offering the functionality of a true one-bedroom. A gracious entry foyer le
Key facts
- Walk-in closet
- Floating vanity
- $1,223 HOA
Tags
Property features AI
Finance
- Other: Building contains 326 total units
- HOA & community: Monthly association fee of $1,223; Building allows dogs and cats
Exterior
- Parking: Has garage
- Utilities: Central air conditioning
- Home design: Condo in a high-rise building; Gramercy Park Tower; 20-story building; Entry level 17
- Construction: Elevator-served building
- Exterior features: Private outdoor space under 60 sqft; North-facing exposure; Has a view
Interior
- Bedrooms: Unit located on entry level 17
- Bathrooms: 1 full bathroom
- Heating & cooling: Central air conditioning
- Interior features: Elevator access in the building; Private outdoor space under 60 sqft; North-facing exposure; Has a view
- Laundry & utility: No in-unit laundry; building has no laundry facilities
Neighborhood map
What this means for you Summary
Snapshot
- This is a 1-bed/1.0-bath condo listed at $599k.
Deal economics
- At list price, monthly cash flow is $635 ($8k/yr) — positive.
- The deal already cash-flows at list — no discount required.
- Meets the 1% rule at list price ($8k rent vs $599k).
- Recommended offer: $545k (9.0% below list) — sets the bar for market timing.
- Cap rate 7.6% vs local median 2.6% in New York — top-decile yield for the area; either an underpriced asset or a hidden risk that comps aren't pricing in. Stress-test before assuming the spread holds.
Location & tenants
- Location reads 75/100 on livability (#268 in NY, #4,188 nationally) — a middle-class / working-renter tenant base. Strengths: amenities A+, commute A+, health & safety A; Watch: crime F, cost of living F.
- Market conditions: Rents rising fast (+9.2%/yr); 365 active listings in the ZIP; 40 comparable units currently listed for rent nearby; rentals leasing fast (median 7d on market — plan ~1-2 weeks tenant-placement turnaround); high-income renter base; 4,467 units permitted in New York County in 2024 (4,463 in 5+ unit buildings).
- At $7,592/mo this rent would consume 59% of the median local household income ($154k/yr) (locally 3480% of renters already pay >50% of income on rent) — very limited rent-growth headroom before tenants either downsize or default.
Forward outlook
- In year one you build about $60k of equity ($4k loan paydown + $56k appreciation (9.3% local appreciation)).
- New York County population projected at +21% by 2050 — long-run rental-demand tailwind backs the buy-and-hold thesis.
- At projected returns (9.3% appreciation + 8.0% rent growth), your $168k cash investment doubles in ~3 years — after that, you're playing with house money.
- By year 2, paydown + projected appreciation supports a ~$96k cash-out refi (75% LTV) — recoverable capital for the next deal without selling this one.
Negotiation context
- It's been on market 94 days — a 9% lower offer ($545k) is reasonable based on typical stale-listing flexibility.
- 7 sale attempts since 12y ago with the ask held roughly flat each time — persistent listings suggest the price (not the market) is what's stuck; bring a comps-based counter.
Risks & watch-outs
- Climate carrying-cost: major wind risk, 27% chance of damaging wind over 30y; extreme-heat days projected 7→15/yr by 2055 (HVAC capex compounding) — expect insurance premiums to compound above CPI over the hold.
Questions for the listing agent
- It's been on market 94 days. Have you received any prior offers? Is the seller open to a 9% concession, seller financing, or rate buy-down credit?
- Built in 1964 — when were the roof, HVAC, electrical panel, plumbing, and water heater last replaced?
- What does the HOA fee cover, when was the last increase, and are there any pending special assessments or reserve-fund shortfalls?
- Any open or pending special assessments — roof, HVAC, plumbing, elevator, façade? What's the per-unit balance and payoff schedule, and is the seller paying it off at close or rolling it to the buyer?
- Why hasn't it sold? Are there any deal-killer items the seller is aware of (foundation, flood, title, zoning, code violations)?
- Is there a deadline driving the sale (1031 exchange, divorce, estate, relocation)? That informs how much negotiation room exists.
- Schools are B-rated — typically a magnet for longer-tenancy family renters. What's the average tenant stay here, and is there a school-zone premium baked into asking?
- Crime grade is F in this area — have there been break-ins, vandalism, or insurance claims at this property in the last 3 years? What carrier currently insures it and at what premium?
- What's the average days-on-market for RENTAL listings here right now (not sales)? A rising rental-DOM trend means longer vacancies and softer asking-rent achievability than the comps imply.
- What's the recent tenant-quality profile in this submarket — average credit score on applications, eviction rate, late-payment / NSF rate, and stable-employment percentage? A property-management company in the area should have these aggregated.
- How much new apartment / multifamily construction is in the pipeline within 1–3 miles? Heavy new supply (>2% of stock underway) typically softens rents 12–24 months out; light construction supports rent growth.
Investment metrics
- 1% rule
- 1.27% ✓
- Cap rate
- 7.57%
- Cash-on-cash
- 4.54%
- DSCR
- 1.20
- GRM
- 6.6
CMA / ARV
No comps found within radius.
Projected returns pro-forma
9.32% appreciation · 8.0% rent growth · sell at horizon
- IRR
- 28.8%
- Equity multiple
- 3.27×
- Total profit
- $379,925
- Equity at exit
- $510,115
- IRR
- 27.3%
- Equity multiple
- 8.05×
- Total profit
- $1,181,833
- Equity at exit
- $1,070,123
Cash invested: $167,720 (down + closing). Projections, not guarantees.
Landlord ↔ Tenant lean methodology
- Overall (CITY)
- 0 Strongly Tenant-Friendly
- State New York
- 15 Strongly Tenant-Friendly · D+10
- County
- — inherits STATE
- City New York
- 0 Strongly Tenant-Friendly · D+34
ZIP-level market 10003
- Home prices YoY
- 3.4%
- Rents YoY
- 9.2%
- Active inventory
- 365
- Price-to-rent
- 6.6×
Monthly cashflow live
- Estimated rent
- $7,592 high interval (Pro) →
- Mortgage (P&I)
- −$3,141
- Tax est. 1.5%
- −$749 /mo · $8,985/yr
- Insurance
- −$250
- HOA
- −$1,223
- Vacancy / Maint / Mgmt
- −$1,594
- Net cashflow
- $635
Break-even live
Sensitivity live
| Price | -10% $1,049 | -5% $842 | +0% $635 | +5% $428 | +10% $221 |
|---|---|---|---|---|---|
| Rent | -10% $35 | -5% $335 | +0% $635 | +5% $935 | +10% $1,235 |
| Rate | -1.0pp $937 | -0.5pp $787 | base $635 | +0.5pp $480 | +1.0pp $322 |
UW: 25.0% down · 7.5% · 30yr · 1.5% tax · 5.0% vac · 8.0% maint · 8.0% mgmt
Financing live
Cash to close
- Down payment
- $149,750
- Closing costs
- $17,970
- Reserves months
- —
- Total cash needed
- —
Loan-product check · same deal, 3 products live
Conventional
25% down · 7.5% · 30yr
- Down + closing
- —
- Monthly P&I
- —
- Monthly cashflow
- —
- DSCR
- —
- Eligible?
- —
Personal DTI + credit; lowest rate.
DSCR
20% down · 8.5% · 30yr
- Down + closing
- —
- Monthly P&I
- —
- Monthly cashflow
- —
- DSCR
- —
- Eligible?
- —
No personal income docs; deal must DSCR.
Hard money
10% down · 12.0% · 12mo
- Down + closing
- —
- Monthly P&I
- —
- Monthly cashflow
- —
- DSCR
- —
- Eligible?
- —
Short-term bridge; refi at stabilization.
Rent comps 40 comps
| Address | Beds | Baths | Sqft | Rent | $/sqft | DOM | Units | Dist |
|---|---|---|---|---|---|---|---|---|
| 250 E 21st St Unit 8D New York, NY | 1.0 | 1.0 | 688 | $9,525 | $13.84 | 3d | 1 | 0.16mi |
| 290 3rd Ave #279 New York, NY | 1.0 | 1.0 | 607 | $9,740 | $16.03 | 4d | 2 | 0.19mi |
| 346 E 18th St Unit 1254596P New York, NY | 2.0 | 2.0 | 699 | $12,979 | $18.57 | 23d | 1 | 0.24mi |
| 1 Union Sq S #1174 New York, NY | 2.0 | 1.0–2.0 | 775 | $10,120 | $13.06 | 11d | 3 | 0.29mi |
| 209 1st Ave Unit 1370708P New York, NY | 1.0 | 1.0 | 602 | $12,000 | $19.93 | 25d | 1 | 0.39mi |
| 815 Broadway #204 New York, NY | 1.0 | 1.0 | 522 | $8,250 | $15.80 | 8d | 1 | 0.40mi |
| 101 E 10th St #1153 New York, NY | 1.0–2.0 | 1.0–2.0 | 575 | $6,630 | $11.53 | 0d | 2 | 0.40mi |
| 112 E 10th St Unit 1021937P New York, NY | 1.0–3.0 | 1.0–2.5 | 1296 | $5,772 | $4.45 | 4d | 2 | 0.43mi |
| 93 1/2 E 7th St Unit 1054297P New York, NY | 2.0 | 1.0 | 495 | $10,000 | $20.20 | 23d | 1 | 0.62mi |
| 101 W 15th St New York, NY | 1.0 | 1.0 | 562 | $9,550 | $16.98 | 2d | 2 | 0.63mi |
| 20 Waterside Plz #978 New York, NY | 1.0 | 1.0 | 682 | $4,760 | $6.98 | 7d | 1 | 0.63mi |
| 155 E 31st St #2190 New York, NY | 1.0–2.0 | 1.0–1.5 | 725 | $5,610 | $7.74 | 8d | 2 | 0.63mi |
| 30 Waterside Plz New York, NY | 2.0 | 1.0–2.0 | 743 | $5,244 | $7.06 | 0d | 35 | 0.65mi |
| 108 W 15th St #205 New York, NY | 1.0–2.0 | 1.0 | 697 | $6,050 | $8.67 | 4d | 2 | 0.65mi |
| 120 W 21st St New York, NY | 2.0 | 1.0–2.0 | 676 | $7,070 | $10.46 | 5d | 14 | 0.66mi |
| 130 W 15th St #1383 New York, NY | 1.0–2.0 | 1.0–2.0 | 844 | $8,990 | $10.65 | 0d | 2 | 0.68mi |
| 776 6th Ave New York, NY | 2.0 | 1.0–2.0 | 742 | $7,700 | $10.37 | 0d | 19 | 0.68mi |
| 43 W 27th St #1055 New York, NY | 2.0 | 1.0 | 740 | $9,940 | $13.43 | 25d | 1 | 0.68mi |
| 141 E 33rd St #1278 New York, NY | 2.0 | 1.0–1.5 | 683 | $6,230 | $9.12 | 8d | 3 | 0.72mi |
| 309 5th Ave New York, NY | 1.0 | 1.0 | 597 | $7,596 | $12.72 | 8d | 13 | 0.74mi |
| 180 W 20th St #1202 New York, NY | 2.0 | 1.0–2.0 | 791 | $9,465 | $11.96 | 0d | 3 | 0.74mi |
| 222 E 34th St #999 New York, NY | 1.0 | 1.0 | 554 | $5,490 | $9.91 | 7d | 1 | 0.76mi |
| 160 W 24th St New York, NY | 2.0 | 1.0–2.0 | 731 | $7,896 | $10.79 | 0d | 13 | 0.79mi |
| 399 E 34th St Unit 1025362P New York, NY | 1.0 | 1.0 | 570 | $9,174 | $16.09 | 23d | 1 | 0.82mi |
| 364 6th Ave Unit 1023432P New York, NY | 1.0 | 1.0 | 441 | $9,135 | $20.71 | 23d | 1 | 0.82mi |
| 401 E 34th St New York, NY | 3.0 | 1.0–2.0 | 887 | $5,532 | $6.23 | 0d | 50 | 0.84mi |
| 177 Waverly Pl Unit 1075286P New York, NY | 1.0 | 1.0 | 452 | $10,000 | $22.12 | 25d | 1 | 0.85mi |
| 30 Park Ave #1347 New York, NY | 2.0 | 1.0 | 950 | $7,890 | $8.31 | 2d | 3 | 0.87mi |
| 11 E 1st St New York, NY | 2.0 | 1.0–2.0 | 1060 | $8,052 | $7.60 | 0d | 1 | 0.88mi |
| 41 Park Ave New York, NY | 2.0 | 1.0–2.0 | 815 | $6,555 | $8.04 | 8d | 3 | 0.90mi |
| 556 3rd Ave Unit 2244 New York, NY | 1.0 | 1.0 | 500 | $5,640 | $11.28 | 0d | 1 | 0.90mi |
| 556 3rd Ave New York, NY | 1.0 | 1.0 | 580 | $5,240 | $9.03 | 21d | 2 | 0.90mi |
| 556 3rd Ave New York, NY | 1.0 | 1.0 | 540 | $5,635 | $10.44 | 2d | 2 | 0.90mi |
| 229 Chrystie St New York, NY | 1.0–2.0 | 1.0–2.0 | 810 | $6,120 | $7.56 | 5d | 3 | 0.93mi |
| 104 MacDougal St Unit 1056263P New York, NY | 2.0 | 1.0 | 441 | $9,375 | $21.26 | 23d | 1 | 0.95mi |
| 138 E 38th St New York, NY | 3.0 | 1.0–2.0 | 750 | $4,510 | $6.01 | 25d | 4 | 0.96mi |
| 244 W 29th St Unit 2149 New York, NY | 1.0 | 1.0 | 490 | $9,720 | $19.84 | 7d | 2 | 0.99mi |
| 171 Suffolk St #1265 New York, NY | 1.0–2.0 | 1.0 | 650 | $6,950 | $10.69 | 8d | 2 | 1.01mi |
| 243 W 28th St #2143 New York, NY | 1.0 | 1.0 | 580 | $8,960 | $15.45 | 19d | 1 | 1.01mi |
| 290 W 12th St #1592 New York, NY | 1.0–2.0 | 1.0–2.0 | 515 | $7,110 | $13.81 | 8d | 2 | 1.01mi |
HOA detail condo
- Monthly dues
- $1,223 · $14,676/yr
- Assessments
- None detected in remarks — confirm with the listing agent.
Listing history 23 events
-
2026-06-21days on market $599,000 Active 94 DOM
-
2026-06-18days on market $599,000 Active 91 DOM
-
2026-06-17days on market $599,000 Active 90 DOM
-
2026-06-15days on market $599,000 Active 88 DOM
-
2026-06-13days on market $599,000 Active 86 DOM
-
2026-06-10days on market $599,000 Active 82 DOM
-
2026-06-08days on market $599,000 Active 81 DOM
-
2026-06-08days on market $599,000 Active 80 DOM
-
2026-06-04days on market $599,000 Active 77 DOM
-
2026-06-03days on market $599,000 Active 76 DOM
-
2026-06-01days on market $599,000 Active 74 DOM
-
2026-05-31days on market $599,000 Active 73 DOM
-
2026-03-19$599,000 Active
-
2026-01-28price $650,000
-
2017-09-25price $590,000
-
2017-06-23price $599,000
-
2017-04-04$635,000
-
2017-04-04$590,000
-
2017-04-04$590,000
-
2014-10-03price $535,000
-
2014-09-04$515,000
-
2014-04-16$535,000
-
2014-04-16$535,000
ⓘ Source: listings_history table (triggers on properties + properties_extension) + one-shot
backfill from property_details.listing_events for pre-trigger history.
Climate risk First Street
- Flood 1/10 Low FEMA zone X (unshaded) · 0% chance over 30 yrs
- Wildfire 1/10 Low
- Heat 6/10 Major 7 d/yr ≥99°F today · 15 d/yr by 30 yrs out
- Wind 6/10 Major 27% chance of damaging wind over 30 yrs
- Air quality 4/10 Moderate 5 unhealthy d/yr today · 7 by 30 yrs out
Nearby sold comps map
Loading sold comps map…
Walkable amenities ~0.75 mi
Loading nearby amenities…
Taxation est. · year 1
- Rental income
- $91,103
- − Mortgage interest
- −$33,553
- − Property taxes
- −$8,985
- − Insurance
- −$2,995
- − Repairs & maintenance
- −$7,288
- − Management
- −$7,288
- − HOA
- −$14,676
- − Depreciation
- −$17,425
- Taxable loss
- −$1,108
- Est. tax savings @ 24.0%
- +$266
- After-tax cash flow
- $7,887/yr
For passive investors: Depreciation is non-cash, so a rental often shows a tax loss while cash-flowing — sheltering income. Rental losses are passive: they offset passive income freely, and up to $25,000/yr can offset ordinary (W-2) income if you actively participate and your MAGI is under $100k (phasing out to $0 by $150k); unused losses carry forward. On sale, claimed depreciation is recaptured at up to 25%, and gains may owe capital-gains tax (a 1031 exchange can defer both). Figures are a year-1 estimate at your 24.0% rate — not tax advice; consult a CPA.
Schools (NCES district)
No district data.
Livability — New York
- Score
- 75/100
- State rank
- #268
- US rank
- #4188
Category grades
Schools grade is shown separately in the Schools card above.
Census & demographics
- Census place
- New York, NY
- County
- New York County · 1,599,927 people
- City population
- 7,731,280
- Metro
- New York-Newark-Jersey City, NY-NJ-PA
- Population (ZIP)
- 53,560
- Household income
- $154,262
- Rent vs Own
- Severe rent burden
- 3480.0
Population outlook (New York County) Hauer SSP2
- Today (2025)
- 1,825,725 people
- By 2030
- 1,904,611 · +4.3%
- By 2040
- 2,052,719 · +12.4%
- By 2050
- 2,206,601 · +20.9%
- By 2075
- 2,509,427 · +37.4%
- By 2100
- 2,702,933 · +48.0%
Race, ethnicity, and origin ACS 2023
- Neighborhood character
- Majority White (64%)
- Race & ethnicity
- White 64% Asian 18% Hispanic / Latino 10% Two or more races 8% Black 4%
- Hispanic origin (detail)
- Puerto Rican 2%
- Common ancestry
- Scotch-Irish 5% Romanian 5% Lithuanian 3%
- Foreign-born
- 20% · Canada, China, South Korea
- Languages at home
- 78% English-only · Spanish 5% Chinese 4% French/Haitian/Cajun 3%
Political lean MEDSL · New York
- 2024 margin
- Solid D (+64.8) · D 82.4% · R 17.6%
- 2008→2024 swing
- -7.4pp toward R · 2008: 72.2pp · 2024: 64.8pp
- All cycles
- 2024: D+64.8 2020: D+74.5 2016: D+77.2 2012: D+69.6 2008: D+72.2
Not yet ingested
- Civics
- —
Market trends
- HPI YoY
- ▲ 9.32%
- Current HPI
- 284.9232
- Rent YoY
- ▲ 9.24%
- Metro
- New York-Newark-Jersey City, NY-NJ-PA
- State GDP YoY
- ▲ 2.60%
- F500 in state
- 92
Industry mix (Fortune 500 HQ in NY)
| Industry | F500 HQs | Revenue |
|---|---|---|
| Financial Services | 10 | $950B |
|
||
| Consumer Goods | 9 | $162B |
|
||
| Insurance | 4 | $225B |
|
||
| Telecommunications | 2 | $144B |
|
||
| Pharmaceuticals | 2 | $112B |
|
||
| Media / Entertainment | 2 | $69B |
|
||
Price history
+12.0% since first listed11 events — show timeline
- 2026-03-19 Listed $599,000 RLS at REBNY
- 2026-01-28 Price Changed $650,000 RLS at REBNY
- 2017-09-25 Price Changed $590,000 RLS at REBNY
- 2017-06-23 Price Changed $599,000 RLS at REBNY
- 2017-04-04 Listed $590,000 RLS at REBNY
- 2017-04-04 Listed $590,000 RLS at REBNY
- 2017-04-04 Listed $635,000 RLS at REBNY
- 2014-10-03 Price Changed $535,000 RLS at REBNY
- 2014-09-04 Listed $515,000 RLS at REBNY
- 2014-04-16 Listed $535,000 RLS at REBNY
- 2014-04-16 Listed $535,000 RLS at REBNY
Cash-flow waterfall
monthlySold comps — $/sqft
last 12 mo · ≤1 miLoading sold comps…