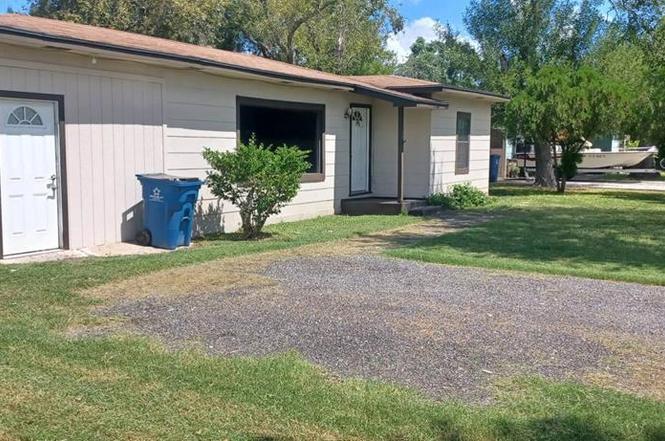
108 N Canal St · Los Fresnos, TX
Flood risk 1/10 · Minimal
- FEMA flood zone
- X (unshaded)
- Chance of flooding over 30 yrs
- 0.0%
- Est. flood insurance / yr
- $507 – $1,088
Fire risk 4/10 · Minor
- Est. fire insurance / yr
- $1,222 – $2,270
Heat risk 9/10 · Severe
- Hot days now (above 110°F)
- 7 days/yr
- Hot days in 30 yrs
- 26 days/yr
Wind risk 9/10 · Severe
- Chance of severe wind over 30 yrs
- 99.0%
Air-quality risk 2/10 · Minimal
- Unhealthy air days now
- 0 days/yr
- Unhealthy air days in 30 yrs
- 1 days/yr
Risk factors via First Street. Map © Google.
Why this score? — see what drove the C+ grade
The composite is a weighted blend of 9 inputs, each scored 0–100. Each bar is that input's sub-score; the figure is the points it added to the 100-point composite (weight × sub-score).
- Cash flow +18.4/30.0
- ARV discount +15.0/15.0
- Appreciation +7.9/10.0
- DSCR +5.8/10.0
- 1% rule +4.9/10.0
- Livability +3.6/5.0
- Schools +3.3/10.0
- Rent growth +2.5/5.0
- Condition / age +2.5/5.0
$178,990
🖨 Deal sheet (PDF) 📄 Offer letter ✓ Due diligence
Listing remarks
Huge living area or tv room, can be converted into a mother in law suite. Big backyard, House is 4ft higher than the street. Flood prevention
Key facts
- Big backyard
- Close to hwy 100
- Bonus room
Tags
Neighborhood map
What this means for you Summary
Snapshot
- This is a 4-bed/1.0-bath single-family listed at $179k.
Deal economics
- At list price, monthly cash flow is $169 ($2k/yr) — positive.
- The deal already cash-flows at list — no discount required.
- To meet the 1% rule (rent ≥ 1% of price), the offer needs to be $178k (0.6% below list).
- Recommended offer: $168k (6.0% below list) — sets the bar for market timing.
Location & tenants
- Location reads 71/100 on livability (#327 in TX) — a middle-class / working-renter tenant base. Strengths: cost of living A+, housing A+, health & safety A+; Watch: employment D, crime F, amenities F.
- Los Fresnos CISD (suburban): math 34% / reading 44% proficiency, ranked #444 of 826 in TX (top 54%) — families likely to look elsewhere, expect single-tenant / working-renter base with shorter leases.
- Zoned schools: Palmer-Laakso El (math 37% / reading 47%, grade F, #1,335 of 4,322 statewide, top 33%, 495 students, 78% FRL); Los Cuates Middle (math 32% / reading 35%, grade F, #911 of 1,662 statewide, top 56%, 809 students, 78% FRL); Los Fresnos H S (math 41% / reading 55%, grade D, #571 of 1,632 statewide, top 36%, 3,272 students, 82% FRL) — zoned schools average 79% FRL vs 43% district-wide (36 pts higher); higher-poverty schools than district average — tighter screening recommended.
- Market conditions: 231 active listings in the ZIP; 8 comparable units currently listed for rent nearby; rentals lingering (median 45d on market — plan ~5-8 weeks vacancy on turnover, expect pricing pressure); 50% of comp listings sitting > 30 days — soft ceiling on asking rent; 2,326 units permitted in Cameron County in 2024 (503 in 5+ unit buildings).
Forward outlook
- In year one you build about $12k of equity ($1k loan paydown + $10k appreciation (5.8% local appreciation)).
- Cameron County population projected at +3% by 2050 — modest demand growth; plan on rents tracking national, not racing it.
- At projected returns (5.8% appreciation + 3.0% rent growth), your $50k cash investment doubles in ~4 years — after that, you're playing with house money.
- By year 4, paydown + projected appreciation supports a ~$39k cash-out refi (75% LTV) — recoverable capital for the next deal without selling this one.
Negotiation context
- It's been on market 88 days — a 6% lower offer ($168k) is reasonable based on typical stale-listing flexibility.
- 2 sale attempts with the ask held roughly flat each time — persistent listings suggest the price (not the market) is what's stuck; bring a comps-based counter.
Risks & watch-outs
- Watch-outs: built in 1950 — expect roof / HVAC / electrical / plumbing capex.
- Climate carrying-cost: severe wind risk, 99% chance of damaging wind over 30y; extreme-heat days projected 7→26/yr by 2055 (HVAC capex compounding) — expect insurance premiums to compound above CPI over the hold.
Questions for the listing agent
- It's been on market 88 days. Have you received any prior offers? Is the seller open to a 6% concession, seller financing, or rate buy-down credit?
- Built in 1950 — when were the roof, HVAC, electrical panel, plumbing, and water heater last replaced?
- Why hasn't it sold? Are there any deal-killer items the seller is aware of (foundation, flood, title, zoning, code violations)?
- Is there a deadline driving the sale (1031 exchange, divorce, estate, relocation)? That informs how much negotiation room exists.
- Schools are D-rated, which usually means shorter tenancies and higher turnover. Who's the typical renter profile here, and what's been the actual vacancy rate?
- Crime grade is F in this area — have there been break-ins, vandalism, or insurance claims at this property in the last 3 years? What carrier currently insures it and at what premium?
- What's the average days-on-market for RENTAL listings here right now (not sales)? A rising rental-DOM trend means longer vacancies and softer asking-rent achievability than the comps imply.
- What's the recent tenant-quality profile in this submarket — average credit score on applications, eviction rate, late-payment / NSF rate, and stable-employment percentage? A property-management company in the area should have these aggregated.
- How much new for-sale + rental construction is in the pipeline within 1–3 miles? Heavy new supply typically softens prices + rents 12–24 months out; constrained supply supports both.
Investment metrics
- 1% rule
- 0.99% ✗
- Cap rate
- 7.42%
- Cash-on-cash
- 4.04%
- DSCR
- 1.18
- GRM
- 8.4
CMA / ARV
- ARV (on-the-fly)
- $279,972
- Comps found
- 4
Show comp detail 4 sales within ~0.75 mi
| Address | Dist | Beds/Ba | Sqft | Sold | Price | $/sf | Match |
|---|---|---|---|---|---|---|---|
| 409 W 6th St | 0.55mi | 3/2.0 (-1) | 1,816 (-0%) | 14mo | $179,900 | $99 | 54 |
| 403 Valle Alto Dr | 0.49mi | 3/2.5 (-1) | 1,870 (+3%) | 12mo | $299,000 | $160 | 52 |
| 925 Daisy Dr | 0.37mi | 3/2.0 (-1) | 1,684 (-7%) | 24mo | $259,000 | $154 | 42 |
| 307 Red Oak Dr | 0.55mi | 4/2.5 | 2,007 (+10%) | 16mo | $285,000 | $142 | 37 |
Match score weights: distance 35% · size 25% · config 20% · recency 20%. Top-matched comps best support the ARV.
Projected returns pro-forma
5.78% appreciation · 3.0% rent growth · sell at horizon
- IRR
- 18.2%
- Equity multiple
- 2.20×
- Total profit
- $60,129
- Equity at exit
- $110,052
- IRR
- 17.9%
- Equity multiple
- 4.38×
- Total profit
- $169,148
- Equity at exit
- $197,479
Cash invested: $50,117 (down + closing). Projections, not guarantees.
Landlord ↔ Tenant lean methodology
- Overall (STATE)
- 87 Strongly Landlord-Friendly
- State Texas
- 87 Strongly Landlord-Friendly · R+5
- County
- — inherits STATE
- City
- — inherits STATE
ZIP-level market 78566
- Home prices YoY
- 2.7%
- Active inventory
- 231
- Price-to-rent
- 8.4×
Monthly cashflow live
- Estimated rent
- $1,779 high interval (Pro) →
- Mortgage (P&I)
- −$939
- Tax est. 1.5%
- −$224 /mo · $2,685/yr
- Insurance
- −$75
- HOA
- −$0
- Vacancy / Maint / Mgmt
- −$374
- Net cashflow
- $169
Break-even live
Sensitivity live
| Price | -10% $292 | -5% $231 | +0% $169 | +5% $107 | +10% $45 |
|---|---|---|---|---|---|
| Rent | -10% $28 | -5% $98 | +0% $169 | +5% $239 | +10% $309 |
| Rate | -1.0pp $259 | -0.5pp $214 | base $169 | +0.5pp $122 | +1.0pp $75 |
UW: 25.0% down · 7.5% · 30yr · 1.5% tax · 5.0% vac · 8.0% maint · 8.0% mgmt
Financing live
Cash to close
- Down payment
- $44,748
- Closing costs
- $5,370
- Reserves months
- —
- Total cash needed
- —
Loan-product check · same deal, 3 products live
Conventional
25% down · 7.5% · 30yr
- Down + closing
- —
- Monthly P&I
- —
- Monthly cashflow
- —
- DSCR
- —
- Eligible?
- —
Personal DTI + credit; lowest rate.
DSCR
20% down · 8.5% · 30yr
- Down + closing
- —
- Monthly P&I
- —
- Monthly cashflow
- —
- DSCR
- —
- Eligible?
- —
No personal income docs; deal must DSCR.
Hard money
10% down · 12.0% · 12mo
- Down + closing
- —
- Monthly P&I
- —
- Monthly cashflow
- —
- DSCR
- —
- Eligible?
- —
Short-term bridge; refi at stabilization.
Rent comps 8 comps
| Address | Beds | Baths | Sqft | Rent | $/sqft | DOM | Units | Dist |
|---|---|---|---|---|---|---|---|---|
| 127 Olive St Los Fresnos, TX | 3.0 | 2.5 | 1835 | $1,650 | $0.90 | 22d | 1 | 0.55mi |
| 121 Mimosa St Los Fresnos, TX | 3.0 | 2.5 | 1790 | $1,650 | $0.92 | 44d | 1 | 0.59mi |
| 121 Mimosa St Los Fresnos, TX | 3.0 | 2.5 | 1790 | $1,750 | $0.98 | 14d | 1 | 0.59mi |
| 123 Mimosa St Los Fresnos, TX | 3.0 | 2.5 | 1835 | $1,650 | $0.90 | 14d | 1 | 0.60mi |
| 110 Olive St Los Fresnos, TX | 3.0 | 2.5 | 1975 | $1,700 | $0.86 | 44d | 1 | 0.61mi |
| 32936 Samuel Rd Los Fresnos, TX | 3.0 | 3.0 | 2156 | $2,000 | $0.93 | 44d | 1 | 0.93mi |
| 33267 Harvey Escalante Rd Unit 2 Los Fresnos, TX | 3.0 | 2.0 | 1260 | $1,500 | $1.19 | 22d | 1 | 0.98mi |
| 518 Oriole Dr Los Fresnos, TX | 3.0 | 2.5 | 2206 | $2,900 | $1.31 | 44d | 1 | 1.12mi |
Listing history 23 events
-
2025-11-25status Pending
-
2025-10-22status Active
-
2025-10-22price $178,990
-
2025-10-16historical
-
2025-10-07price $179,000
-
2025-10-06price $183,500
-
2025-09-26price $183,910
-
2025-09-24price $183,920
-
2025-09-23price $183,930
-
2025-09-18price $183,940
-
2025-09-12price $183,950
-
2025-09-11price $183,960
-
2025-09-10price $183,970
-
2025-09-09price $183,980
-
2025-09-08price $183,990
-
2025-09-03price $184,000
-
2025-09-01price $186,940
-
2025-09-01price $186,950
-
2025-08-28price $186,960
-
2025-08-26price $186,970
-
2025-08-26price $186,980
-
2025-08-23price $186,990
-
2025-08-22$187,000 Active
ⓘ Source: listings_history table (triggers on properties + properties_extension) + one-shot
backfill from property_details.listing_events for pre-trigger history.
Climate risk First Street
- Flood 1/10 Low FEMA zone X (unshaded) · 0% chance over 30 yrs
- Wildfire 4/10 Moderate
- Heat 9/10 Extreme 7 d/yr ≥110°F today · 26 d/yr by 30 yrs out
- Wind 9/10 Extreme 99% chance of damaging wind over 30 yrs
- Air quality 2/10 Low 0 unhealthy d/yr today · 1 by 30 yrs out
Nearby sold comps map
Loading sold comps map…
Walkable amenities ~0.75 mi
Loading nearby amenities…
Taxation est. · year 1
- Rental income
- $21,351
- − Mortgage interest
- −$10,026
- − Property taxes
- −$2,685
- − Insurance
- −$895
- − Repairs & maintenance
- −$1,708
- − Management
- −$1,708
- − Depreciation
- −$5,207
- Taxable loss
- −$878
- Est. tax savings @ 24.0%
- +$211
- After-tax cash flow
- $2,235/yr
For passive investors: Depreciation is non-cash, so a rental often shows a tax loss while cash-flowing — sheltering income. Rental losses are passive: they offset passive income freely, and up to $25,000/yr can offset ordinary (W-2) income if you actively participate and your MAGI is under $100k (phasing out to $0 by $150k); unused losses carry forward. On sale, claimed depreciation is recaptured at up to 25%, and gains may owe capital-gains tax (a 1031 exchange can defer both). Figures are a year-1 estimate at your 24.0% rate — not tax advice; consult a CPA.
Schools (NCES district)
- District
- Los Fresnos CISD
- NCES district ID
- 4828290
- Math proficiency
- 34% ▼ -30.00%
- Reading proficiency
- 44% ▼ -10.00%
- Median HH income
- $42,586
- Composite
- 32.92/100
- National rank
- #5601
- State rank
- #444 of 826 in TX
Livability — Los Fresnos
- Score
- 71/100
- State rank
- #327
- US rank
- #7193
Category grades
Schools grade is shown separately in the Schools card above.
Census & demographics
- Census place
- Los Fresnos, TX
- Population (ZIP)
- 24,927
Population outlook (Cameron County) Hauer SSP2
- Today (2025)
- 441,603 people
- By 2030
- 448,113 · +1.5%
- By 2040
- 456,385 · +3.3%
- By 2050
- 456,294 · +3.3%
- By 2075
- 423,851 · -4.0%
- By 2100
- 342,787 · -22.4%
Race, ethnicity, and origin ACS 2023
- Neighborhood character
- Predominantly Hispanic (88%)
- Race & ethnicity
- Hispanic / Latino 88% Two or more races 45% White 10% Black 1%
- Hispanic origin (detail)
- Mexican 84%
- Foreign-born
- 22% · Canada
- Languages at home
- 33% English-only · Spanish 67%
Political lean MEDSL · Cameron
- 2024 margin
- Lean R (+5.8) · D 46.7% · R 52.5%
- 2008→2024 swing
- -34.6pp toward R · 2008: 28.8pp · 2024: -5.8pp
- All cycles
- 2024: R+5.8 2020: D+13.2 2016: D+32.5 2012: D+32.4 2008: D+28.8
Not yet ingested
- Civics
- —
Market trends
- HPI YoY
- ▲ 5.78%
- Current HPI
- 218.1236
- Rent YoY
- —
- Metro
- —
- State GDP YoY
- ▲ 3.95%
- F500 in state
- 110
Industry mix (Fortune 500 HQ in TX)
| Industry | F500 HQs | Revenue |
|---|---|---|
| Energy | 16 | $1,198B |
|
||
| Technology | 5 | $198B |
|
||
| Engineering / Construction | 4 | $72B |
|
||
| Energy Services | 3 | $60B |
|
||
| Utilities | 3 | $41B |
|
||
| Healthcare | 2 | $330B |
|
||
Price history
-4.3% since first listed23 events — show timeline
- 2025-11-25 Pending — RGVMLS
- 2025-10-22 Relisted — RGVMLS
- 2025-10-22 Price Changed $178,990 RGVMLS
- 2025-10-16 Delisted — RGVMLS
- 2025-10-07 Price Changed $179,000 RGVMLS
- 2025-10-06 Price Changed $183,500 RGVMLS
- 2025-09-26 Price Changed $183,910 RGVMLS
- 2025-09-24 Price Changed $183,920 RGVMLS
- 2025-09-23 Price Changed $183,930 RGVMLS
- 2025-09-18 Price Changed $183,940 RGVMLS
- 2025-09-12 Price Changed $183,950 RGVMLS
- 2025-09-11 Price Changed $183,960 RGVMLS
- 2025-09-10 Price Changed $183,970 RGVMLS
- 2025-09-09 Price Changed $183,980 RGVMLS
- 2025-09-08 Price Changed $183,990 RGVMLS
- 2025-09-03 Price Changed $184,000 RGVMLS
- 2025-09-01 Price Changed $186,940 RGVMLS
- 2025-09-01 Price Changed $186,950 RGVMLS
- 2025-08-28 Price Changed $186,960 RGVMLS
- 2025-08-26 Price Changed $186,970 RGVMLS
- 2025-08-26 Price Changed $186,980 RGVMLS
- 2025-08-23 Price Changed $186,990 RGVMLS
- 2025-08-22 Listed $187,000 RGVMLS
Cash-flow waterfall
monthlySold comps — $/sqft
last 12 mo · ≤1 miLoading sold comps…