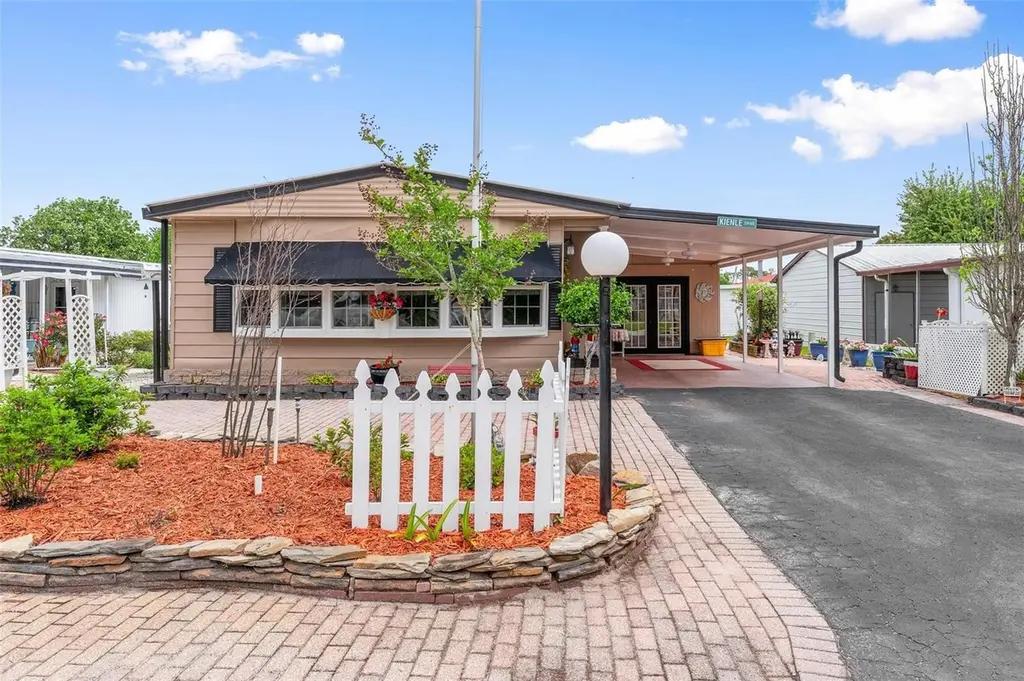
2470 Karen Dr · Mount Dora, FL
Flood risk 1/10 · Minimal
- FEMA flood zone
- X (unshaded)
- Chance of flooding over 30 yrs
- 0.0%
- Est. flood insurance / yr
- $507 – $1,088
Fire risk 4/10 · Minor
- Est. fire insurance / yr
- $947 – $1,759
Heat risk 8/10 · Major
- Hot days now (above 108°F)
- 5 days/yr
- Hot days in 30 yrs
- 16 days/yr
Wind risk 9/10 · Severe
- Chance of severe wind over 30 yrs
- 99.0%
Air-quality risk 2/10 · Minimal
- Unhealthy air days now
- 1 days/yr
- Unhealthy air days in 30 yrs
- 1 days/yr
Risk factors via First Street. Map © Google.
Why this score? — see what drove the C- grade
The composite is a weighted blend of 9 inputs, each scored 0–100. Each bar is that input's sub-score; the figure is the points it added to the 100-point composite (weight × sub-score).
- Cash flow +24.8/30.0
- DSCR +8.0/10.0
- 1% rule +5.8/10.0
- Schools +4.2/10.0
- Livability +3.8/5.0
- Rent growth +2.6/5.0
- Condition / age +2.5/5.0
- ARV discount +0.5/15.0
- Appreciation +0.0/10.0
$208,000
🖨 Deal sheet 📄 Offer letter ✓ Due diligence
Listing remarks
Charming Home in the Heart of Dora Pines 55+ Community! Welcome to this adorable 2-bedroom, 2-bathroom home nestled in the highly sought-after Dora Pines, an inviting adult 55+ community that warmly welcomes pets and embraces a golf cart-friendly lifestyle. Perfectly blending comfort and convenience, this home offers everything you need for a relaxed and enjoyable living experience. Lovely curb appeal greets you as your pull up to this home. The large foyer has an extra large pantry with access to the kitchen and to the dining room. The roof was sealed in the past few years, the HVAC replaced in 2017, Exterior painted in the past few years. Beautiful home that has been care for and wel
Key facts
- Side screen porch
- Plantation shutters
- Extra large pantry
Tags
Property features AI
Finance
- Other: Lease restrictions: none indicated
- Financial info: Total monthly fees reported as $65; Total annual fees reported as $780
- HOA & community: Has HOA (monthly fee $65) - includes pool, management and other services; Association amenities: Clubhouse, Pool, Shuffleboard court; Buyer approval required; Community mailbox; Deed restrictions; Golf carts allowed; Senior community; Pets allowed (max ~101 lbs)
Exterior
- Parking: Has carport (1 space)
- Utilities: Public water and well available; Public sewer; Electricity connected; Cable available; Water connected; Sewer connected
- Home design: Manufactured home (double wide); One story; Facing west; Completed condition; Homesteaded
- Construction: Metal siding and vinyl siding; Metal roof; Roof over; Pillar/post/pier foundation; Built as double wide
- Exterior features: Covered, enclosed and screened side porch; Awnings; Rain gutters; Storage shed
Interior
- Kitchen: Dishwasher; Microwave; Range; Refrigerator; Ice maker; Electric water heater
- Bedrooms: 2 bedrooms
- Flooring: Carpet; Linoleum; Vinyl
- Bathrooms: 2 full bathrooms
- Heating & cooling: Central heating (electric); Central air conditioning
- Interior features: Built-in features; Ceiling fans; Crown molding; Programmable thermostat; Walk-in closet(s); Window treatments (drapes, shutters)
- Laundry & utility: Washer hookup; Dryer hookup (electric); Laundry room; Outside laundry access
Neighborhood map
What this means for you Summary
Snapshot
- This is a 3-bed/2.0-bath manufactured listed at $208k.
Deal economics
- At list price, monthly cash flow is $438 ($5k/yr) — positive.
- The deal already cash-flows at list — no discount required.
- Meets the 1% rule at list price ($2k rent vs $208k).
- Recommended offer: $196k (6.0% below list) — sets the bar for market timing.
- Cap rate 8.8% vs local median 3.3% in Mount Dora — top-decile yield for the area; either an underpriced asset or a hidden risk that comps aren't pricing in. Stress-test before assuming the spread holds.
Location & tenants
- Location reads 75/100 on livability (#244 in FL, #3,860 nationally) — a middle-class / working-renter tenant base. Strengths: health & safety A+, crime A, housing A-; Watch: employment D+, amenities F, commute F.
- Lake (suburban): math 49% / reading 50% proficiency, ranked #37 of 73 in FL (top 51%) — families likely to look elsewhere, expect single-tenant / working-renter base with shorter leases.
- Market conditions: Rents flat; 639 active listings in the ZIP; 15 comparable units currently listed for rent nearby; rentals at typical pace (median 22d on market — plan ~3-4 weeks tenant-placement turnaround); solid renter incomes; 4,799 units permitted in Lake County in 2024 (814 in 5+ unit buildings).
- This rent runs 35% of the median local income ($77k/yr) — at the standard rent-burdened threshold; future hikes will face affordability resistance.
Forward outlook
- Local home prices are declining (-3.0%/yr); year-one equity from $1k of loan paydown is wiped out by about $6k of value loss. Plan a longer hold.
- Lake County population projected at +37% by 2050 — long-run rental-demand tailwind backs the buy-and-hold thesis.
Negotiation context
- It's been on market 70 days — a 6% lower offer ($196k) is reasonable based on typical stale-listing flexibility.
- Current owner paid $48k; list at $208k implies a 333% gain — meaningful room to come down on a strong offer.
Risks & watch-outs
- Climate carrying-cost: severe wind risk, 99% chance of damaging wind over 30y; extreme-heat days projected 5→16/yr by 2055 (HVAC capex compounding) — expect insurance premiums to compound above CPI over the hold.
Questions for the listing agent
- It's been on market 70 days. Have you received any prior offers? Is the seller open to a 6% concession, seller financing, or rate buy-down credit?
- What does the HOA fee cover, when was the last increase, and are there any pending special assessments or reserve-fund shortfalls?
- Why hasn't it sold? Are there any deal-killer items the seller is aware of (foundation, flood, title, zoning, code violations)?
- Is there a deadline driving the sale (1031 exchange, divorce, estate, relocation)? That informs how much negotiation room exists.
- What's the average days-on-market for RENTAL listings here right now (not sales)? A rising rental-DOM trend means longer vacancies and softer asking-rent achievability than the comps imply.
- What's the recent tenant-quality profile in this submarket — average credit score on applications, eviction rate, late-payment / NSF rate, and stable-employment percentage? A property-management company in the area should have these aggregated.
- How much new for-sale + rental construction is in the pipeline within 1–3 miles? Heavy new supply typically softens prices + rents 12–24 months out; constrained supply supports both.
Investment metrics
- 1% rule
- 1.08% ✓
- Cap rate
- 8.82%
- Cash-on-cash
- 9.02%
- DSCR
- 1.40
- GRM
- 7.7
CMA / ARV
- ARV (on-the-fly)
- $179,832
- Comps found
- 1
Show comp detail 1 sale within ~0.75 mi
| Address | Dist | Beds/Ba | Sqft | Sold | Price | $/sf | Match |
|---|---|---|---|---|---|---|---|
| 2557 Karen Dr | 0.09mi | 3/2.0 | 1,458 (+3%) | 14mo | $185,000 | $127 | 80 |
Match score weights: distance 35% · size 25% · config 20% · recency 20%. Top-matched comps best support the ARV.
Projected returns pro-forma
-3.0% appreciation · 0.55% rent growth · sell at horizon
- IRR
- -5.3%
- Equity multiple
- 0.81×
- Total profit
- $-11,242
- Equity at exit
- $31,013
- IRR
- 1.3%
- Equity multiple
- 1.08×
- Total profit
- $4,937
- Equity at exit
- $17,984
Cash invested: $58,240 (down + closing). Projections, not guarantees.
Landlord ↔ Tenant lean methodology
- Overall (STATE)
- 87 Strongly Landlord-Friendly
- State Florida
- 87 Strongly Landlord-Friendly · R+3
- County
- — inherits STATE
- City
- — inherits STATE
ZIP-level market 32757
- Home prices YoY
- -34.5%
- Rents YoY
- 0.6%
- Active inventory
- 639
- Price-to-rent
- 7.7×
Monthly cashflow live
- Estimated rent
- $2,239 high interval (Pro) →
- Mortgage (P&I)
- −$1,091
- Tax from tax record
- −$89 /mo · $1,063/yr
- Insurance
- −$87
- HOA
- −$65
- Vacancy / Maint / Mgmt
- −$470
- Net cashflow
- $438
Break-even live
UW: 25.0% down · 7.5% · 30yr · 1.5% tax · 5.0% vac · 8.0% maint · 8.0% mgmt
Financing live
Cash to close
- Down payment
- $52,000
- Closing costs
- $6,240
- Reserves months
- —
- Total cash needed
- —
Loan-product check · same deal, 3 products live
Conventional
25% down · 7.5% · 30yr
- Down + closing
- —
- Monthly P&I
- —
- Monthly cashflow
- —
- DSCR
- —
- Eligible?
- —
Personal DTI + credit; lowest rate.
DSCR
20% down · 8.5% · 30yr
- Down + closing
- —
- Monthly P&I
- —
- Monthly cashflow
- —
- DSCR
- —
- Eligible?
- —
No personal income docs; deal must DSCR.
Hard money
10% down · 12.0% · 12mo
- Down + closing
- —
- Monthly P&I
- —
- Monthly cashflow
- —
- DSCR
- —
- Eligible?
- —
Short-term bridge; refi at stabilization.
Rent comps 15 comps
| Address | Beds | Baths | Sqft | Rent | $/sqft | DOM | Units | Dist |
|---|---|---|---|---|---|---|---|---|
| 2507 Koji ST Mt Dora, FL | 1.0–3.0 | 1.0–2.0 | 961 | $2,759 | $2.87 | 1d | 9 | 0.74mi |
| 2280 Waterfall Ct Unit 4-302 Mt Dora, FL | 2.0 | 2.0 | 1305 | $1,795 | $1.38 | 17d | 1 | 0.75mi |
| 1127 E 11th Ave Mount Dora, FL | 3.0 | 2.0 | 1226 | $2,600 | $2.12 | 23d | 1 | 0.99mi |
| 3108 Bethpage Loop Mount Dora, FL | 4.0 | 2.0 | 1846 | $2,369 | $1.28 | 21d | 1 | 1.03mi |
| 1006 E 11th Ave Mount Dora, FL | 2.0 | 2.0 | 1390 | $2,500 | $1.80 | 14d | 1 | 1.06mi |
| 1423 N Tremain St Mount Dora, FL | 3.0 | 2.0 | 1096 | $1,745 | $1.59 | 23d | 1 | 1.23mi |
| 764 Chacall Loop Mount Dora, FL | 3.0 | 2.0 | 1600 | $2,400 | $1.50 | 21d | 1 | 1.27mi |
| 764 Chacall Loop Mount Dora, FL | 3.0 | 2.0 | 1566 | $2,400 | $1.53 | 11d | 1 | 1.27mi |
| 949 N Grandview St Mount Dora, FL | 3.0 | 1.0 | 1172 | $2,100 | $1.79 | 4d | 1 | 1.32mi |
| 502 N Simpson St Mount Dora, FL | 2.0 | 2.0 | 1106 | $1,785 | $1.61 | 21d | 1 | 1.34mi |
| 501 N Simpson St Mount Dora, FL | 2.0 | 2.0 | 960 | $1,700 | $1.77 | 23d | 1 | 1.36mi |
| 401 E 9th Ave Mount Dora, FL | 2.0 | 1.5 | 984 | $2,800 | $2.85 | 23d | 1 | 1.38mi |
| 1019 N Tremain St Unit 1017 Mt Dora, FL | 2.0 | 2.0 | 1344 | $1,499 | $1.12 | 23d | 1 | 1.38mi |
| 316 N Simpson St Unit 318 Mt Dora, FL | 2.0 | 2.0 | 1015 | $1,495 | $1.47 | 23d | 1 | 1.44mi |
| 155 Veranda Way Mount Dora, FL | 1.0–2.0 | 1.0–2.0 | 785 | $1,748 | $2.23 | 2d | 12 | 1.46mi |
HOA detail
- Monthly dues
- $65 · $780/yr
Listing history 18 events
-
2026-06-18days on market $208,000 Active 70 DOM
-
2026-06-17pricedays on market $208,000 Active 69 DOM
-
2026-06-16days on market $218,000 Active 68 DOM
-
2026-06-15days on market $218,000 Active 67 DOM
-
2026-06-13days on market $218,000 Active 65 DOM
-
2026-06-09days on market $218,000 Active 61 DOM
-
2026-06-08days on market $218,000 Active 60 DOM
-
2026-06-07days on market $218,000 Active 59 DOM
-
2026-06-04days on market $218,000 Active 56 DOM
-
2026-06-03days on market $218,000 Active 55 DOM
-
2026-06-02days on market $218,000 Active 54 DOM
-
2026-06-01days on market $218,000 Active 53 DOM
-
2026-05-31days on market $218,000 Active 52 DOM
-
2026-05-08price $218,000
-
2026-04-09$220,000 Active
-
1996-11-06soldstatus $48,000
-
1993-10-13soldstatus $42,500
-
1986-06-01soldstatus $49,000
ⓘ Source: listings_history table (triggers on properties + properties_extension) + one-shot
backfill from property_details.listing_events for pre-trigger history.
Tax reassessment forecast FL · Resets to sale price
- Current annual tax
- $1,063 · $89/mo
- Projected year-2 tax
- $1,726 · $144/mo
- Expected delta
- +$664/yr (+$55/mo · 62.4%)
ⓘ Screening estimate from a state-policy table — verify with the county assessor before closing.
Climate risk First Street
- Flood 1/10 Low FEMA zone X (unshaded) · 0% chance over 30 yrs
- Wildfire 4/10 Moderate
- Heat 8/10 Severe 5 d/yr ≥108°F today · 16 d/yr by 30 yrs out
- Wind 9/10 Extreme 99% chance of damaging wind over 30 yrs
- Air quality 2/10 Low 1 unhealthy d/yr today · 1 by 30 yrs out
Nearby sold comps map
Loading sold comps map…
Walkable amenities ~0.75 mi
Loading nearby amenities…
Taxation est. · year 1
- Rental income
- $26,868
- − Mortgage interest
- −$11,651
- − Property taxes
- −$1,063
- − Insurance
- −$1,040
- − Repairs & maintenance
- −$2,149
- − Management
- −$2,149
- − HOA
- −$780
- − Depreciation
- −$6,051
- Taxable income
- $1,984
- Est. tax owed @ 24.0%
- −$476
- After-tax cash flow
- $4,777/yr
For passive investors: Depreciation is non-cash, so a rental often shows a tax loss while cash-flowing — sheltering income. Rental losses are passive: they offset passive income freely, and up to $25,000/yr can offset ordinary (W-2) income if you actively participate and your MAGI is under $100k (phasing out to $0 by $150k); unused losses carry forward. On sale, claimed depreciation is recaptured at up to 25%, and gains may owe capital-gains tax (a 1031 exchange can defer both). Figures are a year-1 estimate at your 24.0% rate — not tax advice; consult a CPA.
Schools (NCES district)
- District
- Lake
- NCES district ID
- 1201050
- Math proficiency
- 49% ▼ -7.00%
- Reading proficiency
- 50% ▼ -4.00%
- Median HH income
- $46,632
- Composite
- 42.05/100
- National rank
- #3327
- State rank
- #37 of 73 in FL
Livability — Mount Dora
- Score
- 75/100
- State rank
- #244
- US rank
- #3860
Category grades
Schools grade is shown separately in the Schools card above.
Census & demographics
- County
- Lake County · 364,602 people
- City population
- 34,121
- Metro
- Orlando-Kissimmee-Sanford, FL
- Population (ZIP)
- 34,121
- Household income
- $77,216
- Rent vs Own
- Severe rent burden
- 998.0
Population outlook (Lake County) Hauer SSP2
- Today (2025)
- 386,640 people
- By 2030
- 417,107 · +7.9%
- By 2040
- 476,676 · +23.3%
- By 2050
- 531,296 · +37.4%
- By 2075
- 648,303 · +67.7%
- By 2100
- 698,530 · +80.7%
Race, ethnicity, and origin ACS 2023
- Neighborhood character
- Majority White (64%)
- Race & ethnicity
- White 64% Hispanic / Latino 20% Black 12% Two or more races 11% Pacific Islander 1% Native American 1%
- Hispanic origin (detail)
- Mexican 5% Puerto Rican 7% Dominican 1%
- Common ancestry
- Romanian 3% Slovak 3% Lithuanian 2%
- Foreign-born
- 10% · Canada, Jamaica
- Languages at home
- 83% English-only · Spanish 14% Other Indo-European 1%
Political lean MEDSL · Lake
- 2024 margin
- Strong R (+24.7) · D 37.3% · R 62.0%
- 2008→2024 swing
- -11.2pp toward R · 2008: -13.5pp · 2024: -24.7pp
- All cycles
- 2024: R+24.7 2020: R+20.0 2016: R+23.1 2012: R+17.1 2008: R+13.5
Not yet ingested
- Civics
- —
Market trends
- HPI YoY
- ▼ -154.69%
- Current HPI
- 293.4759
- Rent YoY
- ▲ 0.55%
- Metro
- Orlando-Kissimmee-Sanford, FL
- State GDP YoY
- ▲ 3.28%
- F500 in state
- 36
Industry mix (Fortune 500 HQ in FL)
| Industry | F500 HQs | Revenue |
|---|---|---|
| Industrial Technology | 2 | $29B |
|
||
| Insurance | 2 | $17B |
|
||
| Retail | 1 | $60B |
|
||
| Technology Distribution | 1 | $58B |
|
||
| Homebuilding | 1 | $35B |
|
||
| Technology Manufacturing | 1 | $35B |
|
||
Price history
+344.9% since first listed5 events — show timeline
- 2026-05-08 Price Changed $218,000 Stellar MLS as Distributed by MLS Grid
- 2026-04-09 Listed $220,000 Stellar MLS as Distributed by MLS Grid
- 1996-11-06 Sold (Public Records) $48,000 Public Records
- 1993-10-13 Sold (Public Records) $42,500 Public Records
- 1986-06-01 Sold (Public Records) $49,000 Public Records
Property tax history
+10.2%/yrLatest (2025): $1,063 · +3.7% YoY. Source: county tax records.
Cash-flow waterfall
monthlySold comps — $/sqft
last 12 mo · ≤1 miLoading sold comps…