410 S College St · Opp, AL
Flood risk 1/10 · Minimal
- FEMA flood zone
- X (unshaded)
- Chance of flooding over 30 yrs
- 0.0%
- Est. flood insurance / yr
- $507 – $1,088
Fire risk 3/10 · Minor
- Est. fire insurance / yr
- $916 – $1,700
Heat risk 8/10 · Major
- Hot days now (above 107°F)
- 7 days/yr
- Hot days in 30 yrs
- 19 days/yr
Wind risk 8/10 · Major
- Chance of severe wind over 30 yrs
- 99.0%
Air-quality risk 1/10 · Minimal
- Unhealthy air days now
- 0 days/yr
- Unhealthy air days in 30 yrs
- 0 days/yr
Risk factors via First Street. Map © Google.
Why this score? — see what drove the C- grade
The composite is a weighted blend of 9 inputs, each scored 0–100. Each bar is that input's sub-score; the figure is the points it added to the 100-point composite (weight × sub-score).
- Cash flow +24.5/30.0
- DSCR +7.9/10.0
- 1% rule +5.2/10.0
- ARV discount +4.7/15.0
- Livability +3.3/5.0
- Schools +3.1/10.0
- Rent growth +2.5/5.0
- Condition / age +2.5/5.0
- Appreciation +0.0/10.0
$98,000
🖨 Deal sheet (PDF) 📄 Offer letter ✓ Due diligence
Listing remarks
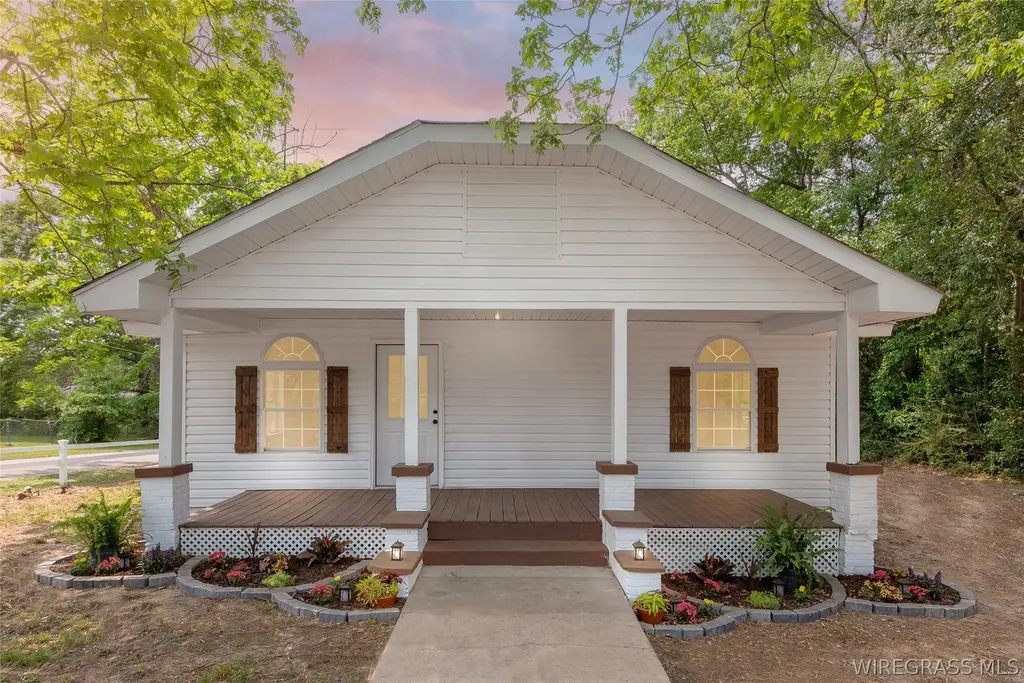
This corner lot boasts a sweet load of charm! Stop in and visit 410 S College Street to experience this lovely, newly updated bundle of coziness! With a well thought-out flower bed design greeting you, step onto the expansive, covered porch, showcasing windows with arched transoms and wooden shutters! Enter into a spacious living area with abundant natural light and a decorative mantle for displaying your treasures. Off to the right is an oversized primary bedroom. Both rooms have a mini-split for your heating and cooling comfort! This home features new LVP flooring & fresh paint throughout - there is a dining area leading into an entirely new kitchen featuring a wall of scenic wi
Key facts
- Covered porch
- New kitchen
- Scenic windows
Tags
Property features AI
Exterior
- Parking: Driveway
- Utilities: Public water; Public sewer; Electricity available; Cable available
- Home design: Single family residence; One-story
- Construction: Vinyl siding
- Exterior features: Covered porch; Deck; Full fencing; City lot
Interior
- Kitchen: Electric range; Refrigerator
- Flooring: Vinyl
- Bathrooms: 1 full bathroom
- Heating & cooling: Hot water heating; Central heating; Electric heating; Central air conditioning; Electric cooling
- Interior features: Electric water heater; Refrigerator
- Laundry & utility: Washer hookup
Neighborhood map
What this means for you Summary
Snapshot
- This is a 3-bed/1.0-bath single-family listed at $98k.
Deal economics
- At list price, monthly cash flow is $202 ($2k/yr) — positive.
- The deal already cash-flows at list — no discount required.
- Meets the 1% rule at list price ($1k rent vs $98k).
- Recommended offer: $95k (3.0% below list) — sets the bar for market timing.
- Cap rate 8.8% vs local median 4.0% in Opp — top-decile yield for the area; either an underpriced asset or a hidden risk that comps aren't pricing in. Stress-test before assuming the spread holds.
Location & tenants
- Location reads 66/100 on livability (#107 in AL) — a middle-class / working-renter tenant base. Strengths: cost of living A+, health & safety A+, housing A; Watch: amenities F, commute F, employment F.
- Opp City (town): math 26% / reading 50% proficiency, ranked #37 of 129 in AL (top 29%) — families likely to look elsewhere, expect single-tenant / working-renter base with shorter leases.
- Zoned schools: Opp Elementary School (math 52% / reading 72%, grade B, #53 of 627 statewide, top 9%, 531 students, 65% FRL); Opp Middle School (math 16% / reading 48%, grade F, #110 of 257 statewide, top 44%, 405 students, 69% FRL); Opp High School (math 22% / reading 17%, grade F, #169 of 305 statewide, top 59%, 393 students, 62% FRL) — zoned schools average 65% FRL vs 48% district-wide (17 pts higher); higher-poverty schools than district average — tighter screening recommended.
- Market conditions: 63 active listings in the ZIP; 1 comparable units currently listed for rent nearby; 13 units permitted in Covington County in 2024 (0 in 5+ unit buildings).
Forward outlook
- Local home prices are declining (-3.0%/yr); year-one equity from $678 of loan paydown is wiped out by about $3k of value loss. Plan a longer hold.
- Covington County population projected to shrink 10% by 2050 — rents likely to lag national; underwrite the cash flow, not the appreciation.
Negotiation context
- It's been on market 52 days — a 3% lower offer ($95k) is reasonable based on typical stale-listing flexibility.
- 2 sale attempts; this cycle's ask has dropped $16k (14%) from the opening price — seller is motivated, your offer sets the floor, not the list.
- Current owner paid $25k; list at $98k implies a 292% gain — meaningful room to come down on a strong offer.
Risks & watch-outs
- Watch-outs: built in 1941 — expect roof / HVAC / electrical / plumbing capex.
- Climate carrying-cost: severe wind risk, 99% chance of damaging wind over 30y; extreme-heat days projected 7→19/yr by 2055 (HVAC capex compounding) — expect insurance premiums to compound above CPI over the hold.
Questions for the listing agent
- It's been on market 52 days. Have you received any prior offers? Is the seller open to a 3% concession, seller financing, or rate buy-down credit?
- Built in 1941 — when were the roof, HVAC, electrical panel, plumbing, and water heater last replaced?
- Is there a deadline driving the sale (1031 exchange, divorce, estate, relocation)? That informs how much negotiation room exists.
- Schools are D-rated, which usually means shorter tenancies and higher turnover. Who's the typical renter profile here, and what's been the actual vacancy rate?
- What's the average days-on-market for RENTAL listings here right now (not sales)? A rising rental-DOM trend means longer vacancies and softer asking-rent achievability than the comps imply.
- What's the recent tenant-quality profile in this submarket — average credit score on applications, eviction rate, late-payment / NSF rate, and stable-employment percentage? A property-management company in the area should have these aggregated.
- How much new for-sale + rental construction is in the pipeline within 1–3 miles? Heavy new supply typically softens prices + rents 12–24 months out; constrained supply supports both.
Investment metrics
- 1% rule
- 1.02% ✓
- Cap rate
- 8.76%
- Cash-on-cash
- 8.82%
- DSCR
- 1.39
- GRM
- 8.2
CMA / ARV
- ARV (median comp)
- $92,298
- List price
- $98,000
- Delta
- 6.18%
- Verdict
- FAIR
- Comps
- 20 within 1.0 mi
Show comp detail 12 sales within ~0.75 mi
| Address | Dist | Beds/Ba | Sqft | Sold | Price | $/sf | Match |
|---|---|---|---|---|---|---|---|
| 504 Brown St | 0.43mi | 3/1.0 | 1,333 (+2%) | 15mo | $130,000 | $98 | 63 |
| 607 Gavins St | 0.36mi | 3/1.5 | 1,232 (-5%) | 17mo | $42,500 | $34 | 58 |
| 104 Spurlin St | 0.52mi | 2/2.0 (-1) | 1,261 (-3%) | 4mo | $38,000 | $30 | 58 |
| 401 E Ida Ave | 0.56mi | 3/2.0 | 1,334 (+3%) | 9mo | $45,000 | $34 | 58 |
| 401 East Hart Ave | 0.49mi | 3/2.0 | 1,279 (-2%) | 20mo | $158,000 | $124 | 54 |
| 106 Spurlin St | 0.53mi | 3/1.5 | 1,445 (+11%) | 3mo | $155,000 | $107 | 52 |
| 405 Dorsey St | 0.50mi | 3/2.0 | 1,360 (+5%) | 22mo | $75,000 | $55 | 47 |
| 307 Jackson St | 0.60mi | 2/1.0 (-1) | 1,344 (+3%) | 21mo | $32,000 | $24 | 44 |
| 601 Virginia Ave | 0.64mi | 3/1.0 | 1,448 (+11%) | 14mo | $93,000 | $64 | 39 |
| 810 Old Perry Store Rd | 0.61mi | 3/2.0 | 1,480 (+14%) | 12mo | $182,000 | $123 | 34 |
| 220 W Covington Ave | 0.60mi | 2/2.0 (-1) | 1,418 (+9%) | 20mo | $48,000 | $34 | 31 |
| 114 West Ida Ave | 0.62mi | 3/2.0 | 1,457 (+12%) | 21mo | $179,950 | $124 | 29 |
Match score weights: distance 35% · size 25% · config 20% · recency 20%. Top-matched comps best support the ARV.
Projected returns pro-forma
-3.0% appreciation · 3.0% rent growth · sell at horizon
- IRR
- -3.0%
- Equity multiple
- 0.89×
- Total profit
- $-3,073
- Equity at exit
- $14,612
- IRR
- 6.7%
- Equity multiple
- 1.50×
- Total profit
- $13,705
- Equity at exit
- $8,473
Cash invested: $27,440 (down + closing). Projections, not guarantees.
Landlord ↔ Tenant lean methodology
- Overall (STATE)
- 90 Strongly Landlord-Friendly
- State Alabama
- 90 Strongly Landlord-Friendly · R+15
- County
- — inherits STATE
- City
- — inherits STATE
ZIP-level market 36467
- Home prices YoY
- -20.9%
- Active inventory
- 63
- Price-to-rent
- 8.2×
Monthly cashflow live
- Estimated rent
- $1,000 medium interval (Pro) →
- Mortgage (P&I)
- −$514
- Tax from tax record
- −$34 /mo · $402/yr
- Insurance
- −$41
- HOA
- −$0
- Lot rent
- −$0
- Vacancy / Maint / Mgmt
- −$210
- Net cashflow
- $202
Break-even live
Sensitivity live
| Price | -10% $257 | -5% $229 | +0% $202 | +5% $174 | +10% $146 |
|---|---|---|---|---|---|
| Rent | -10% $123 | -5% $162 | +0% $202 | +5% $241 | +10% $281 |
| Rate | -1.0pp $251 | -0.5pp $227 | base $202 | +0.5pp $176 | +1.0pp $150 |
UW: 25.0% down · 7.5% · 30yr · 1.5% tax · 5.0% vac · 8.0% maint · 8.0% mgmt
Financing live
Cash to close
- Down payment
- $24,500
- Closing costs
- $2,940
- Reserves months
- —
- Total cash needed
- —
Loan-product check · same deal, 3 products live
Conventional
25% down · 7.5% · 30yr
- Down + closing
- —
- Monthly P&I
- —
- Monthly cashflow
- —
- DSCR
- —
- Eligible?
- —
Personal DTI + credit; lowest rate.
DSCR
20% down · 8.5% · 30yr
- Down + closing
- —
- Monthly P&I
- —
- Monthly cashflow
- —
- DSCR
- —
- Eligible?
- —
No personal income docs; deal must DSCR.
Hard money
10% down · 12.0% · 12mo
- Down + closing
- —
- Monthly P&I
- —
- Monthly cashflow
- —
- DSCR
- —
- Eligible?
- —
Short-term bridge; refi at stabilization.
Rent comps 1 comps
| Address | Beds | Baths | Sqft | Rent | $/sqft | DOM | Units | Dist |
|---|---|---|---|---|---|---|---|---|
| 203 Paul St Opp, AL | 3.0 | 2.0 | 1428 | $1,000 | $0.70 | 46d | 1 | 1.23mi |
Listing history 21 events
-
2026-06-22days on market $98,000 Active 52 DOM
-
2026-06-21days on market $98,000 Active 51 DOM
-
2026-06-19days on market $98,000 Active 49 DOM
-
2026-06-18days on market $98,000 Active 48 DOM
-
2026-06-17days on market $98,000 Active 47 DOM
-
2026-06-16days on market $98,000 Active 46 DOM
-
2026-06-15days on market $98,000 Active 45 DOM
-
2026-06-14days on market $98,000 Active 43 DOM
-
2026-06-12days on market $98,000 Active 42 DOM
-
2026-06-09days on market $98,000 Active 39 DOM
-
2026-06-08days on market $98,000 Active 38 DOM
-
2026-06-07status $98,000 Active 37 DOM
-
2026-06-01status $98,000 Pending 37 DOM
-
2026-05-31days on market $98,000 Active 37 DOM
-
2026-05-31days on market $98,000 Active 36 DOM
-
2026-05-09price $104,000 1276-char remark
-
2026-04-24$114,000 Active 1276-char remark
-
2026-03-16soldstatus $25,000
-
2025-08-15price $29,900
-
2025-08-13price $34,900
-
2025-08-11price $39,900
ⓘ Source: listings_history table (triggers on properties + properties_extension) + one-shot
backfill from property_details.listing_events for pre-trigger history.
Tax reassessment forecast AL · Resets to sale price
- Current annual tax
- $402 · $34/mo
- Projected year-2 tax
- $402 · $34/mo
- Expected delta
- $0/yr ($0/mo · -0.0%)
ⓘ Screening estimate from a state-policy table — verify with the county assessor before closing.
Climate risk First Street
- Flood 1/10 Low FEMA zone X (unshaded) · 0% chance over 30 yrs
- Wildfire 3/10 Moderate
- Heat 8/10 Severe 7 d/yr ≥107°F today · 19 d/yr by 30 yrs out
- Wind 8/10 Severe 99% chance of damaging wind over 30 yrs
- Air quality 1/10 Low 0 unhealthy d/yr today · 0 by 30 yrs out
Nearby sold comps map
Loading sold comps map…
Walkable amenities ~0.75 mi
Loading nearby amenities…
Taxation est. · year 1
- Rental income
- $12,000
- − Mortgage interest
- −$5,490
- − Property taxes
- −$402
- − Insurance
- −$490
- − Repairs & maintenance
- −$960
- − Management
- −$960
- − Depreciation
- −$2,851
- Taxable income
- $847
- Est. tax owed @ 24.0%
- −$203
- After-tax cash flow
- $2,217/yr
For passive investors: Depreciation is non-cash, so a rental often shows a tax loss while cash-flowing — sheltering income. Rental losses are passive: they offset passive income freely, and up to $25,000/yr can offset ordinary (W-2) income if you actively participate and your MAGI is under $100k (phasing out to $0 by $150k); unused losses carry forward. On sale, claimed depreciation is recaptured at up to 25%, and gains may owe capital-gains tax (a 1031 exchange can defer both). Figures are a year-1 estimate at your 24.0% rate — not tax advice; consult a CPA.
Schools (NCES district)
- District
- Opp City
- NCES district ID
- 0102610
- Math proficiency
- 26% ▼ -19.00%
- Reading proficiency
- 50% ▲ 5.00%
- Median HH income
- $32,756
- Composite
- 31.09/100
- National rank
- #6073
- State rank
- #37 of 129 in AL
Livability — Opp
- Score
- 66/100
- State rank
- #107
- US rank
- #11901
Category grades
Schools grade is shown separately in the Schools card above.
Census & demographics
- Census place
- Opp, AL
- City population
- 9,847
- Population (ZIP)
- 9,847
Population outlook (Covington County) Hauer SSP2
- Today (2025)
- 37,007 people
- By 2030
- 36,401 · -1.6%
- By 2040
- 34,983 · -5.5%
- By 2050
- 33,437 · -9.6%
- By 2075
- 29,753 · -19.6%
- By 2100
- 25,109 · -32.2%
Race, ethnicity, and origin ACS 2023
- Neighborhood character
- Predominantly White (84%)
- Race & ethnicity
- White 84% Black 12% Two or more races 4%
- Common ancestry
- Serbian 1% Italian 1% Slovak 1%
- Foreign-born
- 1% · South Korea
- Languages at home
- 99% English-only · Spanish 1%
Political lean MEDSL · Covington
- 2024 margin
- Solid R (+72.4) · D 13.6% · R 86.0%
- 2008→2024 swing
- -14.1pp toward R · 2008: -58.3pp · 2024: -72.4pp
- All cycles
- 2024: R+72.4 2020: R+68.1 2016: R+68.5 2012: R+58.3 2008: R+58.3
Not yet ingested
- Civics
- —
Market trends
- HPI YoY
- ▼ -39.82%
- Current HPI
- 151.1871
- Rent YoY
- —
- Metro
- —
- State GDP YoY
- ▲ 2.94%
- F500 in state
- 4
Industry mix (Fortune 500 HQ in AL)
| Industry | F500 HQs | Revenue |
|---|---|---|
| Financial Services | 1 | $8B |
|
||
| Healthcare | 1 | $5B |
|
||
Price history
+145.6% since first listed9 events — show timeline
- 2026-06-07 Relisted — WBR
- 2026-06-01 Pending — WBR
- 2026-05-26 Price Changed $98,000 WBR
- 2026-05-09 Price Changed $104,000 WBR
- 2026-04-24 Listed $114,000 WBR
- 2026-03-16 Sold (Public Records) $25,000 Public Records
- 2025-08-15 Price Changed $29,900 Greater Alabama MLS
- 2025-08-13 Price Changed $34,900 Greater Alabama MLS
- 2025-08-11 Price Changed $39,900 Greater Alabama MLS
Property tax history
+7.4%/yrLatest (2025): $402 · +6.8% YoY. Source: county tax records.
Cash-flow waterfall
monthlySold comps — $/sqft
last 12 mo · ≤1 miLoading sold comps…