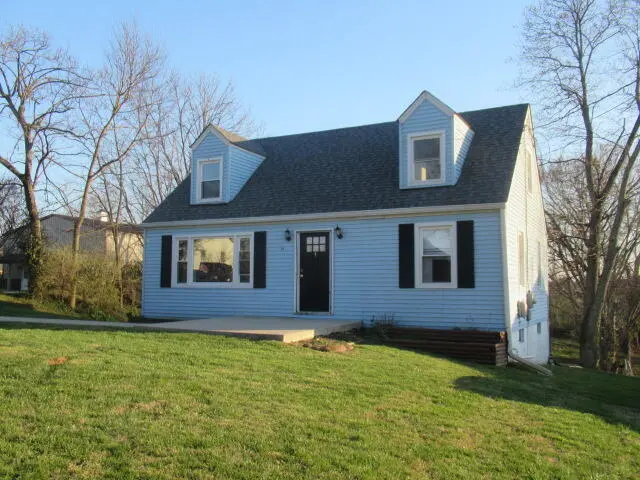
29 Peach Dr · Independence, KY
Flood risk 1/10 · Minimal
- FEMA flood zone
- X (unshaded)
- Chance of flooding over 30 yrs
- 0.0%
- Est. flood insurance / yr
- $507 – $1,088
Fire risk 3/10 · Minor
- Est. fire insurance / yr
- $839 – $1,559
Heat risk 4/10 · Minor
- Hot days now (above 102°F)
- 7 days/yr
- Hot days in 30 yrs
- 19 days/yr
Wind risk 2/10 · Minimal
- Chance of severe wind over 30 yrs
- 1.0%
Air-quality risk 3/10 · Minor
- Unhealthy air days now
- 2 days/yr
- Unhealthy air days in 30 yrs
- 4 days/yr
Risk factors via First Street. Map © Google.
Why this score? — see what drove the C+ grade
The composite is a weighted blend of 9 inputs, each scored 0–100. Each bar is that input's sub-score; the figure is the points it added to the 100-point composite (weight × sub-score).
- Cash flow +22.9/30.0
- ARV discount +15.0/15.0
- DSCR +7.4/10.0
- 1% rule +5.6/10.0
- Schools +4.0/10.0
- Rent growth +3.8/5.0
- Livability +3.6/5.0
- Condition / age +2.5/5.0
- Appreciation +0.0/10.0
$240,000
🖨 Deal sheet 📄 Offer letter ✓ Due diligence
Listing remarks MLS
FULLY RENOVATED*4 BED*2 FULL BATH* Quiet cul-de-sac street*1st floor mst.*Just a short walk from Independence Town Center* Property backs up to Memorial Park, Enjoy the Holiday Parades, fireworks while sitting on your private deck*New HVAC*New soft close Kitchen Cabinets w/granite through-out *new SS appliances* HWH*Walkout to a covered private freshly stained Deck* New shingles*gutters*windows*Carpet *paint* Custom tile shower*designer lighting* plumbing fixtures*concrete 4 car driveway sidewalk ,front porch*Full basement with walk-out* Refinished hwd floors *USDA 100% financing available*
Key facts
- Covered deck
- Back patio
- 0.45 acre lot
Tags
Neighborhood map
What this means for you Summary
Snapshot
- This is a 4-bed/1.0-bath single-family listed at $240k.
Deal economics
- At list price, monthly cash flow is $422 ($5k/yr) — positive.
- The deal already cash-flows at list — no discount required.
- Meets the 1% rule at list price ($3k rent vs $240k).
- Recommended offer: $236k (1.5% below list) — sets the bar for market timing.
- Cap rate 8.4% vs local median 3.7% in Independence — top-decile yield for the area; either an underpriced asset or a hidden risk that comps aren't pricing in. Stress-test before assuming the spread holds.
Location & tenants
- Location reads 72/100 on livability (#130 in KY) — a middle-class / working-renter tenant base. Strengths: crime A+, employment A+, cost of living A+; Watch: amenities F, commute F, health & safety F.
- Kenton County (suburban): math 42% / reading 48% proficiency, ranked #14 of 165 in KY (top 8%) — families likely to look elsewhere, expect single-tenant / working-renter base with shorter leases.
- Zoned schools: Kenton Elementary School (math 59% / reading 52%, grade C, #60 of 676 statewide, top 9%, 627 students, 42% FRL); Twenhofel Middle School (math 33% / reading 47%, grade F, #59 of 217 statewide, top 29%, 835 students, 39% FRL); Simon Kenton High School (math 40% / reading 44%, grade F, #32 of 254 statewide, top 13%, 1,859 students, 37% FRL).
- Market conditions: Rents rising fast (+5.4%/yr); 253 active listings in the ZIP; 1 comparable units currently listed for rent nearby; solid renter incomes; 699 units permitted in Kenton County in 2024 (287 in 5+ unit buildings).
Forward outlook
- Local home prices are declining (-3.0%/yr); year-one equity from $2k of loan paydown is wiped out by about $7k of value loss. Plan a longer hold.
- Kenton County population projected at +5% by 2050 — modest demand growth; plan on rents tracking national, not racing it.
- At projected returns (-3.0% appreciation + 5.4% rent growth), your $67k cash investment doubles in ~10 years — after that, you're playing with house money.
Negotiation context
- It's been on market 15 days — a 2% lower offer ($236k) is reasonable based on typical stale-listing flexibility.
- 8 sale attempts since 25y ago with the ask held roughly flat each time — persistent listings suggest the price (not the market) is what's stuck; bring a comps-based counter.
Questions for the listing agent
- Is there a deadline driving the sale (1031 exchange, divorce, estate, relocation)? That informs how much negotiation room exists.
- Schools are B-rated — typically a magnet for longer-tenancy family renters. What's the average tenant stay here, and is there a school-zone premium baked into asking?
- What's the average days-on-market for RENTAL listings here right now (not sales)? A rising rental-DOM trend means longer vacancies and softer asking-rent achievability than the comps imply.
- What's the recent tenant-quality profile in this submarket — average credit score on applications, eviction rate, late-payment / NSF rate, and stable-employment percentage? A property-management company in the area should have these aggregated.
- How much new for-sale + rental construction is in the pipeline within 1–3 miles? Heavy new supply typically softens prices + rents 12–24 months out; constrained supply supports both.
Investment metrics
- 1% rule
- 1.06% ✓
- Cap rate
- 8.40%
- Cash-on-cash
- 7.54%
- DSCR
- 1.34
- GRM
- 7.8
CMA / ARV
- ARV (on-the-fly)
- $328,048
- Comps found
- 12
Show comp detail 12 sales within ~0.75 mi
| Address | Dist | Beds/Ba | Sqft | Sold | Price | $/sf | Match |
|---|---|---|---|---|---|---|---|
| 29 Peach Dr | 0.00mi | 4/2.0 | 1,624 (0%) | 1mo | $225,000 | $139 | 95 |
| 10737 Cypresswood Dr | 0.22mi | 3/2.5 (-1) | 1,669 (+3%) | 2mo | $345,000 | $207 | 73 |
| 57 Walnut Hall Dr | 0.35mi | 4/1.5 | 1,650 (+2%) | 8mo | $280,000 | $170 | 73 |
| 37 Walnut Hall Dr | 0.28mi | 3/2.0 (-1) | 1,800 (+11%) | 10mo | $302,000 | $168 | 52 |
| 1813 Forest Run Dr | 0.43mi | 3/2.5 (-1) | 1,451 (-11%) | 2mo | $360,000 | $248 | 50 |
| 10797 Cypresswood Dr | 0.45mi | 4/2.5 | 1,848 (+14%) | 1mo | $375,000 | $203 | 50 |
| 5354 Foxdale Ct | 0.45mi | 4/2.0 | 1,537 (-5%) | 20mo | $295,000 | $192 | 49 |
| 2102 Hartland Blvd | 0.54mi | 3/2.0 (-1) | 1,613 (-1%) | 21mo | $280,000 | $174 | 47 |
| 21 Sidney Dr | 0.71mi | 3/2.0 (-1) | 1,462 (-10%) | 1mo | $295,000 | $202 | 41 |
| 1897 Independence Rd | 0.56mi | 3/2.5 (-1) | 1,440 (-11%) | 8mo | $330,000 | $229 | 37 |
| 1784 Forest Run Dr | 0.54mi | 3/3.5 (-1) | 1,815 (+12%) | 12mo | $375,000 | $207 | 31 |
| 9 Sidney Dr | 0.72mi | 3/1.5 (-1) | 1,496 (-8%) | 22mo | $270,000 | $180 | 28 |
Match score weights: distance 35% · size 25% · config 20% · recency 20%. Top-matched comps best support the ARV.
Projected returns pro-forma
-3.0% appreciation · 5.37% rent growth · sell at horizon
- IRR
- -2.2%
- Equity multiple
- 0.91×
- Total profit
- $-5,789
- Equity at exit
- $35,785
- IRR
- 9.8%
- Equity multiple
- 1.84×
- Total profit
- $56,372
- Equity at exit
- $20,751
Cash invested: $67,200 (down + closing). Projections, not guarantees.
Landlord ↔ Tenant lean methodology
- Overall (STATE)
- 83 Strongly Landlord-Friendly
- State Kentucky
- 83 Strongly Landlord-Friendly · R+16
- County
- — inherits STATE
- City
- — inherits STATE
ZIP-level market 41051
- Home prices YoY
- -32.6%
- Rents YoY
- 5.4%
- Active inventory
- 253
- Price-to-rent
- 7.8×
Monthly cashflow live
- Estimated rent
- $2,550 medium interval (Pro) →
- Mortgage (P&I)
- −$1,259
- Tax from tax record
- −$234 /mo · $2,803/yr
- Insurance
- −$100
- HOA
- −$0
- Vacancy / Maint / Mgmt
- −$535
- Net cashflow
- $422
Break-even live
UW: 25.0% down · 7.5% · 30yr · 1.5% tax · 5.0% vac · 8.0% maint · 8.0% mgmt
Financing live
Cash to close
- Down payment
- $60,000
- Closing costs
- $7,200
- Reserves months
- —
- Total cash needed
- —
Loan-product check · same deal, 3 products live
Conventional
25% down · 7.5% · 30yr
- Down + closing
- —
- Monthly P&I
- —
- Monthly cashflow
- —
- DSCR
- —
- Eligible?
- —
Personal DTI + credit; lowest rate.
DSCR
20% down · 8.5% · 30yr
- Down + closing
- —
- Monthly P&I
- —
- Monthly cashflow
- —
- DSCR
- —
- Eligible?
- —
No personal income docs; deal must DSCR.
Hard money
10% down · 12.0% · 12mo
- Down + closing
- —
- Monthly P&I
- —
- Monthly cashflow
- —
- DSCR
- —
- Eligible?
- —
Short-term bridge; refi at stabilization.
Rent comps 1 comps
| Address | Beds | Baths | Sqft | Rent | $/sqft | DOM | Units | Dist |
|---|---|---|---|---|---|---|---|---|
| 10702 Brent Ridge Cir Independence, KY | 2.0–3.0 | 2.0–3.0 | 1520 | $2,775 | $1.83 | 2d | 4 | 0.37mi |
Listing history 31 events
-
2026-04-14status Pending
-
2026-03-30$240,000 Active
-
2022-05-09soldstatus $239,800
-
2022-04-25soldstatus $239,800 Sold 597-char remark
Show marketing remark (597 chars)
FULLY RENOVATED*4 BED*2 FULL BATH* Quiet cul-de-sac street*1st floor mst.*Just a short walk from Independence Town Center* Property backs up to Memorial Park, Enjoy the Holiday Parades, fireworks while sitting on your private deck*New HVAC*New soft close Kitchen Cabinets w/granite through-out *new SS appliances* HWH*Walkout to a covered private freshly stained Deck* New shingles*gutters*windows*Carpet *paint* Custom tile shower*designer lighting* plumbing fixtures*concrete 4 car driveway sidewalk ,front porch*Full basement with walk-out* Refinished hwd floors *USDA 100% financing available*
-
2022-04-10status Pending 597-char remark
Show marketing remark (597 chars)
FULLY RENOVATED*4 BED*2 FULL BATH* Quiet cul-de-sac street*1st floor mst.*Just a short walk from Independence Town Center* Property backs up to Memorial Park, Enjoy the Holiday Parades, fireworks while sitting on your private deck*New HVAC*New soft close Kitchen Cabinets w/granite through-out *new SS appliances* HWH*Walkout to a covered private freshly stained Deck* New shingles*gutters*windows*Carpet *paint* Custom tile shower*designer lighting* plumbing fixtures*concrete 4 car driveway sidewalk ,front porch*Full basement with walk-out* Refinished hwd floors *USDA 100% financing available*
-
2022-04-07$240,900 Active 597-char remark
Show marketing remark (597 chars)
FULLY RENOVATED*4 BED*2 FULL BATH* Quiet cul-de-sac street*1st floor mst.*Just a short walk from Independence Town Center* Property backs up to Memorial Park, Enjoy the Holiday Parades, fireworks while sitting on your private deck*New HVAC*New soft close Kitchen Cabinets w/granite through-out *new SS appliances* HWH*Walkout to a covered private freshly stained Deck* New shingles*gutters*windows*Carpet *paint* Custom tile shower*designer lighting* plumbing fixtures*concrete 4 car driveway sidewalk ,front porch*Full basement with walk-out* Refinished hwd floors *USDA 100% financing available*
-
2022-03-02status Pending
-
2022-03-02historical
-
2022-03-02price $240,900
-
2022-02-27price $235,900
-
2022-02-16price $239,900
-
2022-02-11price $244,800
-
2022-01-31price $244,900
-
2022-01-26$249,900 Active
-
2021-12-11status Active
-
2021-12-11historical
-
2021-12-11historical
-
2021-12-07price $235,800
-
2021-12-01historical
-
2021-11-30$235,900 Active
-
2021-11-28price $239,500
-
2021-11-18price $239,900
-
2021-11-14price $245,500
-
2021-11-12price $249,500
-
2021-11-08$249,900 Active
-
2013-10-11soldstatus $42,500
-
2013-06-20$67,000
-
2012-08-06soldstatus $117,446
-
2001-09-06soldstatus $100,950
-
2001-08-29soldstatus $100,950
-
2001-06-27$104,900
ⓘ Source: listings_history table (triggers on properties + properties_extension) + one-shot
backfill from property_details.listing_events for pre-trigger history.
Tax reassessment forecast KY · Resets to sale price
- Current annual tax
- $2,803 · $234/mo
- Projected year-2 tax
- $2,803 · $234/mo
- Expected delta
- $0/yr ($0/mo · 0.0%)
ⓘ Screening estimate from a state-policy table — verify with the county assessor before closing.
Climate risk First Street
- Flood 1/10 Low FEMA zone X (unshaded) · 0% chance over 30 yrs
- Wildfire 3/10 Moderate
- Heat 4/10 Moderate 7 d/yr ≥102°F today · 19 d/yr by 30 yrs out
- Wind 2/10 Low 100% chance of damaging wind over 30 yrs
- Air quality 3/10 Moderate 2 unhealthy d/yr today · 4 by 30 yrs out
Nearby sold comps map
Loading sold comps map…
Walkable amenities ~0.75 mi
Loading nearby amenities…
Taxation est. · year 1
- Rental income
- $30,596
- − Mortgage interest
- −$13,444
- − Property taxes
- −$2,803
- − Insurance
- −$1,200
- − Repairs & maintenance
- −$2,448
- − Management
- −$2,448
- − Depreciation
- −$6,982
- Taxable income
- $1,272
- Est. tax owed @ 24.0%
- −$305
- After-tax cash flow
- $4,759/yr
For passive investors: Depreciation is non-cash, so a rental often shows a tax loss while cash-flowing — sheltering income. Rental losses are passive: they offset passive income freely, and up to $25,000/yr can offset ordinary (W-2) income if you actively participate and your MAGI is under $100k (phasing out to $0 by $150k); unused losses carry forward. On sale, claimed depreciation is recaptured at up to 25%, and gains may owe capital-gains tax (a 1031 exchange can defer both). Figures are a year-1 estimate at your 24.0% rate — not tax advice; consult a CPA.
Schools (NCES district)
- District
- Kenton County
- NCES district ID
- 2103090
- Math proficiency
- 42% ▼ -13.00%
- Reading proficiency
- 48% ▼ -14.00%
- Median HH income
- $66,183
- Composite
- 40.17/100
- National rank
- #3789
- State rank
- #14 of 165 in KY
Livability — Independence
- Score
- 72/100
- State rank
- #130
- US rank
- #6165
Category grades
Schools grade is shown separately in the Schools card above.
Census & demographics
- Census place
- Independence, KY
- County
- Kenton County · 142,881 people
- City population
- 33,054
- Metro
- Cincinnati, OH-KY-IN
- Population (ZIP)
- 33,054
- Household income
- $104,201
- Rent vs Own
- Severe rent burden
- 243.0
Population outlook (Kenton County) Hauer SSP2
- Today (2025)
- 174,205 people
- By 2030
- 177,897 · +2.1%
- By 2040
- 182,671 · +4.9%
- By 2050
- 183,543 · +5.4%
- By 2075
- 178,977 · +2.7%
- By 2100
- 159,920 · -8.2%
Race, ethnicity, and origin ACS 2023
- Neighborhood character
- Predominantly White (93%)
- Race & ethnicity
- White 93% Two or more races 3% Hispanic / Latino 2% Black 1% Asian 1%
- Common ancestry
- Italian 3% Lithuanian 3% Slovak 2%
- Foreign-born
- 3% · China, Canada
- Languages at home
- 96% English-only · Spanish 1% Chinese 1% Other Asian/Pacific 1%
Political lean MEDSL · Kenton
- 2024 margin
- Strong R (+21.7) · D 38.2% · R 59.9% · Other 1.9%
- 2008→2024 swing
- -0.9pp no change · 2008: -20.9pp · 2024: -21.7pp
- All cycles
- 2024: R+21.7 2020: R+19.3 2016: R+26.1 2012: R+24.3 2008: R+20.9
Not yet ingested
- Civics
- —
Market trends
- HPI YoY
- ▼ -105.60%
- Current HPI
- 218.492
- Rent YoY
- ▲ 5.37%
- Metro
- Cincinnati, OH-KY-IN
- State GDP YoY
- ▲ 1.81%
- F500 in state
- 4
Industry mix (Fortune 500 HQ in KY)
| Industry | F500 HQs | Revenue |
|---|---|---|
| Healthcare | 1 | $118B |
|
||
| Food / Beverage | 1 | $7B |
|
||
Price history
+128.8% since first listed31 events — show timeline
- 2026-04-14 Pending — NKMLS
- 2026-03-30 Listed $240,000 NKMLS
- 2022-05-09 Sold (Public Records) $239,800 Public Records
- 2022-04-25 Sold (MLS) $239,800 NKMLS
- 2022-04-10 Pending — NKMLS
- 2022-04-07 Listed $240,900 NKMLS
- 2022-03-02 Pending — NKMLS
- 2022-03-02 Price Changed $240,900 NKMLS
- 2022-03-02 Listing Removed — NKMLS
- 2022-02-27 Price Changed $235,900 NKMLS
- 2022-02-16 Price Changed $239,900 NKMLS
- 2022-02-11 Price Changed $244,800 NKMLS
- 2022-01-31 Price Changed $244,900 NKMLS
- 2022-01-26 Listed $249,900 NKMLS
- 2021-12-11 Relisted — NKMLS
- 2021-12-11 Listing Removed — NKMLS
- 2021-12-11 Listing Removed — NKMLS
- 2021-12-07 Price Changed $235,800 NKMLS
- 2021-12-01 Listing Removed — NKMLS
- 2021-11-30 Listed $235,900 NKMLS
- 2021-11-28 Price Changed $239,500 NKMLS
- 2021-11-18 Price Changed $239,900 NKMLS
- 2021-11-14 Price Changed $245,500 NKMLS
- 2021-11-12 Price Changed $249,500 NKMLS
- 2021-11-08 Listed $249,900 NKMLS
- 2013-10-11 Sold (MLS) $42,500 NKMLS
- 2013-06-20 Listed $67,000 NKMLS
- 2012-08-06 Sold (Public Records) $117,446 Public Records
- 2001-09-06 Sold (Public Records) $100,950 Public Records
- 2001-08-29 Sold (MLS) $100,950 NKMLS
- 2001-06-27 Listed $104,900 NKMLS
Property tax history
+15.4%/yrLatest (2025): $2,803 · -4.9% YoY. Source: county tax records.
Cash-flow waterfall
monthlySold comps — $/sqft
last 12 mo · ≤1 miLoading sold comps…