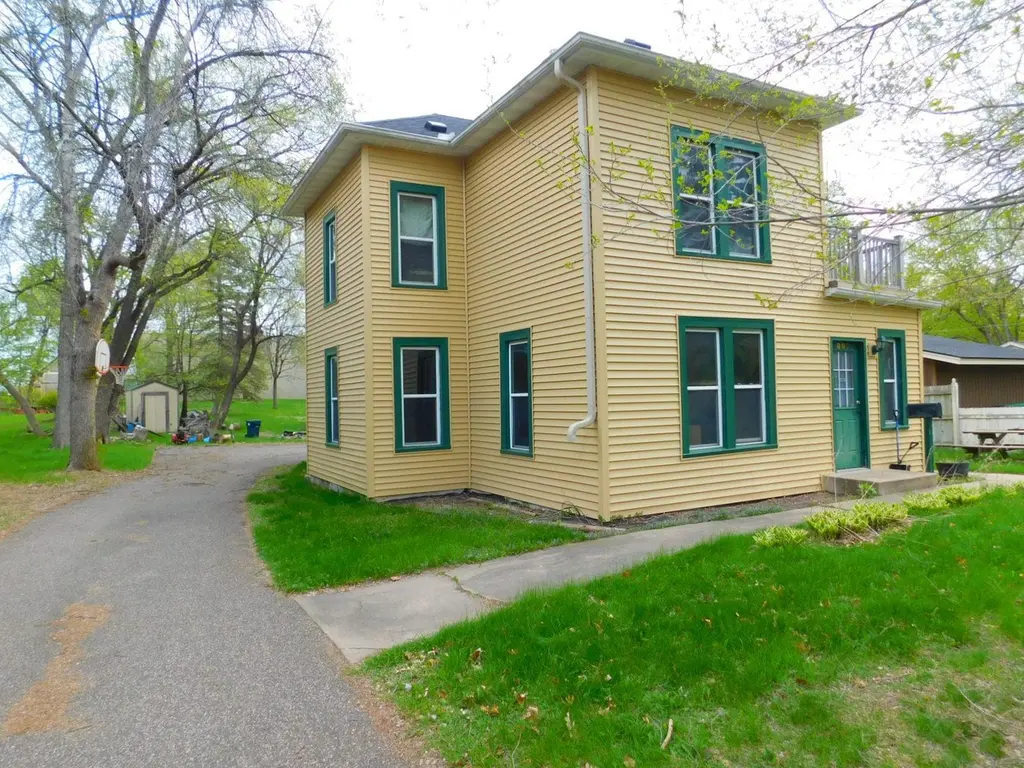
807 Park St · Anoka, MN
Flood risk 6/10 · Moderate
- FEMA flood zone
- X (unshaded)
- Chance of flooding over 30 yrs
- 0.66%
- Est. flood insurance / yr
- $473 – $860
Fire risk 1/10 · Minimal
- Est. fire insurance / yr
- $888 – $1,650
Heat risk 2/10 · Minimal
- Hot days now (above 100°F)
- 7 days/yr
- Hot days in 30 yrs
- 14 days/yr
Wind risk 2/10 · Minimal
- Chance of severe wind over 30 yrs
- —
Air-quality risk 2/10 · Minimal
- Unhealthy air days now
- 2 days/yr
- Unhealthy air days in 30 yrs
- 2 days/yr
Risk factors via First Street. Map © Google.
Why this score? — see what drove the C+ grade
The composite is a weighted blend of 9 inputs, each scored 0–100. Each bar is that input's sub-score; the figure is the points it added to the 100-point composite (weight × sub-score).
- Cash flow +21.0/30.0
- ARV discount +15.0/15.0
- DSCR +6.7/10.0
- 1% rule +5.2/10.0
- Schools +4.7/10.0
- Livability +4.0/5.0
- Rent growth +3.6/5.0
- Condition / age +2.5/5.0
- Appreciation +0.0/10.0
$249,900
🖨 Deal sheet (PDF) 📄 Offer letter ✓ Due diligence
Listing remarks MLS
FANTASTIC home in great Anoka location! Nice kitchen with many custom cabinets. Spacious and open floor plan, freshly painted and newer carpet throughout. Large rooms. Shows great, a must see, priced to sell!
Key facts
- Large deep lot
- Newer roof
- 0.38 acre lot
Tags
Property features AI
Finance
- Financial info: FHA financing available
Exterior
- Parking: Asphalt parking
- Utilities: City water (connected); City sewer (connected); Natural gas
- Home design: Residential property; Two levels
- Construction: Stone foundation
- Exterior features: Vinyl exterior; Porch; Lot dimensions approximately 66 x 250
Interior
- Kitchen: Kitchen (13 x 12); Kitchen window
- Bedrooms: 4 bedrooms (bedroom locations: Main and Upper levels indicated); Bedroom sizes include 13 x 11, 13 x 13, 13 x 10, 10 x 9
- Bathrooms: 2 full bathrooms
- Heating & cooling: Forced air heating; Central air conditioning
- Interior features: Partial, unfinished basement; Family room; Living room; Flex room; Porch; Kitchen window
- Laundry & utility: Upper-level laundry (13 x 10)
Neighborhood map
What this means for you Summary
Snapshot
- This is a 4-bed/2.0-bath single-family listed at $250k.
Deal economics
- At list price, monthly cash flow is $352 ($4k/yr) — positive.
- The deal already cash-flows at list — no discount required.
- Meets the 1% rule at list price ($3k rent vs $250k).
- Recommended offer: $242k (3.0% below list) — sets the bar for market timing.
- Cap rate 8.0% vs local median 3.4% in Anoka — top-decile yield for the area; either an underpriced asset or a hidden risk that comps aren't pricing in. Stress-test before assuming the spread holds.
Location & tenants
- Location reads 79/100 on livability (#102 in MN, #2,300 nationally) — a middle-class / working-renter tenant base. Strengths: commute A+, housing A+, cost of living B+; Watch: amenities D+, health & safety F.
- Anoka-Hennepin Public School District (suburban): math 49% / reading 55% proficiency, ranked #71 of 301 in MN (top 24%) — acceptable for families but not a draw, mixed tenant base, ~2y average lease.
- Zoned schools: Franklin Elementary (math 47% / reading 52%, grade D, #423 of 857 statewide, top 55%, 331 students, 66% FRL); Anoka Middle School For The Arts (math 39% / reading 44%, grade F, #138 of 258 statewide, top 55%, 1,678 students, 44% FRL); Anoka High School (math 26% / reading 63%, grade F, #189 of 471 statewide, top 44%, 2,322 students, 36% FRL) — zoned schools average 49% FRL vs 24% district-wide (24 pts higher); higher-poverty schools than district average — tighter screening recommended.
- Market conditions: Rents rising fast (+4.3%/yr); 346 active listings in the ZIP; 3 comparable units currently listed for rent nearby; rentals at typical pace (median 26d on market — plan ~3-4 weeks tenant-placement turnaround); solid renter incomes; 1,083 units permitted in Anoka County in 2024 (134 in 5+ unit buildings).
Forward outlook
- Local home prices are declining (-3.0%/yr); year-one equity from $2k of loan paydown is wiped out by about $7k of value loss. Plan a longer hold.
- Anoka County population projected at +11% by 2050 — modest demand growth; plan on rents tracking national, not racing it.
Negotiation context
- It's been on market 45 days — a 3% lower offer ($242k) is reasonable based on typical stale-listing flexibility.
- 11 sale attempts since 20y ago; this cycle's ask has dropped $20k (7%) from the opening price — seller is motivated, your offer sets the floor, not the list.
- Current owner paid $119k; list at $250k implies a 110% gain — meaningful room to come down on a strong offer.
Risks & watch-outs
- Watch-outs: built in 1899 — expect roof / HVAC / electrical / plumbing capex.
- Climate carrying-cost: major flood risk — expect insurance premiums to compound above CPI over the hold.
Questions for the listing agent
- It's been on market 45 days. Have you received any prior offers? Is the seller open to a 3% concession, seller financing, or rate buy-down credit?
- Built in 1899 — when were the roof, HVAC, electrical panel, plumbing, and water heater last replaced?
- Is there a deadline driving the sale (1031 exchange, divorce, estate, relocation)? That informs how much negotiation room exists.
- What's the average days-on-market for RENTAL listings here right now (not sales)? A rising rental-DOM trend means longer vacancies and softer asking-rent achievability than the comps imply.
- What's the recent tenant-quality profile in this submarket — average credit score on applications, eviction rate, late-payment / NSF rate, and stable-employment percentage? A property-management company in the area should have these aggregated.
- How much new for-sale + rental construction is in the pipeline within 1–3 miles? Heavy new supply typically softens prices + rents 12–24 months out; constrained supply supports both.
Investment metrics
- 1% rule
- 1.02% ✓
- Cap rate
- 7.98%
- Cash-on-cash
- 6.04%
- DSCR
- 1.27
- GRM
- 8.1
CMA / ARV
- ARV (median comp)
- $413,548
- List price
- $249,900
- Delta
- -39.57%
- Verdict
- UNDERPRICED
- Comps
- 4 within 1.0 mi
Show comp detail 1 sale within ~0.75 mi
| Address | Dist | Beds/Ba | Sqft | Sold | Price | $/sf | Match |
|---|---|---|---|---|---|---|---|
| 318 Rice St | 0.61mi | 4/2.0 | 2,042 (-3%) | 18mo | $450,000 | $220 | 51 |
Match score weights: distance 35% · size 25% · config 20% · recency 20%. Top-matched comps best support the ARV.
Projected returns pro-forma
-3.0% appreciation · 4.31% rent growth · sell at horizon
- IRR
- -5.6%
- Equity multiple
- 0.79×
- Total profit
- $-14,643
- Equity at exit
- $37,261
- IRR
- 5.6%
- Equity multiple
- 1.44×
- Total profit
- $30,546
- Equity at exit
- $21,607
Cash invested: $69,972 (down + closing). Projections, not guarantees.
Landlord ↔ Tenant lean methodology
- Overall (STATE)
- 46 Balanced
- State Minnesota
- 46 Balanced · D+2
- County
- — inherits STATE
- City
- — inherits STATE
ZIP-level market 55303
- Rents YoY
- 4.3%
- Active inventory
- 346
- Price-to-rent
- 8.1×
Monthly cashflow live
- Estimated rent
- $2,559 medium interval (Pro) →
- Mortgage (P&I)
- −$1,311
- Tax from tax record
- −$255 /mo · $3,055/yr
- Insurance
- −$104
- HOA
- −$0
- Vacancy / Maint / Mgmt
- −$537
- Net cashflow
- $352
Break-even live
Sensitivity live
| Price | -10% $494 | -5% $423 | +0% $352 | +5% $281 | +10% $211 |
|---|---|---|---|---|---|
| Rent | -10% $150 | -5% $251 | +0% $352 | +5% $453 | +10% $554 |
| Rate | -1.0pp $478 | -0.5pp $416 | base $352 | +0.5pp $287 | +1.0pp $222 |
UW: 25.0% down · 7.5% · 30yr · 1.5% tax · 5.0% vac · 8.0% maint · 8.0% mgmt
Financing live
Cash to close
- Down payment
- $62,475
- Closing costs
- $7,497
- Reserves months
- —
- Total cash needed
- —
Loan-product check · same deal, 3 products live
Conventional
25% down · 7.5% · 30yr
- Down + closing
- —
- Monthly P&I
- —
- Monthly cashflow
- —
- DSCR
- —
- Eligible?
- —
Personal DTI + credit; lowest rate.
DSCR
20% down · 8.5% · 30yr
- Down + closing
- —
- Monthly P&I
- —
- Monthly cashflow
- —
- DSCR
- —
- Eligible?
- —
No personal income docs; deal must DSCR.
Hard money
10% down · 12.0% · 12mo
- Down + closing
- —
- Monthly P&I
- —
- Monthly cashflow
- —
- DSCR
- —
- Eligible?
- —
Short-term bridge; refi at stabilization.
Rent comps 3 comps
| Address | Beds | Baths | Sqft | Rent | $/sqft | DOM | Units | Dist |
|---|---|---|---|---|---|---|---|---|
| 13470 Linwood Forest Cir Champlin, MN | 4.0 | 3.0 | 1700 | $2,250 | $1.32 | 45d | 1 | 0.78mi |
| 220 E River Pkwy Champlin, MN | 1.0–3.0 | 1.0–2.0 | 1079 | $3,347 | $3.10 | 0d | 15 | 1.07mi |
| 3421 Placer Ave Anoka, MN | 4.0 | 2.0 | 1628 | $2,650 | $1.63 | 25d | 1 | 1.21mi |
Listing history 37 events
-
2026-06-21days on market $249,900 Active 45 DOM
-
2026-06-18days on market $249,900 Active 42 DOM
-
2026-06-17days on market $249,900 Active 41 DOM
-
2026-06-16days on market $249,900 Active 40 DOM
-
2026-06-15pricedays on market $249,900 Active 39 DOM
-
2026-06-13days on market $259,900 Active 37 DOM
-
2026-06-13days on market $259,900 Active 36 DOM
-
2026-06-09days on market $259,900 Active 33 DOM
-
2026-06-08days on market $259,900 Active 32 DOM
-
2026-06-07days on market $259,900 Active 31 DOM
-
2026-06-04days on market $259,900 Active 28 DOM
-
2026-06-03days on market $259,900 Active 27 DOM
-
2026-06-02days on market $259,900 Active 26 DOM
-
2026-06-01days on market $259,900 Active 25 DOM
-
2026-05-31days on market $259,900 Active 24 DOM
-
2026-05-15historical Contingent - Inspection 847-char remark
-
2026-05-07$269,900 Active 847-char remark
-
2011-04-08soldstatus $119,000 210-char remark
Show marketing remark (210 chars)
FANTASTIC home in great Anoka location! Nice kitchen with many custom cabinets. Spacious and open floor plan, freshly painted and newer carpet throughout. Large rooms. Shows great, a must see, priced to sell!
-
2011-02-11historical 210-char remark
Show marketing remark (210 chars)
FANTASTIC home in great Anoka location! Nice kitchen with many custom cabinets. Spacious and open floor plan, freshly painted and newer carpet throughout. Large rooms. Shows great, a must see, priced to sell!
-
2011-01-26$116,910 210-char remark
Show marketing remark (210 chars)
FANTASTIC home in great Anoka location! Nice kitchen with many custom cabinets. Spacious and open floor plan, freshly painted and newer carpet throughout. Large rooms. Shows great, a must see, priced to sell!
-
2011-01-11historical
-
2010-12-02$1
-
2010-11-13historical
-
2010-05-11$129,900
-
2010-05-10historical
-
2010-03-30$157,900
-
2007-12-28historical
-
2007-11-08historical
-
2007-11-08$244,999
-
2007-10-09$234,999
-
2007-04-05soldstatus $113,000
-
2007-02-13historical
-
2006-10-01$114,900
-
2006-09-14historical
-
2006-07-19$218,000
-
2006-06-15historical
-
2006-05-15$219,899
ⓘ Source: listings_history table (triggers on properties + properties_extension) + one-shot
backfill from property_details.listing_events for pre-trigger history.
Tax reassessment forecast MN · Partial reset (capped growth)
- Current annual tax
- $3,055 · $255/mo
- Projected year-2 tax
- $3,055 · $255/mo
- Expected delta
- $0/yr ($0/mo · 0.0%)
ⓘ Screening estimate from a state-policy table — verify with the county assessor before closing.
Climate risk First Street
- Flood 6/10 Major FEMA zone X (unshaded) · 66% chance over 30 yrs
- Wildfire 1/10 Low
- Heat 2/10 Low 7 d/yr ≥100°F today · 14 d/yr by 30 yrs out
- Wind 2/10 Low
- Air quality 2/10 Low 2 unhealthy d/yr today · 2 by 30 yrs out
Nearby sold comps map
Loading sold comps map…
Walkable amenities ~0.75 mi
Loading nearby amenities…
Taxation est. · year 1
- Rental income
- $30,705
- − Mortgage interest
- −$13,998
- − Property taxes
- −$3,055
- − Insurance
- −$1,250
- − Repairs & maintenance
- −$2,456
- − Management
- −$2,456
- − Depreciation
- −$7,270
- Taxable income
- $220
- Est. tax owed @ 24.0%
- −$53
- After-tax cash flow
- $4,174/yr
For passive investors: Depreciation is non-cash, so a rental often shows a tax loss while cash-flowing — sheltering income. Rental losses are passive: they offset passive income freely, and up to $25,000/yr can offset ordinary (W-2) income if you actively participate and your MAGI is under $100k (phasing out to $0 by $150k); unused losses carry forward. On sale, claimed depreciation is recaptured at up to 25%, and gains may owe capital-gains tax (a 1031 exchange can defer both). Figures are a year-1 estimate at your 24.0% rate — not tax advice; consult a CPA.
Schools (NCES district)
- District
- Anoka-Hennepin Public School District
- NCES district ID
- 2703180
- Math proficiency
- 49% ▼ -14.00%
- Reading proficiency
- 55% ▼ -10.00%
- Median HH income
- $73,837
- Composite
- 46.7/100
- National rank
- #2400
- State rank
- #71 of 301 in MN
Livability — Anoka
- Score
- 79/100
- State rank
- #102
- US rank
- #2300
Category grades
Schools grade is shown separately in the Schools card above.
Census & demographics
- Census place
- Anoka, MN
- County
- Anoka County · 277,116 people
- Metro
- Minneapolis-St. Paul-Bloomington, MN-WI
- Population (ZIP)
- 52,614
- Household income
- $102,986
- Rent vs Own
- Severe rent burden
- 1060.0
Population outlook (Anoka County) Hauer SSP2
- Today (2025)
- 375,223 people
- By 2030
- 387,850 · +3.4%
- By 2040
- 407,239 · +8.5%
- By 2050
- 417,541 · +11.3%
- By 2075
- 448,447 · +19.5%
- By 2100
- 464,954 · +23.9%
Race, ethnicity, and origin ACS 2023
- Neighborhood character
- Predominantly White (82%)
- Race & ethnicity
- White 82% Black 7% Two or more races 6% Hispanic / Latino 4% Asian 3%
- Common ancestry
- Portuguese 12% Romanian 5% Lithuanian 4%
- Foreign-born
- 7% · Canada, South Korea, Vietnam
- Languages at home
- 92% English-only · Other Asian/Pacific 2% Spanish 2% French/Haitian/Cajun 1%
Political lean MEDSL · Anoka
- 2024 margin
- Toss-up / Even · D 46.6% · R 51.0% · Other 2.4%
- 2008→2024 swing
- -2.0pp toward R · 2008: -2.4pp · 2024: -4.4pp
- All cycles
- 2024: R+4.4 2020: R+1.9 2016: R+9.7 2012: R+2.6 2008: R+2.4
Not yet ingested
- Civics
- —
Market trends
- HPI YoY
- ▼ -273.26%
- Current HPI
- 251.4034
- Rent YoY
- ▲ 4.31%
- Metro
- Minneapolis-St. Paul-Bloomington, MN-WI
- State GDP YoY
- ▲ 2.41%
- F500 in state
- 34
Industry mix (Fortune 500 HQ in MN)
| Industry | F500 HQs | Revenue |
|---|---|---|
| Healthcare | 2 | $407B |
|
||
| Retail | 2 | $150B |
|
||
| Consumer Goods | 2 | $32B |
|
||
| Industrial Machinery | 2 | $6B |
|
||
| Agriculture | 1 | $40B |
|
||
| Healthcare / Medical Devices | 1 | $32B |
|
||
Price history
+13.6% since first listed25 events — show timeline
- 2026-06-14 Price Changed $249,900 NORTHSTARMLS as Distributed by MLS Grid
- 2026-05-21 Relisted — NORTHSTARMLS as Distributed by MLS Grid
- 2026-05-21 Price Changed $259,900 NORTHSTARMLS as Distributed by MLS Grid
- 2026-05-15 Contingent — NORTHSTARMLS as Distributed by MLS Grid
- 2026-05-07 Listed $269,900 NORTHSTARMLS as Distributed by MLS Grid
- 2011-04-08 Sold (MLS) $119,000 NORTHSTARMLS as Distributed by MLS Grid
- 2011-02-11 Listing Removed — NORTHSTARMLS as Distributed by MLS Grid
- 2011-01-26 Listed $116,910 NORTHSTARMLS as Distributed by MLS Grid
- 2011-01-11 Listing Removed — NORTHSTARMLS as Distributed by MLS Grid
- 2010-12-02 Listed $1 NORTHSTARMLS as Distributed by MLS Grid
- 2010-11-13 Listing Removed — NORTHSTARMLS as Distributed by MLS Grid
- 2010-05-11 Listed $129,900 NORTHSTARMLS as Distributed by MLS Grid
- 2010-05-10 Listing Removed — NORTHSTARMLS as Distributed by MLS Grid
- 2010-03-30 Listed $157,900 NORTHSTARMLS as Distributed by MLS Grid
- 2007-12-28 Listing Removed — NORTHSTARMLS as Distributed by MLS Grid
- 2007-11-08 Listed $244,999 NORTHSTARMLS as Distributed by MLS Grid
- 2007-11-08 Listing Removed — NORTHSTARMLS as Distributed by MLS Grid
- 2007-10-09 Listed $234,999 NORTHSTARMLS as Distributed by MLS Grid
- 2007-04-05 Sold (MLS) $113,000 NORTHSTARMLS as Distributed by MLS Grid
- 2007-02-13 Listing Removed — NORTHSTARMLS as Distributed by MLS Grid
- 2006-10-01 Listed $114,900 NORTHSTARMLS as Distributed by MLS Grid
- 2006-09-14 Listing Removed — NORTHSTARMLS as Distributed by MLS Grid
- 2006-07-19 Listed $218,000 NORTHSTARMLS as Distributed by MLS Grid
- 2006-06-15 Listing Removed — NORTHSTARMLS as Distributed by MLS Grid
- 2006-05-15 Listed $219,899 NORTHSTARMLS as Distributed by MLS Grid
Property tax history
+2.8%/yrLatest (2026): $3,055 · +4.9% YoY. Source: county tax records.
Cash-flow waterfall
monthlySold comps — $/sqft
last 12 mo · ≤1 miLoading sold comps…