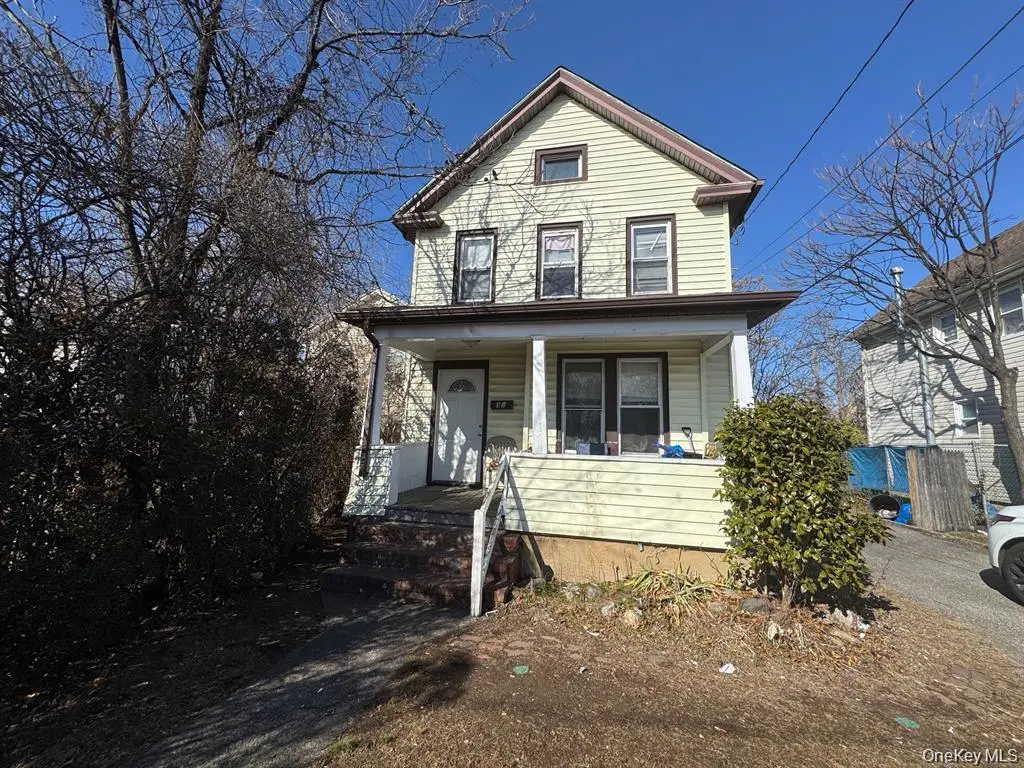
37 Maple Ave · Hempstead, NY
Flood risk 1/10 · Minimal
- FEMA flood zone
- X (unshaded)
- Chance of flooding over 30 yrs
- 0.0%
- Est. flood insurance / yr
- $473 – $860
Fire risk 1/10 · Minimal
- Est. fire insurance / yr
- $691 – $1,283
Heat risk 6/10 · Moderate
- Hot days now (above 96°F)
- 7 days/yr
- Hot days in 30 yrs
- 16 days/yr
Wind risk 6/10 · Moderate
- Chance of severe wind over 30 yrs
- 54.0%
Air-quality risk 4/10 · Minor
- Unhealthy air days now
- 5 days/yr
- Unhealthy air days in 30 yrs
- 8 days/yr
Risk factors via First Street. Map © Google.
Why this score? — see what drove the D grade
The composite is a weighted blend of 9 inputs, each scored 0–100. Each bar is that input's sub-score; the figure is the points it added to the 100-point composite (weight × sub-score).
- ARV discount +15.0/15.0
- Cash flow +9.9/30.0
- Livability +4.0/5.0
- 1% rule +3.0/10.0
- DSCR +2.8/10.0
- Schools +2.8/10.0
- Rent growth +2.5/5.0
- Condition / age +2.5/5.0
- Appreciation +0.0/10.0
$549,999
🖨 Deal sheet 📄 Offer letter ✓ Due diligence
Listing remarks MLS
Spacious 4Bdrm Colonial, Lvrm/Dnrm Combo, EIK, Bdrm on Main, Side Entrance, 3 Bdrms Upstairs,1 Full Bth, Full Walk up Attic, Full Bsmt, 2 Car Det, Large Backyard & Driveway Close to all Shopping, Transportation, Schools, Etc, Must See,
Key facts
- 8,400 sq ft lot
- 2 garage spots
- Built 1913
Neighborhood map
What this means for you Summary
Snapshot
- This is a 4-bed/1.0-bath single-family listed at $550k.
Deal economics
- At list price, monthly cash flow is $-338 ($-4k/yr) — negative.
- To cash-flow at today's rent, offer at most $490k (10.8% below list).
- To meet the 1% rule (rent ≥ 1% of price), the offer needs to be $441k (19.8% below list).
- Recommended offer: $441k (19.8% below list) — sets the bar for 1% rule.
Location & tenants
- Location reads 79/100 on livability (#123 in NY, #2,002 nationally) — a middle-class / working-renter tenant base. Strengths: amenities A+, commute A+, health & safety A; Watch: crime C-, schools D, cost of living F.
- Hempstead Union Free School District (suburban): math 27% / reading 38% proficiency, ranked #567 of 590 in NY (top 96%) — families likely to look elsewhere, expect single-tenant / working-renter base with shorter leases; 72% free/reduced lunch — lower-income household profile, screen leases tightly.
- Market conditions: 167 active listings in the ZIP; 12 comparable units currently listed for rent nearby; rentals at typical pace (median 19d on market — plan ~3-4 weeks tenant-placement turnaround); solid renter incomes; 824 units permitted in Nassau County in 2024 (153 in 5+ unit buildings).
- At $4,413/mo this rent would consume 57% of the median local household income ($93k/yr) (locally 2535% of renters already pay >50% of income on rent) — very limited rent-growth headroom before tenants either downsize or default.
Forward outlook
- Local home prices are declining (-3.0%/yr); year-one equity from $4k of loan paydown is wiped out by about $16k of value loss. Plan a longer hold.
- Nassau County population projected at +7% by 2050 — modest demand growth; plan on rents tracking national, not racing it.
Negotiation context
- It's been on market 37 days — a 3% lower offer ($533k) is reasonable based on typical stale-listing flexibility.
- 4 sale attempts with the ask held roughly flat each time — persistent listings suggest the price (not the market) is what's stuck; bring a comps-based counter.
- Current owner paid $90k; list at $550k implies a 511% gain — meaningful room to come down on a strong offer.
Risks & watch-outs
- Watch-outs: built in 1913 — expect roof / HVAC / electrical / plumbing capex.
- Climate carrying-cost: major wind risk, 54% chance of damaging wind over 30y; extreme-heat days projected 7→16/yr by 2055 (HVAC capex compounding) — expect insurance premiums to compound above CPI over the hold.
Questions for the listing agent
- What do current leases actually rent for vs. the listed asking? Can we see a recent rent roll and the last 12 months of T-12 income?
- It's been on market 37 days. Have you received any prior offers? Is the seller open to a 20% concession, seller financing, or rate buy-down credit?
- Built in 1913 — when were the roof, HVAC, electrical panel, plumbing, and water heater last replaced?
- Is there a deadline driving the sale (1031 exchange, divorce, estate, relocation)? That informs how much negotiation room exists.
- Schools are D-rated, which usually means shorter tenancies and higher turnover. Who's the typical renter profile here, and what's been the actual vacancy rate?
- The area grade is low — what's the realistic commute time and amenity access for the typical tenant pool here? Any planned neighborhood developments (good or bad) we should know about?
- What's the average days-on-market for RENTAL listings here right now (not sales)? A rising rental-DOM trend means longer vacancies and softer asking-rent achievability than the comps imply.
- What's the recent tenant-quality profile in this submarket — average credit score on applications, eviction rate, late-payment / NSF rate, and stable-employment percentage? A property-management company in the area should have these aggregated.
- How much new for-sale + rental construction is in the pipeline within 1–3 miles? Heavy new supply typically softens prices + rents 12–24 months out; constrained supply supports both.
Investment metrics
- 1% rule
- 0.80% ✗
- Cap rate
- 5.56%
- Cash-on-cash
- -2.63%
- DSCR
- 0.88
- GRM
- 10.4
CMA / ARV
- ARV (median comp)
- $670,053
- List price
- $549,999
- Delta
- -17.92%
- Verdict
- UNDERPRICED
- Comps
- 20 within 1.0 mi
Show comp detail 12 sales within ~0.75 mi
| Address | Dist | Beds/Ba | Sqft | Sold | Price | $/sf | Match |
|---|---|---|---|---|---|---|---|
| 142 S Franklin St | 0.11mi | 4/2.0 | 1,499 (+2%) | 3mo | $650,000 | $434 | 84 |
| 16 Laurel Ave | 0.09mi | 4/2.0 | 1,350 (-8%) | 2mo | $670,000 | $496 | 78 |
| 24 Parsons Dr | 0.44mi | 3/1.0 (-1) | 1,470 (+0%) | 2mo | $640,000 | $435 | 72 |
| 34 Frazier St | 0.61mi | 3/1.5 (-1) | 1,472 (+0%) | 1mo | $480,000 | $326 | 62 |
| 77 Virginia Ave | 0.56mi | 5/2.0 (+1) | 1,493 (+2%) | 3mo | $593,000 | $397 | 59 |
| 23 Harriman Ave | 0.19mi | 4/3.0 | 1,264 (-14%) | 2mo | $505,000 | $400 | 59 |
| 54 W Marshall St | 0.69mi | 3/1.5 (-1) | 1,472 (+0%) | 2mo | $475,000 | $323 | 59 |
| 23 Peters Ave | 0.39mi | 3/2.0 (-1) | 1,650 (+13%) | 2mo | $780,000 | $473 | 50 |
| 70 Baldwin Rd | 0.47mi | 4/3.0 | 1,612 (+10%) | 5mo | $660,000 | $409 | 49 |
| 45 Alabama Ave | 0.72mi | 4/2.0 | 1,344 (-8%) | 0mo | $485,000 | $361 | 48 |
| 206 W Marshall St | 0.64mi | 4/1.0 | 1,277 (-13%) | 3mo | $550,000 | $431 | 46 |
| 50 Grant St | 0.59mi | 3/3.0 (-1) | 1,568 (+7%) | 5mo | $637,000 | $406 | 44 |
Match score weights: distance 35% · size 25% · config 20% · recency 20%. Top-matched comps best support the ARV.
Projected returns pro-forma
-3.0% appreciation · 3.0% rent growth · sell at horizon
- IRR
- -20.7%
- Equity multiple
- 0.28×
- Total profit
- $-110,549
- Equity at exit
- $82,007
- IRR
- -13.9%
- Equity multiple
- 0.20×
- Total profit
- $-123,629
- Equity at exit
- $47,554
Cash invested: $154,000 (down + closing). Projections, not guarantees.
Landlord ↔ Tenant lean methodology
- Overall (STATE)
- 15 Strongly Tenant-Friendly
- State New York
- 15 Strongly Tenant-Friendly · D+10
- County
- — inherits STATE
- City
- — inherits STATE
ZIP-level market 11550
- Active inventory
- 167
- Price-to-rent
- 10.4×
Monthly cashflow live
- Estimated rent
- $4,413 high interval (Pro) →
- Mortgage (P&I)
- −$2,884
- Tax from tax record
- −$711 /mo · $8,527/yr
- Insurance
- −$229
- HOA
- −$0
- Vacancy / Maint / Mgmt
- −$927
- Net cashflow
- $-338
Break-even live
UW: 25.0% down · 7.5% · 30yr · 1.5% tax · 5.0% vac · 8.0% maint · 8.0% mgmt
Financing live
Cash to close
- Down payment
- $137,500
- Closing costs
- $16,500
- Reserves months
- —
- Total cash needed
- —
Loan-product check · same deal, 3 products live
Conventional
25% down · 7.5% · 30yr
- Down + closing
- —
- Monthly P&I
- —
- Monthly cashflow
- —
- DSCR
- —
- Eligible?
- —
Personal DTI + credit; lowest rate.
DSCR
20% down · 8.5% · 30yr
- Down + closing
- —
- Monthly P&I
- —
- Monthly cashflow
- —
- DSCR
- —
- Eligible?
- —
No personal income docs; deal must DSCR.
Hard money
10% down · 12.0% · 12mo
- Down + closing
- —
- Monthly P&I
- —
- Monthly cashflow
- —
- DSCR
- —
- Eligible?
- —
Short-term bridge; refi at stabilization.
Rent comps 12 comps
| Address | Beds | Baths | Sqft | Rent | $/sqft | DOM | Units | Dist |
|---|---|---|---|---|---|---|---|---|
| 12 Elm Ave Unit 1 Hempstead, NY | 3.0 | 1.0 | 970 | $3,500 | $3.61 | 18d | 1 | 0.11mi |
| 366 Greenwich St Hempstead, NY | 3.0 | 1.5 | 1504 | $4,000 | $2.66 | 1d | 1 | 0.66mi |
| 54 Kane Ave Hempstead, NY | 5.0 | 2.0 | 1750 | $4,800 | $2.74 | 43d | 1 | 0.74mi |
| 130 Hempstead Ave West Hempstead, NY | 1.0–3.0 | 1.0–2.0 | 1113 | $4,726 | $4.25 | 1d | 6 | 0.91mi |
| 20 Ingraham Ln Hempstead, NY | 3.0 | 1.0 | 950 | $3,150 | $3.32 | 43d | 1 | 0.96mi |
| 111 Hempstead Tpke West Hempstead, NY | 3.0 | 1.0–2.5 | 1226 | $6,776 | $5.52 | 1d | 87 | 0.98mi |
| 533 Greenwich St Unit 1D Hempstead, NY | 3.0 | 2.0 | 1103 | $4,000 | $3.63 | 43d | 1 | 0.99mi |
| 21 Union Ave Hempstead, NY | 4.0 | 3.0 | 1342 | $5,700 | $4.25 | 1d | 1 | 1.17mi |
| 523 Hawthorne Ave Uniondale, NY | 3.0 | 1.0 | 1328 | $3,300 | $2.48 | 24d | 1 | 1.34mi |
| 345 Walton St West Hempstead, NY | 4.0 | 2.5 | 1274 | $4,525 | $3.55 | 1d | 1 | 1.40mi |
| 582 Washington Ave West Hempstead, NY | 4.0 | 1.0 | 1440 | $4,500 | $3.12 | 13d | 1 | 1.41mi |
| 204 Wellington St Hempstead, NY | 4.0 | 2.0 | 1075 | $4,300 | $4.00 | 21d | 1 | 1.48mi |
Listing history 10 events
-
2026-05-14status Pending 239-char remark
Show marketing remark (239 chars)
Spacious 4Bdrm Colonial, Lvrm/Dnrm Combo, EIK, Bdrm on Main, Side Entrance, 3 Bdrms Upstairs,1 Full Bth, Full Walk up Attic, Full Bsmt, 2 Car Det, Large Backyard & Driveway Close to all Shopping, Transportation, Schools, Etc, Must See,
-
2026-04-07$549,999 Active 239-char remark
Show marketing remark (239 chars)
Spacious 4Bdrm Colonial, Lvrm/Dnrm Combo, EIK, Bdrm on Main, Side Entrance, 3 Bdrms Upstairs,1 Full Bth, Full Walk up Attic, Full Bsmt, 2 Car Det, Large Backyard & Driveway Close to all Shopping, Transportation, Schools, Etc, Must See,
-
2026-04-07historical
Show marketing remark (239 chars)
Spacious 4Bdrm Colonial, Lvrm/Dnrm Combo, EIK, Bdrm on Main, Side Entrance, 3 Bdrms Upstairs,1 Full Bth, Full Walk up Attic, Full Bsmt, 2 Car Det, Large Backyard & Driveway Close to all Shopping, Transportation, Schools, Etc, Must See,
-
2026-04-07$549,999 Active
Show marketing remark (239 chars)
Spacious 4Bdrm Colonial, Lvrm/Dnrm Combo, EIK, Bdrm on Main, Side Entrance, 3 Bdrms Upstairs,1 Full Bth, Full Walk up Attic, Full Bsmt, 2 Car Det, Large Backyard & Driveway Close to all Shopping, Transportation, Schools, Etc, Must See,
-
2026-01-08$549,999 Active
-
2025-12-26historical
-
2025-06-24price $549,999
-
2025-02-24$599,999 Active
-
2025-02-10historical
-
2011-06-13soldstatus $90,000
ⓘ Source: listings_history table (triggers on properties + properties_extension) + one-shot
backfill from property_details.listing_events for pre-trigger history.
Tax reassessment forecast NY · Partial reset (capped growth)
- Current annual tax
- $8,527 · $711/mo
- Projected year-2 tax
- $8,911 · $743/mo
- Expected delta
- +$384/yr (+$32/mo · 4.5%)
ⓘ Screening estimate from a state-policy table — verify with the county assessor before closing.
Climate risk First Street
- Flood 1/10 Low FEMA zone X (unshaded) · 0% chance over 30 yrs
- Wildfire 1/10 Low
- Heat 6/10 Major 7 d/yr ≥96°F today · 16 d/yr by 30 yrs out
- Wind 6/10 Major 54% chance of damaging wind over 30 yrs
- Air quality 4/10 Moderate 5 unhealthy d/yr today · 8 by 30 yrs out
Nearby sold comps map
Loading sold comps map…
Walkable amenities ~0.75 mi
Loading nearby amenities…
Taxation est. · year 1
- Rental income
- $52,957
- − Mortgage interest
- −$30,808
- − Property taxes
- −$8,527
- − Insurance
- −$2,750
- − Repairs & maintenance
- −$4,237
- − Management
- −$4,237
- − Depreciation
- −$16,000
- Taxable loss
- −$13,602
- Est. tax savings @ 24.0%
- +$3,264
- After-tax cash flow
- $-788/yr
For passive investors: Depreciation is non-cash, so a rental often shows a tax loss while cash-flowing — sheltering income. Rental losses are passive: they offset passive income freely, and up to $25,000/yr can offset ordinary (W-2) income if you actively participate and your MAGI is under $100k (phasing out to $0 by $150k); unused losses carry forward. On sale, claimed depreciation is recaptured at up to 25%, and gains may owe capital-gains tax (a 1031 exchange can defer both). Figures are a year-1 estimate at your 24.0% rate — not tax advice; consult a CPA.
Schools (NCES district)
- District
- Hempstead Union Free School District
- NCES district ID
- 3614130
- Math proficiency
- 27% ▼ -4.00%
- Reading proficiency
- 38% ▲ 5.00%
- Median HH income
- $48,774
- Composite
- 28.12/100
- National rank
- #6821
- State rank
- #567 of 590 in NY
Livability — Hempstead
- Score
- 79/100
- State rank
- #123
- US rank
- #2002
Category grades
Schools grade is shown separately in the Schools card above.
Census & demographics
- Census place
- Hempstead, NY
- County
- Nassau County · 653,051 people
- City population
- 60,960
- Metro
- New York-Newark-Jersey City, NY-NJ-PA
- Population (ZIP)
- 60,960
- Household income
- $92,677
- Rent vs Own
- Severe rent burden
- 2535.0
Population outlook (Nassau County) Hauer SSP2
- Today (2025)
- 1,409,302 people
- By 2030
- 1,431,482 · +1.6%
- By 2040
- 1,471,607 · +4.4%
- By 2050
- 1,502,845 · +6.6%
- By 2075
- 1,575,403 · +11.8%
- By 2100
- 1,554,356 · +10.3%
Race, ethnicity, and origin ACS 2023
- Neighborhood character
- Diverse neighborhood (Simpson 0.62)
- Race & ethnicity
- Hispanic / Latino 44% Black 43% Two or more races 14% White 7% Asian 2%
- Hispanic origin (detail)
- Mexican 1% Puerto Rican 3% Dominican 4%
- Common ancestry
- Hispanic 4%
- Foreign-born
- 37% · Canada, Jamaica
- Languages at home
- 53% English-only · Spanish 40% French/Haitian/Cajun 4% Other Indo-European 1%
Political lean MEDSL · Nassau
- 2024 margin
- Toss-up / Even · D 47.9% · R 52.1%
- 2008→2024 swing
- -12.6pp toward R · 2008: 8.4pp · 2024: -4.2pp
- All cycles
- 2024: R+4.2 2020: D+9.5 2016: D+5.3 2012: D+6.7 2008: D+8.4
Not yet ingested
- Civics
- —
Market trends
- HPI YoY
- ▼ -297.72%
- Current HPI
- 339.055
- Rent YoY
- —
- Metro
- New York-Newark-Jersey City, NY-NJ-PA
- State GDP YoY
- ▲ 2.60%
- F500 in state
- 92
Industry mix (Fortune 500 HQ in NY)
| Industry | F500 HQs | Revenue |
|---|---|---|
| Financial Services | 10 | $950B |
|
||
| Consumer Goods | 9 | $162B |
|
||
| Insurance | 4 | $225B |
|
||
| Telecommunications | 2 | $144B |
|
||
| Pharmaceuticals | 2 | $112B |
|
||
| Media / Entertainment | 2 | $69B |
|
||
Price history
+511.1% since first listed10 events — show timeline
- 2026-05-14 Pending — OneKey® MLS as Distributed by MLS Grid
- 2026-04-07 Listed $549,999 OneKey® MLS as Distributed by MLS Grid
- 2026-04-07 Listing Removed — OneKey® MLS as Distributed by MLS Grid
- 2026-04-07 Listed $549,999 OneKey® MLS as Distributed by MLS Grid
- 2026-01-08 Listed $549,999 OneKey® MLS as Distributed by MLS Grid
- 2025-12-26 Coming Soon — OneKey® MLS as Distributed by MLS Grid
- 2025-06-24 Price Changed $549,999 OneKey® MLS as Distributed by MLS Grid
- 2025-02-24 Listed $599,999 OneKey® MLS as Distributed by MLS Grid
- 2025-02-10 Coming Soon — OneKey® MLS as Distributed by MLS Grid
- 2011-06-13 Sold (Public Records) $90,000 Public Records
Property tax history
+2.4%/yrLatest (2024): $8,527 · +6.3% YoY. Source: county tax records.
Cash-flow waterfall
monthlySold comps — $/sqft
last 12 mo · ≤1 miLoading sold comps…