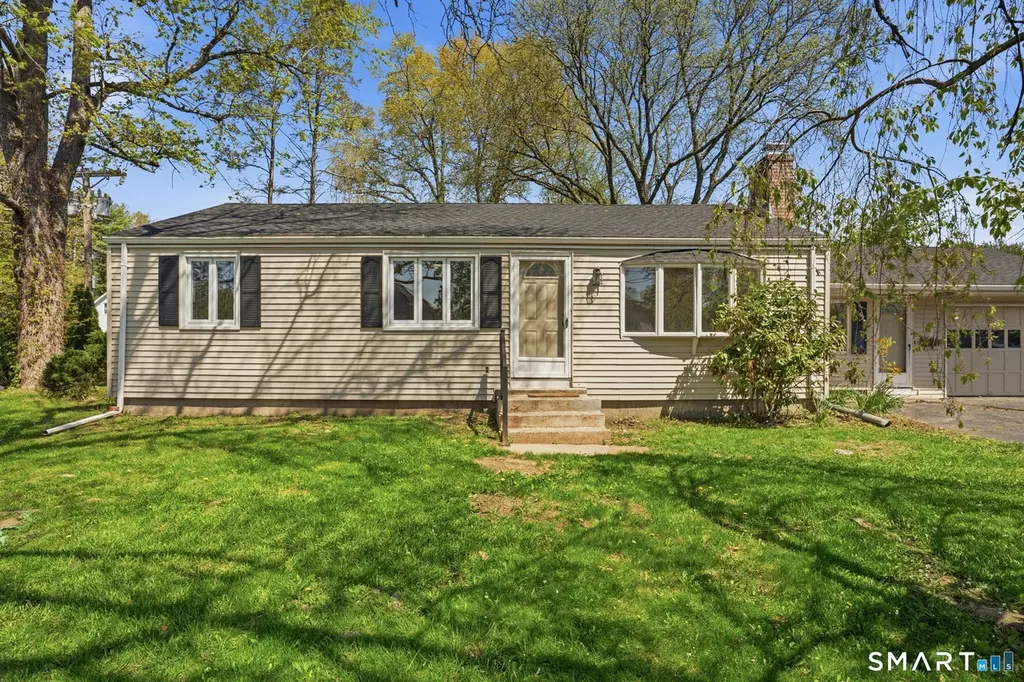
128 Wilson Ave · Newington, CT
Flood risk 1/10 · Minimal
- FEMA flood zone
- X (unshaded)
- Chance of flooding over 30 yrs
- 0.0%
- Est. flood insurance / yr
- $473 – $860
Fire risk 1/10 · Minimal
- Est. fire insurance / yr
- $829 – $1,539
Heat risk 5/10 · Moderate
- Hot days now (above 97°F)
- 7 days/yr
- Hot days in 30 yrs
- 16 days/yr
Wind risk 6/10 · Moderate
- Chance of severe wind over 30 yrs
- 27.0%
Air-quality risk 3/10 · Minor
- Unhealthy air days now
- 3 days/yr
- Unhealthy air days in 30 yrs
- 4 days/yr
Risk factors via First Street. Map © Google.
Why this score? — see what drove the D grade
The composite is a weighted blend of 9 inputs, each scored 0–100. Each bar is that input's sub-score; the figure is the points it added to the 100-point composite (weight × sub-score).
- ARV discount +11.1/15.0
- Cash flow +10.6/30.0
- Schools +4.1/10.0
- Livability +4.0/5.0
- 1% rule +3.3/10.0
- DSCR +3.1/10.0
- Rent growth +2.7/5.0
- Condition / age +2.5/5.0
- Appreciation +0.0/10.0
$329,900
🖨 Deal sheet 📄 Offer letter ✓ Due diligence
Listing remarks
* BEST OFFERS by 6PM (Tuesday) 5/12 * Welcome to 128 Wilson Ave in Newington - a thoughtfully updated home that feels easy to step into and even easier to settle into, featuring a brand new roof (2026), renovated kitchen and new flooring throughout that create a clean, fresh feel from the moment you walk in; the layout offers true one-level living with a natural flow for everyday life, complemented by two separate living spaces including a versatile bonus room perfect for a family room, media space or whatever fits your lifestyle, while the attached garage adds that everyday convenience buyers love; downstairs, a second full bathroom and a lower level full of opportunity give you the flexi
Key facts
- 7,840 sq ft lot
- Garage
- Built 1955
Property features AI
Exterior
- Parking: Attached garage (1-car)
- Utilities: Public water connected; Public sewer connected
- Home design: Single-family home
- Construction: Frame construction; Vinyl siding; Asphalt shingle roof; Concrete foundation; Tan exterior color
- Exterior features: Cleared lot; Breezeway; Shed; Gutters
Interior
- Kitchen: Oven/Range; Refrigerator; Dishwasher
- Bedrooms: Three bedrooms
- Bathrooms: One full bathroom
- Heating & cooling: Hot water heat (oil-fired); Oil tank located in the basement; Domestic hot water
- Interior features: Six total rooms; Two fireplaces; Full basement with interior access, partially finished areas, sump pump and full hatchway; Attic with walk-up access and storage space
- Laundry & utility: Laundry room on the lower level
Neighborhood map
What this means for you Summary
Snapshot
- This is a 3-bed/1.0-bath single-family listed at $330k.
Deal economics
- At list price, monthly cash flow is $-161 ($-2k/yr) — negative.
- To cash-flow at today's rent, offer at most $301k (8.6% below list).
- To meet the 1% rule (rent ≥ 1% of price), the offer needs to be $273k (17.3% below list).
- Recommended offer: $273k (17.3% below list) — sets the bar for 1% rule.
- Cap rate 5.7% vs local median 4.4% in Newington — top-decile yield for the area; either an underpriced asset or a hidden risk that comps aren't pricing in. Stress-test before assuming the spread holds.
Location & tenants
- Location reads 79/100 on livability (#30 in CT, #2,143 nationally) — a middle-class / working-renter tenant base. Strengths: employment A+, housing A+, health & safety A+; Watch: amenities F, commute F.
- Newington School District (suburban): math 38% / reading 53% proficiency, ranked #87 of 153 in CT (top 57%) — families likely to look elsewhere, expect single-tenant / working-renter base with shorter leases; only 15% free/reduced lunch — higher-income household profile.
- Market conditions: Rents flat; 94 active listings in the ZIP; 12 comparable units currently listed for rent nearby; rentals at typical pace (median 24d on market — plan ~3-4 weeks tenant-placement turnaround); 42% of comp listings sitting > 30 days — soft ceiling on asking rent; solid renter incomes; 1,867 units permitted in Capitol Planning Region in 2024 (1,399 in 5+ unit buildings).
- This rent runs 32% of the median local income ($103k/yr) — at the standard rent-burdened threshold; future hikes will face affordability resistance.
Forward outlook
- Local home prices are declining (-3.0%/yr); year-one equity from $2k of loan paydown is wiped out by about $10k of value loss. Plan a longer hold.
Negotiation context
- Only 5 days on market — expect competitive offers; lowballing is unlikely to land.
Risks & watch-outs
- Watch-outs: built in 1955 — expect roof / HVAC / electrical / plumbing capex.
- Climate carrying-cost: major wind risk, 27% chance of damaging wind over 30y; extreme-heat days projected 7→16/yr by 2055 (HVAC capex compounding) — expect insurance premiums to compound above CPI over the hold.
Questions for the listing agent
- What do current leases actually rent for vs. the listed asking? Can we see a recent rent roll and the last 12 months of T-12 income?
- Built in 1955 — when were the roof, HVAC, electrical panel, plumbing, and water heater last replaced?
- Is there a deadline driving the sale (1031 exchange, divorce, estate, relocation)? That informs how much negotiation room exists.
- The area grade is low — what's the realistic commute time and amenity access for the typical tenant pool here? Any planned neighborhood developments (good or bad) we should know about?
- What's the average days-on-market for RENTAL listings here right now (not sales)? A rising rental-DOM trend means longer vacancies and softer asking-rent achievability than the comps imply.
- What's the recent tenant-quality profile in this submarket — average credit score on applications, eviction rate, late-payment / NSF rate, and stable-employment percentage? A property-management company in the area should have these aggregated.
- How much new for-sale + rental construction is in the pipeline within 1–3 miles? Heavy new supply typically softens prices + rents 12–24 months out; constrained supply supports both.
Investment metrics
- 1% rule
- 0.83% ✗
- Cap rate
- 5.71%
- Cash-on-cash
- -2.09%
- DSCR
- 0.91
- GRM
- 10.1
CMA / ARV
- ARV (median comp)
- $358,683
- List price
- $329,900
- Delta
- -8.02%
- Verdict
- FAIR
- Comps
- 20 within 1.0 mi
Show comp detail 12 sales within ~0.75 mi
| Address | Dist | Beds/Ba | Sqft | Sold | Price | $/sf | Match |
|---|---|---|---|---|---|---|---|
| 128 Wilson Ave | 0.00mi | 3/1.0 | 1,286 (0%) | 0mo | $367,500 | $286 | 100 |
| 282 Hillcrest Ave | 0.20mi | 3/2.0 | 1,236 (-4%) | 5mo | $420,000 | $340 | 76 |
| 36 Hartt Ln | 0.42mi | 3/2.0 | 1,305 (+2%) | 7mo | $405,000 | $310 | 68 |
| 76 Clifford St | 0.62mi | 3/1.0 | 1,334 (+4%) | 7mo | $390,000 | $292 | 59 |
| 176 Cambria Ave | 0.19mi | 3/2.5 | 1,456 (+13%) | 10mo | $382,000 | $262 | 55 |
| 17 Whiteside St | 0.62mi | 4/1.0 (+1) | 1,380 (+7%) | 2mo | $409,000 | $296 | 52 |
| 21 Walnut St | 0.75mi | 3/2.0 | 1,299 (+1%) | 10mo | $455,000 | $350 | 51 |
| 40 Pine St | 0.74mi | 3/1.5 | 1,392 (+8%) | 0mo | $427,500 | $307 | 49 |
| 320 Cedar St | 0.68mi | 3/1.5 | 1,192 (-7%) | 8mo | $335,000 | $281 | 47 |
| 44 Pine St | 0.73mi | 3/2.0 | 1,346 (+5%) | 9mo | $382,000 | $284 | 47 |
| 57 Welles Dr | 0.61mi | 3/2.0 | 1,408 (+10%) | 7mo | $400,000 | $284 | 46 |
| 32 Flagler St | 0.60mi | 3/2.0 | 1,116 (-13%) | 4mo | $305,000 | $273 | 43 |
Match score weights: distance 35% · size 25% · config 20% · recency 20%. Top-matched comps best support the ARV.
Projected returns pro-forma
-3.0% appreciation · 0.98% rent growth · sell at horizon
- IRR
- -22.1%
- Equity multiple
- 0.25×
- Total profit
- $-69,100
- Equity at exit
- $49,189
- IRR
- -22.0%
- Equity multiple
- -0.02×
- Total profit
- $-94,555
- Equity at exit
- $28,524
Cash invested: $92,372 (down + closing). Projections, not guarantees.
Landlord ↔ Tenant lean methodology
- Overall (STATE)
- 27 Tenant-Leaning
- State Connecticut
- 27 Tenant-Leaning · D+7
- County
- — inherits STATE
- City
- — inherits STATE
ZIP-level market 06111
- Rents YoY
- 1.0%
- Active inventory
- 94
- Price-to-rent
- 10.1×
Monthly cashflow live
- Estimated rent
- $2,728 high interval (Pro) →
- Mortgage (P&I)
- −$1,730
- Tax from tax record
- −$449 /mo · $5,387/yr
- Insurance
- −$137
- HOA
- −$0
- Vacancy / Maint / Mgmt
- −$573
- Net cashflow
- $-161
Break-even live
UW: 25.0% down · 7.5% · 30yr · 1.5% tax · 5.0% vac · 8.0% maint · 8.0% mgmt
Financing live
Cash to close
- Down payment
- $82,475
- Closing costs
- $9,897
- Reserves months
- —
- Total cash needed
- —
Loan-product check · same deal, 3 products live
Conventional
25% down · 7.5% · 30yr
- Down + closing
- —
- Monthly P&I
- —
- Monthly cashflow
- —
- DSCR
- —
- Eligible?
- —
Personal DTI + credit; lowest rate.
DSCR
20% down · 8.5% · 30yr
- Down + closing
- —
- Monthly P&I
- —
- Monthly cashflow
- —
- DSCR
- —
- Eligible?
- —
No personal income docs; deal must DSCR.
Hard money
10% down · 12.0% · 12mo
- Down + closing
- —
- Monthly P&I
- —
- Monthly cashflow
- —
- DSCR
- —
- Eligible?
- —
Short-term bridge; refi at stabilization.
Rent comps 12 comps
| Address | Beds | Baths | Sqft | Rent | $/sqft | DOM | Units | Dist |
|---|---|---|---|---|---|---|---|---|
| 62 Brookdale Ave Newington, CT | 3.0 | 1.0 | 1508 | $2,900 | $1.92 | 23d | 1 | 0.08mi |
| 92 Indian Hill Rd Newington, CT | 3.0 | 1.0 | 1250 | $2,800 | $2.24 | 43d | 1 | 0.50mi |
| 215 Lowrey Pl Newington, CT | 1.0–2.0 | 1.0 | 835 | $2,195 | $2.63 | 1d | 1 | 0.67mi |
| 1435 Willard Ave Newington, CT | 1.0–2.0 | 1.0–1.5 | 950 | $2,000 | $2.11 | 1d | 1 | 1.18mi |
| 1439 Willard Ave Newington, CT | 2.0 | 1.5 | 900 | $1,950 | $2.17 | 43d | 1 | 1.21mi |
| 429 New Britain Ave Unit 2nd Floor Newington, CT | 3.0 | 1.0 | 1000 | $1,750 | $1.75 | 43d | 1 | 1.29mi |
| 95 Woodsedge Dr Unit 3C Newington, CT | 2.0 | 1.0 | 988 | $1,600 | $1.62 | 11d | 1 | 1.34mi |
| 448 Cypress Rd #448 Newington, CT | 2.0 | 1.5 | 1830 | $2,700 | $1.48 | 1d | 1 | 1.38mi |
| 154 Harding Ave Newington, CT | 3.0 | 2.0 | 1747 | $3,000 | $1.72 | 23d | 1 | 1.40mi |
| 310 Connecticut Ave Newington, CT | 3.0 | 2.0 | 1144 | $2,400 | $2.10 | 2d | 1 | 1.43mi |
| 15 Woodsedge Dr Unit 3B Newington, CT | 2.0 | 1.0 | 948 | $1,800 | $1.90 | 43d | 1 | 1.44mi |
| 21 Monte Vista Ave Newington, CT | 2.0 | 2.5 | 1068 | $1,800 | $1.69 | 43d | 1 | 1.48mi |
Listing history 4 events
-
2026-05-13status Under Contract 1098-char remark
-
2026-05-08$329,900 Active 1098-char remark
-
2026-05-05historical $329,900 1098-char remark
-
2025-12-18soldstatus $200,000
ⓘ Source: listings_history table (triggers on properties + properties_extension) + one-shot
backfill from property_details.listing_events for pre-trigger history.
Tax reassessment forecast CT · Partial reset (capped growth)
- Current annual tax
- $5,387 · $449/mo
- Projected year-2 tax
- $6,223 · $519/mo
- Expected delta
- +$836/yr (+$70/mo · 15.5%)
ⓘ Screening estimate from a state-policy table — verify with the county assessor before closing.
Climate risk First Street
- Flood 1/10 Low FEMA zone X (unshaded) · 0% chance over 30 yrs
- Wildfire 1/10 Low
- Heat 5/10 Major 7 d/yr ≥97°F today · 16 d/yr by 30 yrs out
- Wind 6/10 Major 27% chance of damaging wind over 30 yrs
- Air quality 3/10 Moderate 3 unhealthy d/yr today · 4 by 30 yrs out
Nearby sold comps map
Loading sold comps map…
Walkable amenities ~0.75 mi
Loading nearby amenities…
Taxation est. · year 1
- Rental income
- $32,736
- − Mortgage interest
- −$18,480
- − Property taxes
- −$5,387
- − Insurance
- −$1,650
- − Repairs & maintenance
- −$2,619
- − Management
- −$2,619
- − Depreciation
- −$9,597
- Taxable loss
- −$7,614
- Est. tax savings @ 24.0%
- +$1,827
- After-tax cash flow
- $-108/yr
For passive investors: Depreciation is non-cash, so a rental often shows a tax loss while cash-flowing — sheltering income. Rental losses are passive: they offset passive income freely, and up to $25,000/yr can offset ordinary (W-2) income if you actively participate and your MAGI is under $100k (phasing out to $0 by $150k); unused losses carry forward. On sale, claimed depreciation is recaptured at up to 25%, and gains may owe capital-gains tax (a 1031 exchange can defer both). Figures are a year-1 estimate at your 24.0% rate — not tax advice; consult a CPA.
Schools (NCES district)
- District
- Newington School District
- NCES district ID
- 0902880
- Math proficiency
- 38% ▼ -14.00%
- Reading proficiency
- 53% ▼ -6.00%
- Median HH income
- $74,751
- Composite
- 41.37/100
- National rank
- #3489
- State rank
- #87 of 153 in CT
Livability — Newington
- Score
- 79/100
- State rank
- #30
- US rank
- #2143
Category grades
Schools grade is shown separately in the Schools card above.
Census & demographics
- Census place
- Newington, CT
- County
- Hartford County · 754,208 people
- City population
- 30,896
- Metro
- Hartford-East Hartford-Middletown, CT
- Population (ZIP)
- 30,896
- Household income
- $102,884
- Rent vs Own
- Severe rent burden
- 553.0
Population outlook (Capitol County) Hauer SSP2
- By 2040
- 1,063,519
Race, ethnicity, and origin ACS 2023
- Neighborhood character
- Predominantly White (72%)
- Race & ethnicity
- White 72% Hispanic / Latino 12% Two or more races 8% Asian 7% Black 4%
- Hispanic origin (detail)
- Mexican 1% Puerto Rican 5%
- Common ancestry
- Romanian 12% Lithuanian 7% Russian 3%
- Foreign-born
- 20% · Canada, Jamaica, China
- Languages at home
- 72% English-only · Spanish 8% Other Indo-European 8% Russian/Polish/Slavic 7%
Political lean MEDSL · Capitol
- 2024 margin
- Strong D (+21.9) · D 60.1% · R 38.2% · Other 1.7%
- All cycles
- 2024: D+21.9
Not yet ingested
- Civics
- —
Market trends
- HPI YoY
- ▼ -194.94%
- Current HPI
- 185.3332
- Rent YoY
- ▲ 0.98%
- Metro
- Hartford-East Hartford-Middletown, CT
- State GDP YoY
- ▲ 1.06%
- F500 in state
- 38
Industry mix (Fortune 500 HQ in CT)
| Industry | F500 HQs | Revenue |
|---|---|---|
| Industrial Machinery | 4 | $38B |
|
||
| Insurance | 3 | $71B |
|
||
| Financial Services | 2 | $25B |
|
||
| Transportation / Logistics | 2 | $18B |
|
||
| Healthcare | 1 | $247B |
|
||
| Telecommunications | 1 | $55B |
|
||
Price history
+83.8% since first listed5 events — show timeline
- 2026-06-12 Sold (MLS) $367,500 Smart MLS
- 2026-05-13 Pending — Smart MLS
- 2026-05-08 Listed $329,900 Smart MLS
- 2026-05-05 Coming Soon $329,900 Smart MLS
- 2025-12-18 Sold (Public Records) $200,000 Public Records
Property tax history
+1.8%/yrLatest (2025): $5,387 · +0.8% YoY. Source: county tax records.
Cash-flow waterfall
monthlySold comps — $/sqft
last 12 mo · ≤1 miLoading sold comps…