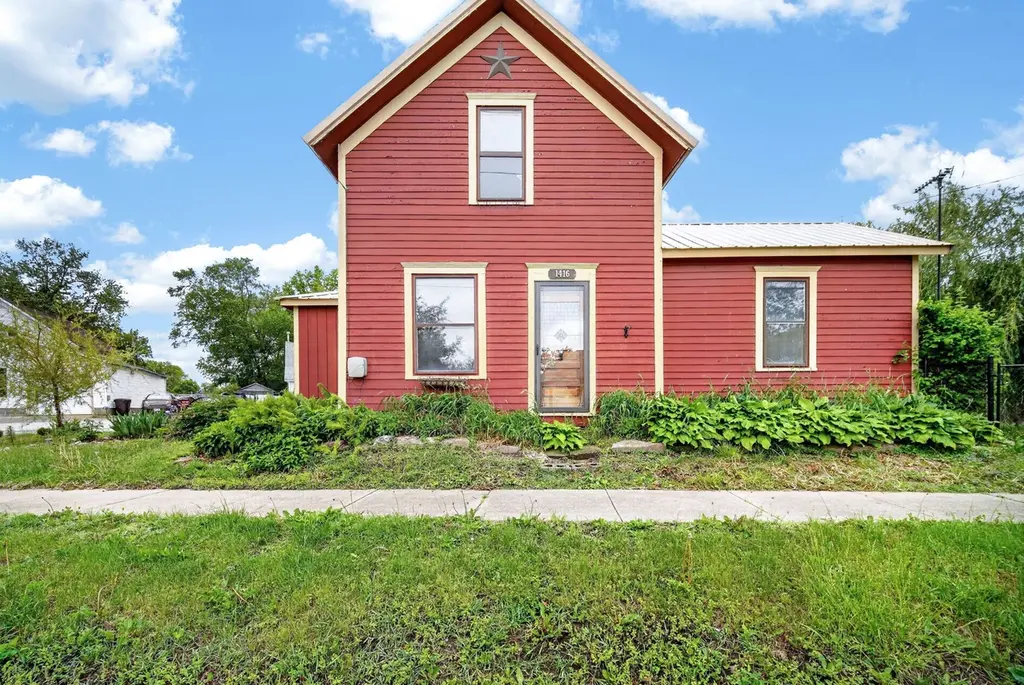
1416 Osceola Avenue Ave · Chariton, IA
Flood risk 1/10 · Minimal
- FEMA flood zone
- X (unshaded)
- Chance of flooding over 30 yrs
- 0.0%
- Est. flood insurance / yr
- $473 – $860
Fire risk 5/10 · Moderate
- Est. fire insurance / yr
- $902 – $1,676
Heat risk 3/10 · Minor
- Hot days now (above 104°F)
- 7 days/yr
- Hot days in 30 yrs
- 15 days/yr
Wind risk 2/10 · Minimal
- Chance of severe wind over 30 yrs
- —
Air-quality risk 2/10 · Minimal
- Unhealthy air days now
- 1 days/yr
- Unhealthy air days in 30 yrs
- 2 days/yr
Risk factors via First Street. Map © Google.
Why this score? — see what drove the B grade
The composite is a weighted blend of 9 inputs, each scored 0–100. Each bar is that input's sub-score; the figure is the points it added to the 100-point composite (weight × sub-score).
- Cash flow +30.0/30.0
- 1% rule +10.0/10.0
- DSCR +10.0/10.0
- ARV discount +7.5/15.0
- Schools +5.1/10.0
- Livability +4.0/5.0
- Rent growth +2.5/5.0
- Condition / age +2.5/5.0
- Appreciation +0.0/10.0
$49,000
🖨 Deal sheet (PDF) 📄 Offer letter ✓ Due diligence
Listing remarks
Charming 1.5-story single-family home situated on a spacious corner lot in Chariton offering character, flexible living space, and excellent potential. Built in 1900, this home offers approximately 1,567 square feet with 3 bedrooms and 1 full bathroom, including a main-level primary bedroom and two upper-level rooms. The large living room provides ample space for gathering and natural light, while the eat-in kitchen features generous cabinet space, open shelving, and room for dining. Main-level laundry adds everyday convenience. Outside, the property features mature landscaping, garden areas, fenced sections of yard space, and a detached garage/outbuilding providing additional storage or wo
Key facts
- Fenced sections
- Main-level laundry
- Mature landscaping
Tags
Property features AI
Exterior
- Parking: Detached one-car garage
- Utilities: Public water; Public sewer
- Home design: Single-family property (residential zoning); Metal roof; Wood siding
- Construction: Wood siding construction
Interior
- Bedrooms: 1 main-level bedroom
- Bathrooms: 1 full bathroom
- Heating & cooling: Central air conditioning; Forced air heating (natural gas)
- Interior features: Unfinished basement
Neighborhood map
What this means for you Summary
Snapshot
- This is a 3-bed/1.0-bath single-family listed at $49k.
Deal economics
- At list price, monthly cash flow is $606 ($7k/yr) — positive.
- The deal already cash-flows at list — no discount required.
- Meets the 1% rule at list price ($1k rent vs $49k).
- Recommended offer: $48k (3.0% below list) — sets the bar for market timing.
- Cap rate 21.1% vs local median 4.4% in Chariton — top-decile yield for the area; either an underpriced asset or a hidden risk that comps aren't pricing in. Stress-test before assuming the spread holds.
Location & tenants
- Location reads 80/100 on livability (#84 in IA, #1,703 nationally) — a professional / high-income tenant draw. Strengths: cost of living A+, housing A+, health & safety A+; Watch: employment C-, amenities F, commute F.
- Chariton Community School District (town): math 57% / reading 65% proficiency, ranked #241 of 289 in IA (top 83%) — acceptable for families but not a draw, mixed tenant base, ~2y average lease.
- Zoned schools: Columbus Elementary School (284 students, 58% FRL); Chariton Middle School (math 63% / reading 70%, grade A-, #148 of 246 statewide, top 61%, 285 students, 56% FRL); Chariton High School (math 57% / reading 73%, grade B, #208 of 336 statewide, top 62%, 392 students, 50% FRL).
- Market conditions: 82 active listings in the ZIP; 3 units permitted in Lucas County in 2024 (0 in 5+ unit buildings).
Forward outlook
- Local home prices are declining (-3.0%/yr); year-one equity from $339 of loan paydown is wiped out by about $1k of value loss. Plan a longer hold.
- Lucas County population projected at -23% by 2050 — secular population decline; favor cash flow + early exit over multi-decade hold.
- At projected returns (-3.0% appreciation + 3.0% rent growth), your $14k cash investment doubles in ~3 years — after that, you're playing with house money.
Negotiation context
- It's been on market 32 days — a 3% lower offer ($48k) is reasonable based on typical stale-listing flexibility.
- 2 sale attempts with the ask held roughly flat each time — persistent listings suggest the price (not the market) is what's stuck; bring a comps-based counter.
- Current owner paid $13k; list at $49k implies a 277% gain — meaningful room to come down on a strong offer.
Risks & watch-outs
- Watch-outs: property tax is 3.7% of price; built in 1900 — expect roof / HVAC / electrical / plumbing capex.
- Climate carrying-cost: moderate wildfire risk — expect insurance premiums to compound above CPI over the hold.
Questions for the listing agent
- It's been on market 32 days. Have you received any prior offers? Is the seller open to a 3% concession, seller financing, or rate buy-down credit?
- Built in 1900 — when were the roof, HVAC, electrical panel, plumbing, and water heater last replaced?
- Property tax is high relative to price — has the assessment been appealed recently, and will the sale trigger a re-assessment?
- Is there a deadline driving the sale (1031 exchange, divorce, estate, relocation)? That informs how much negotiation room exists.
- Schools are A-rated — typically a magnet for longer-tenancy family renters. What's the average tenant stay here, and is there a school-zone premium baked into asking?
- What's the average days-on-market for RENTAL listings here right now (not sales)? A rising rental-DOM trend means longer vacancies and softer asking-rent achievability than the comps imply.
- What's the recent tenant-quality profile in this submarket — average credit score on applications, eviction rate, late-payment / NSF rate, and stable-employment percentage? A property-management company in the area should have these aggregated.
- How much new for-sale + rental construction is in the pipeline within 1–3 miles? Heavy new supply typically softens prices + rents 12–24 months out; constrained supply supports both.
Investment metrics
- 1% rule
- 2.67% ✓
- Cap rate
- 21.13%
- Cash-on-cash
- 52.97%
- DSCR
- 3.36
- GRM
- 3.1
CMA / ARV
- ARV (on-the-fly)
- $186,473
- Comps found
- 12
Show comp detail 12 sales within ~0.75 mi
| Address | Dist | Beds/Ba | Sqft | Sold | Price | $/sf | Match |
|---|---|---|---|---|---|---|---|
| 1219 Braden Ave | 0.28mi | 3/1.0 | 1,557 (-1%) | 7mo | $175,000 | $112 | 80 |
| 1344 Braden Ave | 0.26mi | 3/2.0 | 1,500 (-4%) | 4mo | $170,000 | $113 | 73 |
| 1019 Ilion Ave | 0.55mi | 3/2.0 | 1,616 (+3%) | 1mo | $200,000 | $124 | 64 |
| 520 N 8th St | 0.54mi | 2/1.0 (-1) | 1,397 (-11%) | 0mo | $178,000 | $127 | 51 |
| 302 S Grand St | 0.67mi | 3/1.0 | 1,680 (+7%) | 8mo | $20,000 | $12 | 50 |
| 1223 Park Ave | 0.24mi | 4/2.0 (+1) | 1,780 (+14%) | 12mo | $190,000 | $107 | 47 |
| 1405 Woodlawn Ave | 0.55mi | 3/1.5 | 1,728 (+10%) | 16mo | $127,000 | $73 | 42 |
| 1102 N 17th St | 0.54mi | 4/2.5 (+1) | 1,391 (-11%) | 6mo | $315,000 | $226 | 40 |
| 710 N 6th St | 0.75mi | 3/2.0 | 1,668 (+6%) | 14mo | $250,000 | $150 | 39 |
| 1106 Woodlawn Ave | 0.63mi | 3/3.0 | 1,456 (-7%) | 15mo | $445,000 | $306 | 38 |
| 1219 N 12th St | 0.60mi | 3/3.0 | 1,724 (+10%) | 12mo | $205,000 | $119 | 37 |
| 920 N Grand St | 0.61mi | 3/2.0 | 1,341 (-14%) | 15mo | $142,000 | $106 | 31 |
Match score weights: distance 35% · size 25% · config 20% · recency 20%. Top-matched comps best support the ARV.
Projected returns pro-forma
-3.0% appreciation · 3.0% rent growth · sell at horizon
- IRR
- 51.1%
- Equity multiple
- 3.24×
- Total profit
- $30,710
- Equity at exit
- $7,306
- IRR
- 56.5%
- Equity multiple
- 6.59×
- Total profit
- $76,714
- Equity at exit
- $4,237
Cash invested: $13,720 (down + closing). Projections, not guarantees.
Landlord ↔ Tenant lean methodology
- Overall (STATE)
- 83 Strongly Landlord-Friendly
- State Iowa
- 83 Strongly Landlord-Friendly · R+6
- County
- — inherits STATE
- City
- — inherits STATE
ZIP-level market 50049
- Home prices YoY
- -4.4%
- Active inventory
- 82
- Price-to-rent
- 3.1×
Monthly cashflow live
- Estimated rent
- $1,307 medium interval (Pro) →
- Mortgage (P&I)
- −$257
- Tax from tax record
- −$149 /mo · $1,792/yr
- Insurance
- −$20
- HOA
- −$0
- Lot rent
- −$0
- Vacancy / Maint / Mgmt
- −$274
- Net cashflow
- $606
Break-even live
Sensitivity live
| Price | -10% $633 | -5% $620 | +0% $606 | +5% $592 | +10% $578 |
|---|---|---|---|---|---|
| Rent | -10% $502 | -5% $554 | +0% $606 | +5% $657 | +10% $709 |
| Rate | -1.0pp $630 | -0.5pp $618 | base $606 | +0.5pp $593 | +1.0pp $580 |
UW: 25.0% down · 7.5% · 30yr · 1.5% tax · 5.0% vac · 8.0% maint · 8.0% mgmt
Financing live
Cash to close
- Down payment
- $12,250
- Closing costs
- $1,470
- Reserves months
- —
- Total cash needed
- —
Loan-product check · same deal, 3 products live
Conventional
25% down · 7.5% · 30yr
- Down + closing
- —
- Monthly P&I
- —
- Monthly cashflow
- —
- DSCR
- —
- Eligible?
- —
Personal DTI + credit; lowest rate.
DSCR
20% down · 8.5% · 30yr
- Down + closing
- —
- Monthly P&I
- —
- Monthly cashflow
- —
- DSCR
- —
- Eligible?
- —
No personal income docs; deal must DSCR.
Hard money
10% down · 12.0% · 12mo
- Down + closing
- —
- Monthly P&I
- —
- Monthly cashflow
- —
- DSCR
- —
- Eligible?
- —
Short-term bridge; refi at stabilization.
Listing history 25 events
-
2026-06-22days on market $49,000 Active 32 DOM
-
2026-06-21days on market $49,000 Active 31 DOM
-
2026-06-21days on market $49,000 Active 30 DOM
-
2026-06-18days on market $49,000 Active 28 DOM
-
2026-06-17days on market $49,000 Active 27 DOM
-
2026-06-16days on market $49,000 Active 26 DOM
-
2026-06-15days on market $49,000 Active 25 DOM
-
2026-06-13days on market $49,000 Active 23 DOM
-
2026-06-12days on market $49,000 Active 22 DOM
-
2026-06-09days on market $49,000 Active 19 DOM
-
2026-06-08days on market $49,000 Active 18 DOM
-
2026-06-07days on market $49,000 Active 17 DOM
-
2026-06-07days on market $49,000 Active 16 DOM
-
2026-06-04days on market $49,000 Active 13 DOM
-
2026-06-02days on market $49,000 Active 12 DOM
-
2026-06-01days on market $49,000 Active 11 DOM
-
2026-05-31days on market $49,000 Active 10 DOM
-
2026-05-31days on market $49,000 Active 9 DOM
-
2026-05-21$49,000 Active
-
2026-04-23historical
-
2026-03-23price $65,000
-
2026-02-12price $70,000
-
2026-01-12price $75,000
-
2025-11-25$80,000 Active
-
2018-10-26soldstatus $13,000
ⓘ Source: listings_history table (triggers on properties + properties_extension) + one-shot
backfill from property_details.listing_events for pre-trigger history.
Tax reassessment forecast IA · Partial reset (capped growth)
- Current annual tax
- $1,792 · $149/mo
- Projected year-2 tax
- $1,792 · $149/mo
- Expected delta
- $0/yr ($0/mo · 0.0%)
ⓘ Screening estimate from a state-policy table — verify with the county assessor before closing.
Climate risk First Street
- Flood 1/10 Low FEMA zone X (unshaded) · 0% chance over 30 yrs
- Wildfire 5/10 Major
- Heat 3/10 Moderate 7 d/yr ≥104°F today · 15 d/yr by 30 yrs out
- Wind 2/10 Low
- Air quality 2/10 Low 1 unhealthy d/yr today · 2 by 30 yrs out
Nearby sold comps map
Loading sold comps map…
Walkable amenities ~0.75 mi
Loading nearby amenities…
Taxation est. · year 1
- Rental income
- $15,682
- − Mortgage interest
- −$2,745
- − Property taxes
- −$1,792
- − Insurance
- −$245
- − Repairs & maintenance
- −$1,255
- − Management
- −$1,255
- − Depreciation
- −$1,425
- Taxable income
- $6,966
- Est. tax owed @ 24.0%
- −$1,672
- After-tax cash flow
- $5,596/yr
For passive investors: Depreciation is non-cash, so a rental often shows a tax loss while cash-flowing — sheltering income. Rental losses are passive: they offset passive income freely, and up to $25,000/yr can offset ordinary (W-2) income if you actively participate and your MAGI is under $100k (phasing out to $0 by $150k); unused losses carry forward. On sale, claimed depreciation is recaptured at up to 25%, and gains may owe capital-gains tax (a 1031 exchange can defer both). Figures are a year-1 estimate at your 24.0% rate — not tax advice; consult a CPA.
Schools (NCES district)
- District
- Chariton Community School District
- NCES district ID
- 1907050
- Math proficiency
- 57% ▼ -11.00%
- Reading proficiency
- 65% ▼ -6.00%
- Median HH income
- $44,415
- Composite
- 51.35/100
- National rank
- #1738
- State rank
- #241 of 289 in IA
Livability — Chariton
- Score
- 80/100
- State rank
- #84
- US rank
- #1703
Category grades
Schools grade is shown separately in the Schools card above.
Census & demographics
- Census place
- Chariton, IA
- Population (ZIP)
- 6,425
Population outlook (Lucas County) Hauer SSP2
- Today (2025)
- 8,106 people
- By 2030
- 7,755 · -4.3%
- By 2040
- 7,007 · -13.6%
- By 2050
- 6,265 · -22.7%
- By 2075
- 4,926 · -39.2%
- By 2100
- 3,792 · -53.2%
Race, ethnicity, and origin ACS 2023
- Neighborhood character
- Predominantly White (95%)
- Race & ethnicity
- White 95% Two or more races 3% Hispanic / Latino 2% Asian 1%
- Common ancestry
- Iranian 3% Italian 2% Slovak 2%
- Foreign-born
- 2% · Canada
- Languages at home
- 95% English-only · German/W. Germanic 2% Spanish 2% Other Asian/Pacific 1%
Political lean MEDSL · Lucas
- 2024 margin
- Solid R (+48.1) · D 25.2% · R 73.3% · Other 1.5%
- 2008→2024 swing
- -41.4pp toward R · 2008: -6.7pp · 2024: -48.1pp
- All cycles
- 2024: R+48.1 2020: R+43.3 2016: R+38.1 2012: R+6.3 2008: R+6.7
Not yet ingested
- Civics
- —
Market trends
- HPI YoY
- ▼ -10.20%
- Current HPI
- 220.0223
- Rent YoY
- —
- Metro
- —
- State GDP YoY
- ▲ 2.48%
- F500 in state
- 4
Industry mix (Fortune 500 HQ in IA)
| Industry | F500 HQs | Revenue |
|---|---|---|
| Financial Services | 1 | $16B |
|
||
| Retail / Convenience | 1 | $15B |
|
||
Price history
+276.9% since first listed7 events — show timeline
- 2026-05-21 Listed $49,000 DMMLS
- 2026-04-23 Listing Removed — DMMLS
- 2026-03-23 Price Changed $65,000 DMMLS
- 2026-02-12 Price Changed $70,000 DMMLS
- 2026-01-12 Price Changed $75,000 DMMLS
- 2025-11-25 Listed $80,000 DMMLS
- 2018-10-26 Sold (Public Records) $13,000 Public Records
Property tax history
+20.6%/yrLatest (2025): $1,792 · +6.2% YoY. Source: county tax records.
Cash-flow waterfall
monthlySold comps — $/sqft
last 12 mo · ≤1 miLoading sold comps…