 Multi-family
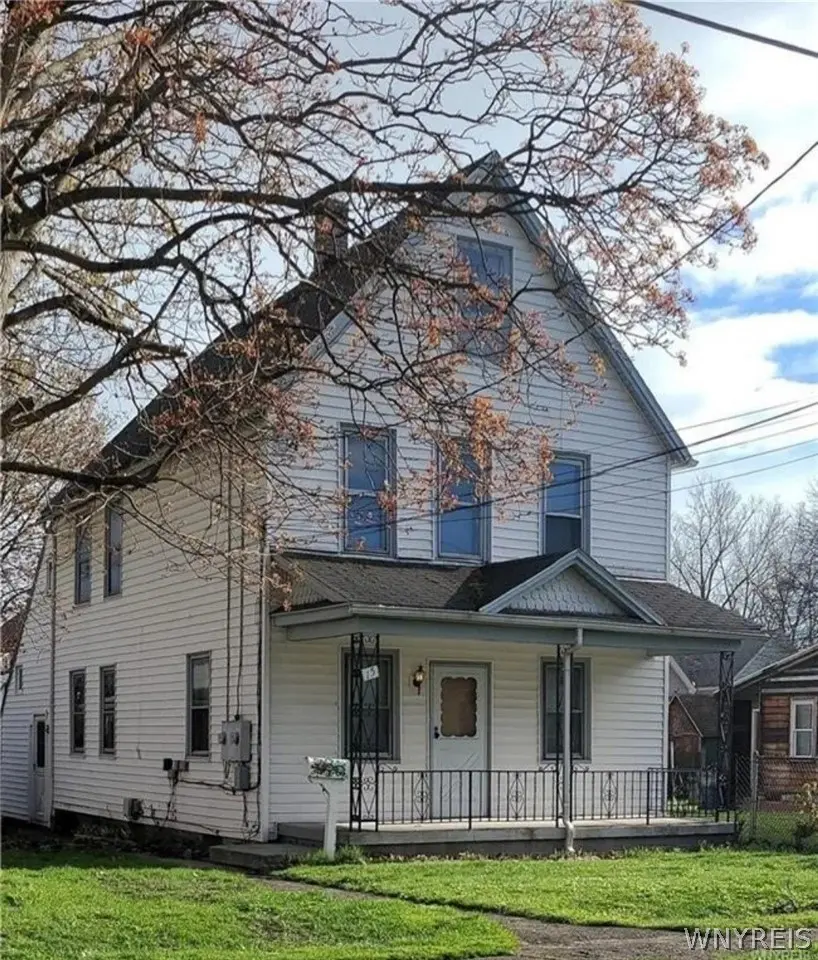
15 Gravel Pl · Lackawanna, NY
Flood risk 1/10 · Minimal
- FEMA flood zone
- X (unshaded)
- Chance of flooding over 30 yrs
- 0.0%
- Est. flood insurance / yr
- $507 – $1,088
Fire risk 2/10 · Minimal
- Est. fire insurance / yr
- $691 – $1,283
Heat risk 3/10 · Minor
- Hot days now (above 92°F)
- 7 days/yr
- Hot days in 30 yrs
- 15 days/yr
Wind risk 1/10 · Minimal
- Chance of severe wind over 30 yrs
- —
Air-quality risk 4/10 · Minor
- Unhealthy air days now
- 3 days/yr
- Unhealthy air days in 30 yrs
- 8 days/yr
Risk factors via First Street. Map © Google.
Why this score? — see what drove the B- grade
The composite is a weighted blend of 9 inputs, each scored 0–100. Each bar is that input's sub-score; the figure is the points it added to the 100-point composite (weight × sub-score).
- Cash flow +30.0/30.0
- 1% rule +10.0/10.0
- DSCR +10.0/10.0
- ARV discount +7.5/15.0
- Livability +3.8/5.0
- Rent growth +2.5/5.0
- Condition / age +2.5/5.0
- Schools +2.0/10.0
- Appreciation +0.0/10.0
$89,000
🖨 Deal sheet (PDF) 📄 Offer letter ✓ Due diligence
Multi-family units
County records classify this as Multi-Family (2-4 Unit). Listing-text estimate: 1 unit. estimate disagrees with records
Listing remarks
Exceptional Investment Opportunity: Ideal for Investors or Owner-Occupied Buyers. Embrace this outstanding chance to acquire a property primed for renovation and updates. The property features a partially finished attic with drywall and electrical provisions, awaiting your creative touch to maximize its utility. Enjoy the convenience of a partially fenced yard, perfect for creating a serene outdoor retreat. Both units are currently vacant and need renovation. This remarkable deal is offered as-is, presenting a blank canvas for your vision and investment goals. Don't miss out on this opportunity to shape a property into a lucrative venture or a cherished home.
Key facts
- Double lot
- 3,150 sq ft lot
- Parking
Tags
Property features AI
Finance
- Other: Two separate gas meters and two separate electric meters indicate individual utility metering for each unit
- Financial info: Operating expenses: see remarks; Owner pays: other (see remarks); Rent includes: see remarks; Multifamily property with 2 total units
Exterior
- Parking: Common parking available; no driveway
- Utilities: Public water connected; Sewer connected
- Home design: Two-story property; Existing resale property; Frame construction
- Construction: Frame construction; Crawl space foundation
- Exterior features: Flag lot; Residential lot; 30 x 105 lot dimensions; City street frontage
Interior
- Kitchen: Kitchen features not specified (see remarks)
- Bedrooms: Two 2-bedroom units
- Flooring: Vinyl flooring; Varies by area/unit
- Bathrooms: Two full bathrooms total (one full bathroom in each unit)
- Heating & cooling: Heating details not specified (see remarks)
- Interior features: Crawl space basement; Varied and vinyl flooring; Formal dining room in one unit; Living room in one unit; Other interior features (see remarks)
- Laundry & utility: Separate gas meters for each unit; Separate electric meters for each unit
Neighborhood map
What this means for you Summary
Snapshot
- This is a 4-bed/2.0-bath multifamily listed at $89k.
Deal economics
- At list price, monthly cash flow is $1k ($15k/yr) — positive.
- The deal already cash-flows at list — no discount required.
- Meets the 1% rule at list price ($2k rent vs $89k).
- Recommended offer: $86k (3.0% below list) — sets the bar for market timing.
- Cap rate 23.0% vs local median 5.4% in Lackawanna — top-decile yield for the area; either an underpriced asset or a hidden risk that comps aren't pricing in. Stress-test before assuming the spread holds.
Location & tenants
- Location reads 75/100 on livability (#254 in NY, #4,026 nationally) — a middle-class / working-renter tenant base. Strengths: commute A+, cost of living A+, housing A+; Watch: crime C-, schools D+, employment D+.
- Lackawanna City School District (suburban): math 19% / reading 29% proficiency, ranked #588 of 590 in NY (top 100%) — low school quality limits family demand, transient renter base, plan for 1-2y turnover; 71% free/reduced lunch — lower-income household profile, screen leases tightly.
- Market conditions: 92 active listings in the ZIP; 1,244 units permitted in Erie County in 2024 (563 in 5+ unit buildings).
Forward outlook
- Local home prices are declining (-3.0%/yr); year-one equity from $615 of loan paydown is wiped out by about $3k of value loss. Plan a longer hold.
- At projected returns (-3.0% appreciation + 3.0% rent growth), your $25k cash investment doubles in ~2 years — after that, you're playing with house money.
Negotiation context
- It's been on market 54 days — a 3% lower offer ($86k) is reasonable based on typical stale-listing flexibility.
- 8 sale attempts since 4y ago with the ask held roughly flat each time — persistent listings suggest the price (not the market) is what's stuck; bring a comps-based counter.
- Current owner paid $73k; 22% above their basis — modest negotiation headroom, anchor on the comps not their cost.
Risks & watch-outs
- Watch-outs: built in 1865 — expect roof / HVAC / electrical / plumbing capex.
Questions for the listing agent
- It's been on market 54 days. Have you received any prior offers? Is the seller open to a 3% concession, seller financing, or rate buy-down credit?
- Built in 1865 — when were the roof, HVAC, electrical panel, plumbing, and water heater last replaced?
- Is there a deadline driving the sale (1031 exchange, divorce, estate, relocation)? That informs how much negotiation room exists.
- Schools are D-rated, which usually means shorter tenancies and higher turnover. Who's the typical renter profile here, and what's been the actual vacancy rate?
- What's the average days-on-market for RENTAL listings here right now (not sales)? A rising rental-DOM trend means longer vacancies and softer asking-rent achievability than the comps imply.
- What's the recent tenant-quality profile in this submarket — average credit score on applications, eviction rate, late-payment / NSF rate, and stable-employment percentage? A property-management company in the area should have these aggregated.
- How much new apartment / multifamily construction is in the pipeline within 1–3 miles? Heavy new supply (>2% of stock underway) typically softens rents 12–24 months out; light construction supports rent growth.
Investment metrics
- 1% rule
- 2.64% ✓
- Cap rate
- 22.96%
- Cash-on-cash
- 59.52%
- DSCR
- 3.65
- GRM
- 3.2
CMA / ARV
- ARV (median comp)
- $246,189
- List price
- $89,000
- Delta
- -63.85%
- Verdict
- UNDERPRICED
- Comps
- 20 within 1.0 mi
Show comp detail 3 sales within ~0.75 mi
| Address | Dist | Beds/Ba | Sqft | Sold | Price | $/sf | Match |
|---|---|---|---|---|---|---|---|
| 11 Fig Ave | 0.23mi | 4/2.0 | 1,960 (+8%) | 2mo | $115,000 | $59 | 75 |
| 1685 Electric Ave | 0.60mi | 3/2.0 (-1) | 1,648 (-10%) | 17mo | $150,000 | $91 | 37 |
| 20 Modern Ave | 0.57mi | 5/2.5 (+1) | 2,072 (+14%) | 12mo | $145,000 | $70 | 34 |
Match score weights: distance 35% · size 25% · config 20% · recency 20%. Top-matched comps best support the ARV.
Projected returns pro-forma
-3.0% appreciation · 3.0% rent growth · sell at horizon
- IRR
- 58.2%
- Equity multiple
- 3.58×
- Total profit
- $64,346
- Equity at exit
- $13,270
- IRR
- 63.0%
- Equity multiple
- 7.32×
- Total profit
- $157,570
- Equity at exit
- $7,695
Cash invested: $24,920 (down + closing). Projections, not guarantees.
Landlord ↔ Tenant lean methodology
- Overall (STATE)
- 15 Strongly Tenant-Friendly
- State New York
- 15 Strongly Tenant-Friendly · D+10
- County
- — inherits STATE
- City
- — inherits STATE
ZIP-level market 14218
- Home prices YoY
- -9.2%
- Active inventory
- 92
- Price-to-rent
- 6.3×
Monthly cashflow live
- Estimated rent
- $2,353 medium interval (Pro) →
- Mortgage (P&I)
- −$467
- Tax from tax record
- −$119 /mo · $1,428/yr
- Insurance
- −$37
- HOA
- −$0
- Vacancy / Maint / Mgmt
- −$494
- Net cashflow
- $1,236
Break-even live
Sensitivity live
| Price | -10% $1,286 | -5% $1,261 | +0% $1,236 | +5% $1,211 | +10% $1,186 |
|---|---|---|---|---|---|
| Rent | -10% $1,050 | -5% $1,143 | +0% $1,236 | +5% $1,329 | +10% $1,422 |
| Rate | -1.0pp $1,281 | -0.5pp $1,259 | base $1,236 | +0.5pp $1,213 | +1.0pp $1,190 |
2-unit breakdown (identical units grouped — click to expand)
| Units | Beds | Baths | Est. rent |
|---|---|---|---|
| 2× units | 2 | 1 | $2,354 |
| #1 | 2 | 1 | $1,177 |
| #2 | 2 | 1 | $1,177 |
| Total (2 units) | $2,353 | ||
UW: 25.0% down · 7.5% · 30yr · 1.5% tax · 5.0% vac · 8.0% maint · 8.0% mgmt
Financing live
Cash to close
- Down payment
- $22,250
- Closing costs
- $2,670
- Reserves months
- —
- Total cash needed
- —
Loan-product check · same deal, 3 products live
Conventional
25% down · 7.5% · 30yr
- Down + closing
- —
- Monthly P&I
- —
- Monthly cashflow
- —
- DSCR
- —
- Eligible?
- —
Personal DTI + credit; lowest rate.
DSCR
20% down · 8.5% · 30yr
- Down + closing
- —
- Monthly P&I
- —
- Monthly cashflow
- —
- DSCR
- —
- Eligible?
- —
No personal income docs; deal must DSCR.
Hard money
10% down · 12.0% · 12mo
- Down + closing
- —
- Monthly P&I
- —
- Monthly cashflow
- —
- DSCR
- —
- Eligible?
- —
Short-term bridge; refi at stabilization.
Listing history 37 events
-
2026-06-21days on market $89,000 Active 54 DOM
-
2026-06-18days on market $89,000 Active 51 DOM
-
2026-06-17days on market $89,000 Active 50 DOM
-
2026-06-16days on market $89,000 Active 49 DOM
-
2026-06-15days on market $89,000 Active 48 DOM
-
2026-06-13days on market $89,000 Active 46 DOM
-
2026-06-10days on market $89,000 Active 43 DOM
-
2026-06-09days on market $89,000 Active 42 DOM
-
2026-06-08days on market $89,000 Active 41 DOM
-
2026-06-07days on market $89,000 Active 40 DOM
-
2026-06-05days on market $89,000 Active 37 DOM
-
2026-06-03days on market $89,000 Active 36 DOM
-
2026-06-02days on market $89,000 Active 35 DOM
-
2026-06-01days on market $89,000 Active 34 DOM
-
2026-05-31days on market $89,000 Active 33 DOM
-
2026-04-28$89,000 Active 667-char remark
-
2025-12-31historical
-
2025-10-22price $111,000
-
2025-06-13$129,727 Active
-
2025-05-31historical
-
2025-03-21price $129,000
-
2025-03-18status Active
-
2024-11-04price $107,000
-
2024-07-24$115,000 Active
-
2024-01-31historical
-
2023-11-12price $109,000
-
2023-11-12status Active
-
2023-09-25historical
-
2023-08-25$125,000 Active
-
2023-07-30historical
-
2023-05-03$115,000 Active
-
2023-03-10soldstatus $73,000
-
2023-01-13status Under Contract- Do Not Show
-
2023-01-09historical
-
2022-12-21price $79,900
-
2022-12-13$85,000 Active
-
2022-12-09soldstatus $47,000
ⓘ Source: listings_history table (triggers on properties + properties_extension) + one-shot
backfill from property_details.listing_events for pre-trigger history.
Tax reassessment forecast NY · Partial reset (capped growth)
- Current annual tax
- $1,428 · $119/mo
- Projected year-2 tax
- $1,466 · $122/mo
- Expected delta
- +$38/yr (+$3/mo · 2.7%)
ⓘ Screening estimate from a state-policy table — verify with the county assessor before closing.
Climate risk First Street
- Flood 1/10 Low FEMA zone X (unshaded) · 0% chance over 30 yrs
- Wildfire 2/10 Low
- Heat 3/10 Moderate 7 d/yr ≥92°F today · 15 d/yr by 30 yrs out
- Wind 1/10 Low
- Air quality 4/10 Moderate 3 unhealthy d/yr today · 8 by 30 yrs out
Nearby sold comps map
Loading sold comps map…
Walkable amenities ~0.75 mi
Loading nearby amenities…
Taxation est. · year 1
- Rental income
- $28,236
- − Mortgage interest
- −$4,985
- − Property taxes
- −$1,428
- − Insurance
- −$445
- − Repairs & maintenance
- −$2,259
- − Management
- −$2,259
- − Depreciation
- −$2,589
- Taxable income
- $14,271
- Est. tax owed @ 24.0%
- −$3,425
- After-tax cash flow
- $11,408/yr
For passive investors: Depreciation is non-cash, so a rental often shows a tax loss while cash-flowing — sheltering income. Rental losses are passive: they offset passive income freely, and up to $25,000/yr can offset ordinary (W-2) income if you actively participate and your MAGI is under $100k (phasing out to $0 by $150k); unused losses carry forward. On sale, claimed depreciation is recaptured at up to 25%, and gains may owe capital-gains tax (a 1031 exchange can defer both). Figures are a year-1 estimate at your 24.0% rate — not tax advice; consult a CPA.
Schools (NCES district)
- District
- Lackawanna City School District
- NCES district ID
- 3616440
- Math proficiency
- 19% ▼ -10.00%
- Reading proficiency
- 29% ▲ 3.00%
- Median HH income
- $35,041
- Composite
- 19.76/100
- National rank
- #8708
- State rank
- #588 of 590 in NY
Livability — Lackawanna
- Score
- 75/100
- State rank
- #254
- US rank
- #4026
Category grades
Schools grade is shown separately in the Schools card above.
Census & demographics
- Census place
- Lackawanna, NY
- City population
- 20,661
- Population (ZIP)
- 20,661
Population outlook (Erie County) Hauer SSP2
- Today (2025)
- 933,037 people
- By 2030
- 935,181 · +0.2%
- By 2040
- 928,531 · -0.5%
- By 2050
- 905,725 · -2.9%
- By 2075
- 834,037 · -10.6%
- By 2100
- 708,033 · -24.1%
Race, ethnicity, and origin ACS 2023
- Neighborhood character
- Predominantly White (73%)
- Race & ethnicity
- White 73% Black 13% Hispanic / Latino 10% Two or more races 5%
- Hispanic origin (detail)
- Puerto Rican 8%
- Common ancestry
- Romanian 18% Lithuanian 2% Slovak 1%
- Foreign-born
- 7% · Canada
- Languages at home
- 80% English-only · Arabic 11% Spanish 6% Russian/Polish/Slavic 1%
Political lean MEDSL · Erie
- 2024 margin
- Lean D (+9.7) · D 54.8% · R 45.2%
- 2008→2024 swing
- -7.9pp toward R · 2008: 17.5pp · 2024: 9.7pp
- All cycles
- 2024: D+9.7 2020: D+14.7 2016: D+4.8 2012: D+15.6 2008: D+17.5
Not yet ingested
- Civics
- —
Market trends
- HPI YoY
- ▼ -39.44%
- Current HPI
- 389.0188
- Rent YoY
- —
- Metro
- —
- State GDP YoY
- ▲ 2.60%
- F500 in state
- 92
Industry mix (Fortune 500 HQ in NY)
| Industry | F500 HQs | Revenue |
|---|---|---|
| Financial Services | 10 | $950B |
|
||
| Consumer Goods | 9 | $162B |
|
||
| Insurance | 4 | $225B |
|
||
| Telecommunications | 2 | $144B |
|
||
| Pharmaceuticals | 2 | $112B |
|
||
| Media / Entertainment | 2 | $69B |
|
||
Price history
+89.4% since first listed22 events — show timeline
- 2026-04-28 Listed $89,000 WNYREIS
- 2025-12-31 Listing Removed — WNYREIS
- 2025-10-22 Price Changed $111,000 WNYREIS
- 2025-06-13 Listed $129,727 WNYREIS
- 2025-05-31 Listing Removed — WNYREIS
- 2025-03-21 Price Changed $129,000 WNYREIS
- 2025-03-18 Relisted — WNYREIS
- 2024-11-04 Price Changed $107,000 WNYREIS
- 2024-07-24 Listed $115,000 WNYREIS
- 2024-01-31 Listing Removed — WNYREIS
- 2023-11-12 Price Changed $109,000 WNYREIS
- 2023-11-12 Relisted — WNYREIS
- 2023-09-25 Listing Removed — WNYREIS
- 2023-08-25 Listed $125,000 WNYREIS
- 2023-07-30 Listing Removed — WNYREIS
- 2023-05-03 Listed $115,000 WNYREIS
- 2023-03-10 Sold (Public Records) $73,000 Public Records
- 2023-01-13 Pending — WNYREIS
- 2023-01-09 Listing Removed — WNYREIS
- 2022-12-21 Price Changed $79,900 WNYREIS
- 2022-12-13 Listed $85,000 WNYREIS
- 2022-12-09 Sold (Public Records) $47,000 Public Records
Property tax history
+2.3%/yrLatest (2025): $1,428 · +3.9% YoY. Source: county tax records.
Cash-flow waterfall
monthlySold comps — $/sqft
last 12 mo · ≤1 miLoading sold comps…