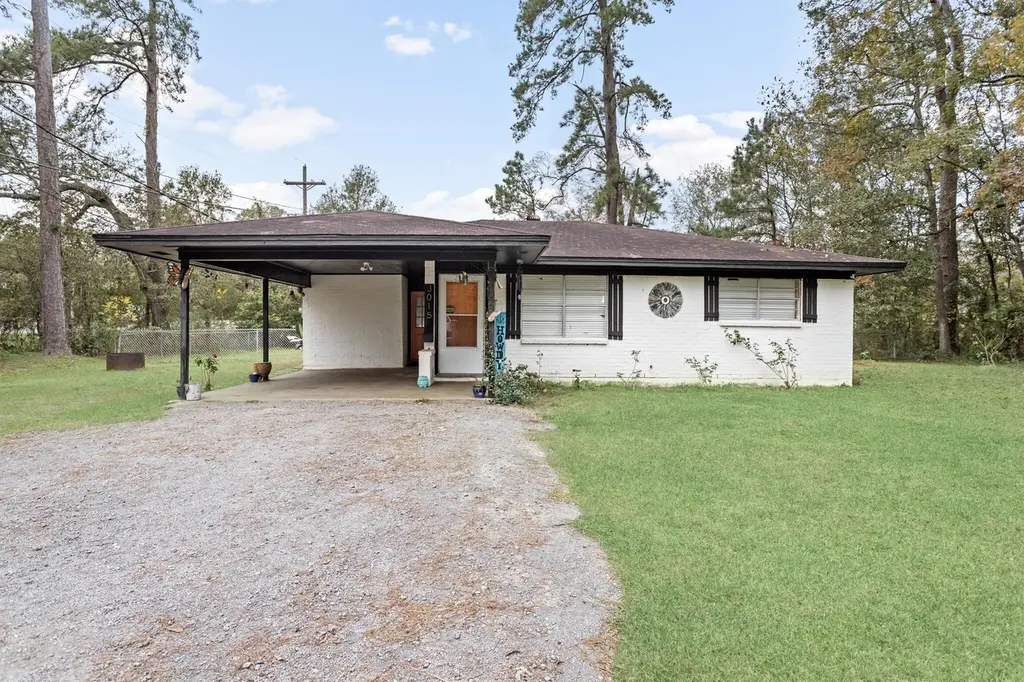
3015 Zo Ann Dr · Vidor, TX
Flood risk 6/10 · Moderate
- FEMA flood zone
- AE
- Chance of flooding over 30 yrs
- 0.74%
- Est. flood insurance / yr
- $1,737 – $8,500
Fire risk 3/10 · Minor
- Est. fire insurance / yr
- $1,222 – $2,270
Heat risk 9/10 · Severe
- Hot days now (above 109°F)
- 7 days/yr
- Hot days in 30 yrs
- 23 days/yr
Wind risk 9/10 · Severe
- Chance of severe wind over 30 yrs
- 99.0%
Air-quality risk 2/10 · Minimal
- Unhealthy air days now
- 1 days/yr
- Unhealthy air days in 30 yrs
- 1 days/yr
Risk factors via First Street. Map © Google.
Why this score? — see what drove the C+ grade
The composite is a weighted blend of 9 inputs, each scored 0–100. Each bar is that input's sub-score; the figure is the points it added to the 100-point composite (weight × sub-score).
- Cash flow +23.5/30.0
- ARV discount +15.0/15.0
- DSCR +7.6/10.0
- 1% rule +6.7/10.0
- Schools +3.4/10.0
- Livability +3.4/5.0
- Rent growth +2.5/5.0
- Condition / age +2.5/5.0
- Appreciation +0.0/10.0
$140,800
🖨 Deal sheet (PDF) 📄 Offer letter ✓ Due diligence
Listing remarks MLS
Looking for a sweet little home that sits on a larger lot? Look no further! This brick home is just right, with a functional floorplan. The yard is fenced in and has plenty of room for pets or children. Outside AC unit was replaced in 2023 and holds a 10yr warranty that's transferable, and the inside unit has 6yrs left on warranty. The house has been freshly painted and is move in ready! All Kitchen appliances are staying including refrigerator. Don't push off seeing this home, it might just be what you're looking for! Perfect for downsizing, first time home buyer, or even an investment. The taxes are LOW!! Call today! GO PIRATES!!! Located in Vidor ISD
Key facts
- Kitchen appliances
- Fenced yard
- Outside ac unit
Tags
Neighborhood map
What this means for you Summary
Snapshot
- This is a 3-bed/1.5-bath single-family listed at $141k.
Deal economics
- At list price, monthly cash flow is $-164 ($-2k/yr) — negative.
- To cash-flow at today's rent, offer at most $112k (20.6% below list).
- Meets the 1% rule at list price ($2k rent vs $141k).
- Recommended offer: $112k (20.6% below list) — sets the bar for cash-flow.
- Cap rate 8.5% vs local median 4.6% in Vidor — top-decile yield for the area; either an underpriced asset or a hidden risk that comps aren't pricing in. Stress-test before assuming the spread holds.
Location & tenants
- Location reads 67/100 on livability (#576 in TX) — a middle-class / working-renter tenant base. Strengths: cost of living A+, housing A+, crime B; Watch: schools D-, amenities F, commute F.
- Vidor ISD (suburban): math 41% / reading 39% proficiency, ranked #422 of 826 in TX (top 51%) — families likely to look elsewhere, expect single-tenant / working-renter base with shorter leases.
- Market conditions: 242 active listings in the ZIP; 2 comparable units currently listed for rent nearby; 235 units permitted in Orange County in 2024 (50 in 5+ unit buildings).
Forward outlook
- Local home prices are declining (-3.0%/yr); year-one equity from $973 of loan paydown is wiped out by about $4k of value loss. Plan a longer hold.
- Orange County population projected at +6% by 2050 — modest demand growth; plan on rents tracking national, not racing it.
Negotiation context
- It's been on market 89 days — a 6% lower offer ($132k) is reasonable based on typical stale-listing flexibility.
- Current owner paid $95k; 48% above their basis — modest negotiation headroom, anchor on the comps not their cost.
Risks & watch-outs
- Watch-outs: flood insurance adds $427/mo.
- Climate carrying-cost: in FEMA flood zone AE (mandatory federal flood insurance); severe wind risk, 99% chance of damaging wind over 30y; extreme-heat days projected 7→23/yr by 2055 (HVAC capex compounding) — expect insurance premiums to compound above CPI over the hold.
Questions for the listing agent
- What do current leases actually rent for vs. the listed asking? Can we see a recent rent roll and the last 12 months of T-12 income?
- It's been on market 89 days. Have you received any prior offers? Is the seller open to a 21% concession, seller financing, or rate buy-down credit?
- Built in 1971 — when were the roof, HVAC, electrical panel, plumbing, and water heater last replaced?
- What's the actual annual flood-insurance premium (NFIP or private), and is the property in a SFHA with mandatory coverage?
- Why hasn't it sold? Are there any deal-killer items the seller is aware of (foundation, flood, title, zoning, code violations)?
- Is there a deadline driving the sale (1031 exchange, divorce, estate, relocation)? That informs how much negotiation room exists.
- Schools are D-rated, which usually means shorter tenancies and higher turnover. Who's the typical renter profile here, and what's been the actual vacancy rate?
- What's the average days-on-market for RENTAL listings here right now (not sales)? A rising rental-DOM trend means longer vacancies and softer asking-rent achievability than the comps imply.
- What's the recent tenant-quality profile in this submarket — average credit score on applications, eviction rate, late-payment / NSF rate, and stable-employment percentage? A property-management company in the area should have these aggregated.
- How much new for-sale + rental construction is in the pipeline within 1–3 miles? Heavy new supply typically softens prices + rents 12–24 months out; constrained supply supports both.
Investment metrics
- 1% rule
- 1.17% ✓
- Cap rate
- 8.53%
- Cash-on-cash
- 8.00%
- DSCR
- 1.36
- GRM
- 7.1
CMA / ARV
- ARV (median comp)
- $171,314
- List price
- $140,800
- Delta
- -17.81%
- Verdict
- UNDERPRICED
- Comps
- 13 within 2.0 mi
Projected returns pro-forma
-3.0% appreciation · 3.0% rent growth · sell at horizon
- IRR
- -24.4%
- Equity multiple
- 0.16×
- Total profit
- $-32,922
- Equity at exit
- $20,994
- IRR
- -19.1%
- Equity multiple
- -0.03×
- Total profit
- $-40,765
- Equity at exit
- $12,174
Cash invested: $39,424 (down + closing). Projections, not guarantees.
Landlord ↔ Tenant lean methodology
- Overall (STATE)
- 87 Strongly Landlord-Friendly
- State Texas
- 87 Strongly Landlord-Friendly · R+5
- County
- — inherits STATE
- City
- — inherits STATE
ZIP-level market 77662
- Active inventory
- 242
- Price-to-rent
- 7.1×
Monthly cashflow live
- Estimated rent
- $1,653 medium interval (Pro) →
- Mortgage (P&I)
- −$738
- Tax from tax record
- −$246 /mo · $2,955/yr
- Insurance
- −$59
- Flood insurance flood zone
- −$427 /mo · $5,118/yr
- HOA
- −$0
- Vacancy / Maint / Mgmt
- −$347
- Net cashflow
- $-164
Break-even live
Sensitivity live
| Price | -10% $-84 | -5% $-124 | +0% $-164 | +5% $-204 | +10% $-244 |
|---|---|---|---|---|---|
| Rent | -10% $-294 | -5% $-229 | +0% $-164 | +5% $-99 | +10% $-33 |
| Rate | -1.0pp $-93 | -0.5pp $-128 | base $-164 | +0.5pp $-200 | +1.0pp $-237 |
UW: 25.0% down · 7.5% · 30yr · 1.5% tax · 5.0% vac · 8.0% maint · 8.0% mgmt
Financing live
Cash to close
- Down payment
- $35,200
- Closing costs
- $4,224
- Reserves months
- —
- Total cash needed
- —
Loan-product check · same deal, 3 products live
Conventional
25% down · 7.5% · 30yr
- Down + closing
- —
- Monthly P&I
- —
- Monthly cashflow
- —
- DSCR
- —
- Eligible?
- —
Personal DTI + credit; lowest rate.
DSCR
20% down · 8.5% · 30yr
- Down + closing
- —
- Monthly P&I
- —
- Monthly cashflow
- —
- DSCR
- —
- Eligible?
- —
No personal income docs; deal must DSCR.
Hard money
10% down · 12.0% · 12mo
- Down + closing
- —
- Monthly P&I
- —
- Monthly cashflow
- —
- DSCR
- —
- Eligible?
- —
Short-term bridge; refi at stabilization.
Rent comps 2 comps
| Address | Beds | Baths | Sqft | Rent | $/sqft | DOM | Units | Dist |
|---|---|---|---|---|---|---|---|---|
| 3710 Stanley Dr Vidor, TX | 3.0 | 2.0 | 1340 | $1,249 | $0.93 | 15d | 1 | 0.49mi |
| 4225 Oak Dr Vidor, TX | 2.0 | 1.0 | 1087 | $1,500 | $1.38 | 45d | 1 | 1.23mi |
Listing history 20 events
-
2026-06-21days on market $140,800 Active 89 DOM
-
2026-06-18days on market $140,800 Active 86 DOM
-
2026-06-17days on market $140,800 Active 85 DOM
-
2026-06-16days on market $140,800 Active 84 DOM
-
2026-06-15days on market $140,800 Active 83 DOM
-
2026-06-14days on market $140,800 Active 81 DOM
-
2026-06-10days on market $140,800 Active 78 DOM
-
2026-06-09days on market $140,800 Active 77 DOM
-
2026-06-08days on market $140,800 Active 76 DOM
-
2026-06-07days on market $140,800 Active 75 DOM
-
2026-06-03days on market $140,800 Active 71 DOM
-
2026-06-02days on market $140,800 Active 70 DOM
-
2026-06-01days on market $140,800 Active 69 DOM
-
2026-05-31days on market $140,800 Active 68 DOM
-
2026-05-30days on market $140,800 Active 67 DOM
-
2026-04-18price $140,800 661-char remark
Show marketing remark (661 chars)
Looking for a sweet little home that sits on a larger lot? Look no further! This brick home is just right, with a functional floorplan. The yard is fenced in and has plenty of room for pets or children. Outside AC unit was replaced in 2023 and holds a 10yr warranty that's transferable, and the inside unit has 6yrs left on warranty. The house has been freshly painted and is move in ready! All Kitchen appliances are staying including refrigerator. Don't push off seeing this home, it might just be what you're looking for! Perfect for downsizing, first time home buyer, or even an investment. The taxes are LOW!! Call today! GO PIRATES!!! Located in Vidor ISD
-
2026-03-25$146,800 Active 661-char remark
Show marketing remark (661 chars)
Looking for a sweet little home that sits on a larger lot? Look no further! This brick home is just right, with a functional floorplan. The yard is fenced in and has plenty of room for pets or children. Outside AC unit was replaced in 2023 and holds a 10yr warranty that's transferable, and the inside unit has 6yrs left on warranty. The house has been freshly painted and is move in ready! All Kitchen appliances are staying including refrigerator. Don't push off seeing this home, it might just be what you're looking for! Perfect for downsizing, first time home buyer, or even an investment. The taxes are LOW!! Call today! GO PIRATES!!! Located in Vidor ISD
-
2023-04-24soldstatus
-
2023-04-24soldstatus
-
2020-07-15soldstatus $95,000
ⓘ Source: listings_history table (triggers on properties + properties_extension) + one-shot
backfill from property_details.listing_events for pre-trigger history.
Tax reassessment forecast TX · Resets to sale price
- Current annual tax
- $2,955 · $246/mo
- Projected year-2 tax
- $2,955 · $246/mo
- Expected delta
- $0/yr ($0/mo · 0.0%)
ⓘ Screening estimate from a state-policy table — verify with the county assessor before closing.
Climate risk First Street
- Flood 6/10 Major FEMA zone AE · 74% chance over 30 yrs
- Wildfire 3/10 Moderate
- Heat 9/10 Extreme 7 d/yr ≥109°F today · 23 d/yr by 30 yrs out
- Wind 9/10 Extreme 99% chance of damaging wind over 30 yrs
- Air quality 2/10 Low 1 unhealthy d/yr today · 1 by 30 yrs out
Nearby sold comps map
Loading sold comps map…
Walkable amenities ~0.75 mi
Loading nearby amenities…
Taxation est. · year 1
- Rental income
- $19,838
- − Mortgage interest
- −$7,887
- − Property taxes
- −$2,955
- − Insurance
- −$5,822
- − Repairs & maintenance
- −$1,587
- − Management
- −$1,587
- − Depreciation
- −$4,096
- Taxable loss
- −$4,097
- Est. tax savings @ 24.0%
- +$983
- After-tax cash flow
- $-983/yr
For passive investors: Depreciation is non-cash, so a rental often shows a tax loss while cash-flowing — sheltering income. Rental losses are passive: they offset passive income freely, and up to $25,000/yr can offset ordinary (W-2) income if you actively participate and your MAGI is under $100k (phasing out to $0 by $150k); unused losses carry forward. On sale, claimed depreciation is recaptured at up to 25%, and gains may owe capital-gains tax (a 1031 exchange can defer both). Figures are a year-1 estimate at your 24.0% rate — not tax advice; consult a CPA.
Schools (NCES district)
- District
- Vidor ISD
- NCES district ID
- 4844160
- Math proficiency
- 41% ▼ -6.00%
- Reading proficiency
- 39% ▲ 1.00%
- Median HH income
- $44,169
- Composite
- 33.95/100
- National rank
- #5331
- State rank
- #422 of 826 in TX
Livability — Vidor
- Score
- 67/100
- State rank
- #576
- US rank
- #11001
Category grades
Schools grade is shown separately in the Schools card above.
Census & demographics
- Census place
- Vidor, TX
- County
- Orange County · 87,112 people
- City population
- 25,041
- Metro
- Beaumont-Port Arthur, TX
- Population (ZIP)
- 25,041
- Household income
- $72,243
- Rent vs Own
- Severe rent burden
- 401.0
Population outlook (Orange County) Hauer SSP2
- Today (2025)
- 88,065 people
- By 2030
- 89,591 · +1.7%
- By 2040
- 91,982 · +4.4%
- By 2050
- 93,023 · +5.6%
- By 2075
- 94,871 · +7.7%
- By 2100
- 88,155 · +0.1%
Race, ethnicity, and origin ACS 2023
- Neighborhood character
- Predominantly White (88%)
- Race & ethnicity
- White 88% Hispanic / Latino 6% Two or more races 6%
- Hispanic origin (detail)
- Mexican 5%
- Common ancestry
- Lithuanian 15% Slovak 1% Italian 1%
- Foreign-born
- 3% · Canada
- Languages at home
- 93% English-only · Spanish 4% Other Indo-European 1% Other Asian/Pacific 1%
Political lean MEDSL · Orange
- 2024 margin
- Solid R (+66.8) · D 16.4% · R 83.1%
- 2008→2024 swing
- -19.6pp toward R · 2008: -47.1pp · 2024: -66.8pp
- All cycles
- 2024: R+66.8 2020: R+63.4 2016: R+61.9 2012: R+54.3 2008: R+47.1
Not yet ingested
- Civics
- —
Market trends
- HPI YoY
- ▼ -116.46%
- Current HPI
- 141.0844
- Rent YoY
- —
- Metro
- Beaumont-Port Arthur, TX
- State GDP YoY
- ▲ 3.95%
- F500 in state
- 110
Industry mix (Fortune 500 HQ in TX)
| Industry | F500 HQs | Revenue |
|---|---|---|
| Energy | 16 | $1,198B |
|
||
| Technology | 5 | $198B |
|
||
| Engineering / Construction | 4 | $72B |
|
||
| Energy Services | 3 | $60B |
|
||
| Utilities | 3 | $41B |
|
||
| Healthcare | 2 | $330B |
|
||
Price history
+48.2% since first listed5 events — show timeline
- 2026-04-18 Price Changed $140,800 BBOR
- 2026-03-25 Listed $146,800 BBOR
- 2023-04-24 Sold (Public Records) — Public Records
- 2023-04-24 Sold (Public Records) — Public Records
- 2020-07-15 Sold (Public Records) $95,000 Public Records
Property tax history
+19.0%/yrLatest (2025): $2,955 · +11.9% YoY. Source: county tax records.
Cash-flow waterfall
monthlySold comps — $/sqft
last 12 mo · ≤1 miLoading sold comps…