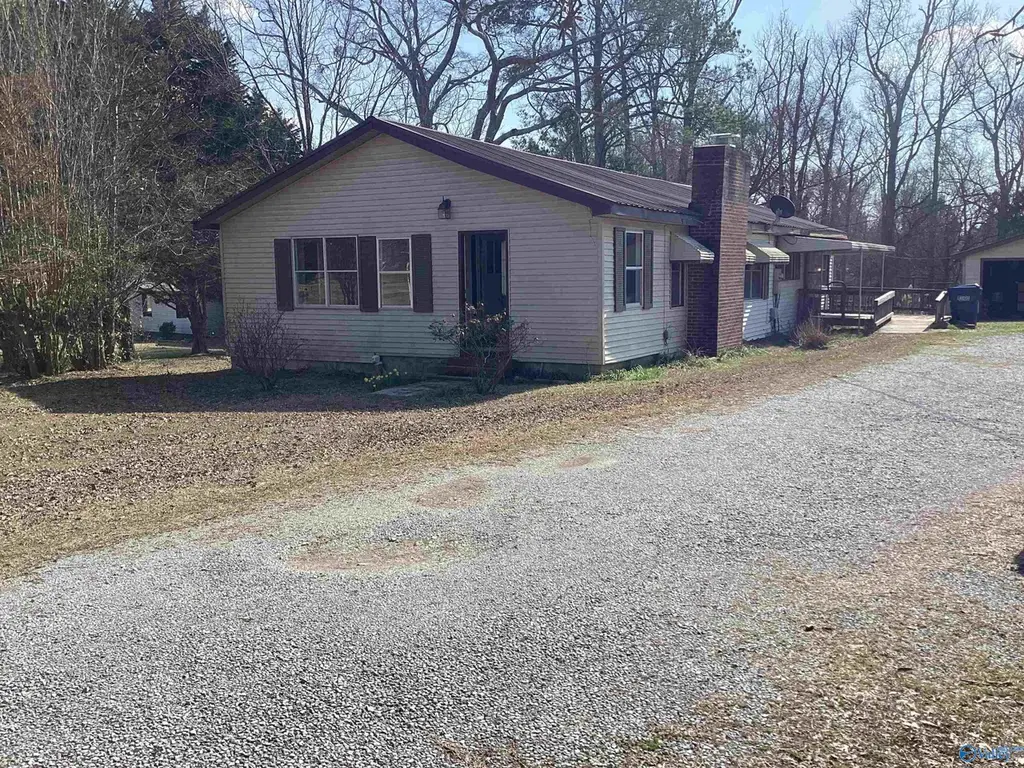
3749 Oak St · Hokes Bluff, AL
Flood risk 1/10 · Minimal
- FEMA flood zone
- X (unshaded)
- Chance of flooding over 30 yrs
- 0.0%
- Est. flood insurance / yr
- $507 – $1,088
Fire risk 5/10 · Moderate
- Est. fire insurance / yr
- $916 – $1,700
Heat risk 6/10 · Moderate
- Hot days now (above 106°F)
- 7 days/yr
- Hot days in 30 yrs
- 19 days/yr
Wind risk 5/10 · Moderate
- Chance of severe wind over 30 yrs
- 23.0%
Air-quality risk 2/10 · Minimal
- Unhealthy air days now
- 1 days/yr
- Unhealthy air days in 30 yrs
- 1 days/yr
Risk factors via First Street. Map © Google.
Why this score? — see what drove the B- grade
The composite is a weighted blend of 9 inputs, each scored 0–100. Each bar is that input's sub-score; the figure is the points it added to the 100-point composite (weight × sub-score).
- Cash flow +25.2/30.0
- ARV discount +15.0/15.0
- DSCR +8.3/10.0
- 1% rule +5.7/10.0
- Livability +3.5/5.0
- Schools +3.1/10.0
- Rent growth +2.5/5.0
- Condition / age +2.5/5.0
- Appreciation +0.0/10.0
$139,900
🖨 Deal sheet (PDF) 📄 Offer letter ✓ Due diligence
Listing remarks MLS
Charming 3-bedroom 1 bath home located in the heart of Hokes Bluff. Home features kitchen with plenty of cabinet space, gas stove, refrigerator, washer and dryer, newly remodeled bathroom, central heat and air, large 2 car detached garage, additional storage building, and large back deck.
Key facts
- Large back deck
- Washer and dryer
- Central heat and air
Tags
Neighborhood map
What this means for you Summary
Snapshot
- This is a 3-bed/1.0-bath single-family listed at $140k.
Deal economics
- At list price, monthly cash flow is $312 ($4k/yr) — positive.
- The deal already cash-flows at list — no discount required.
- Meets the 1% rule at list price ($2k rent vs $140k).
- Recommended offer: $127k (9.0% below list) — sets the bar for market timing.
- Cap rate 9.0% vs local median 4.2% in Hokes Bluff — top-decile yield for the area; either an underpriced asset or a hidden risk that comps aren't pricing in. Stress-test before assuming the spread holds.
Location & tenants
- Location reads 69/100 on livability (#57 in AL) — a middle-class / working-renter tenant base. Strengths: crime A+, cost of living A+, housing A+; Watch: schools D+, amenities F, commute F.
- Etowah County (suburban): math 21% / reading 52% proficiency, ranked #36 of 129 in AL (top 28%) — families likely to look elsewhere, expect single-tenant / working-renter base with shorter leases.
- Market conditions: 97 active listings in the ZIP; 119 units permitted in Etowah County in 2024 (0 in 5+ unit buildings).
Forward outlook
- Local home prices are declining (-3.0%/yr); year-one equity from $967 of loan paydown is wiped out by about $4k of value loss. Plan a longer hold.
- Etowah County population projected at -12% by 2050 — secular population decline; favor cash flow + early exit over multi-decade hold.
Negotiation context
- It's been on market 119 days — a 9% lower offer ($127k) is reasonable based on typical stale-listing flexibility.
- 2 sale attempts since 12y ago; this cycle's ask has dropped $10k (7%) from the opening price — seller is motivated, your offer sets the floor, not the list.
- Current owner paid $75k; list at $140k implies a 87% gain — meaningful room to come down on a strong offer.
Risks & watch-outs
- Watch-outs: built in 1948 — expect roof / HVAC / electrical / plumbing capex.
- Climate carrying-cost: moderate wind risk, 23% chance of damaging wind over 30y; moderate wildfire risk; extreme-heat days projected 7→19/yr by 2055 (HVAC capex compounding) — expect insurance premiums to compound above CPI over the hold.
Questions for the listing agent
- It's been on market 119 days. Have you received any prior offers? Is the seller open to a 9% concession, seller financing, or rate buy-down credit?
- Built in 1948 — when were the roof, HVAC, electrical panel, plumbing, and water heater last replaced?
- Why hasn't it sold? Are there any deal-killer items the seller is aware of (foundation, flood, title, zoning, code violations)?
- Is there a deadline driving the sale (1031 exchange, divorce, estate, relocation)? That informs how much negotiation room exists.
- Schools are D-rated, which usually means shorter tenancies and higher turnover. Who's the typical renter profile here, and what's been the actual vacancy rate?
- What's the average days-on-market for RENTAL listings here right now (not sales)? A rising rental-DOM trend means longer vacancies and softer asking-rent achievability than the comps imply.
- What's the recent tenant-quality profile in this submarket — average credit score on applications, eviction rate, late-payment / NSF rate, and stable-employment percentage? A property-management company in the area should have these aggregated.
- How much new for-sale + rental construction is in the pipeline within 1–3 miles? Heavy new supply typically softens prices + rents 12–24 months out; constrained supply supports both.
Investment metrics
- 1% rule
- 1.07% ✓
- Cap rate
- 8.97%
- Cash-on-cash
- 9.55%
- DSCR
- 1.43
- GRM
- 7.8
CMA / ARV
- ARV (median comp)
- $178,525
- List price
- $139,900
- Delta
- -21.64%
- Verdict
- UNDERPRICED
- Comps
- 20 within 1.0 mi
Show comp detail 7 sales within ~0.75 mi
| Address | Dist | Beds/Ba | Sqft | Sold | Price | $/sf | Match |
|---|---|---|---|---|---|---|---|
| 3829 Oak St | 0.14mi | 3/2.0 | 1,720 (+10%) | 1mo | $179,900 | $105 | 72 |
| 3837 US Highway 278 E | 0.09mi | 3/1.0 | 1,502 (-4%) | 23mo | $175,000 | $117 | 70 |
| 4185 Faye Dr | 0.52mi | 3/2.5 | 1,590 (+1%) | 4mo | $318,000 | $200 | 64 |
| 4195 Faye Dr | 0.52mi | 3/2.0 | 1,701 (+8%) | 4mo | $379,000 | $223 | 54 |
| 4172 Oak St | 0.43mi | 3/2.0 | 1,400 (-11%) | 18mo | $259,000 | $185 | 43 |
| 3723 Mclain St N | 0.72mi | 3/2.0 | 1,655 (+6%) | 15mo | $175,000 | $106 | 41 |
| 1424 Marguerite Ave | 0.73mi | 2/1.0 (-1) | 1,453 (-7%) | 10mo | $116,000 | $80 | 40 |
Match score weights: distance 35% · size 25% · config 20% · recency 20%. Top-matched comps best support the ARV.
Projected returns pro-forma
-3.0% appreciation · 3.0% rent growth · sell at horizon
- IRR
- -1.9%
- Equity multiple
- 0.93×
- Total profit
- $-2,845
- Equity at exit
- $20,860
- IRR
- 7.7%
- Equity multiple
- 1.59×
- Total profit
- $22,957
- Equity at exit
- $12,096
Cash invested: $39,172 (down + closing). Projections, not guarantees.
Landlord ↔ Tenant lean methodology
- Overall (STATE)
- 90 Strongly Landlord-Friendly
- State Alabama
- 90 Strongly Landlord-Friendly · R+15
- County
- — inherits STATE
- City
- — inherits STATE
ZIP-level market 35903
- Home prices YoY
- -11.0%
- Active inventory
- 97
- Price-to-rent
- 7.8×
Monthly cashflow live
- Estimated rent
- $1,502 medium interval (Pro) →
- Mortgage (P&I)
- −$734
- Tax from tax record
- −$83 /mo · $995/yr
- Insurance
- −$58
- HOA
- −$0
- Vacancy / Maint / Mgmt
- −$315
- Net cashflow
- $312
Break-even live
Sensitivity live
| Price | -10% $391 | -5% $351 | +0% $312 | +5% $272 | +10% $233 |
|---|---|---|---|---|---|
| Rent | -10% $193 | -5% $252 | +0% $312 | +5% $371 | +10% $430 |
| Rate | -1.0pp $382 | -0.5pp $347 | base $312 | +0.5pp $276 | +1.0pp $239 |
UW: 25.0% down · 7.5% · 30yr · 1.5% tax · 5.0% vac · 8.0% maint · 8.0% mgmt
Financing live
Cash to close
- Down payment
- $34,975
- Closing costs
- $4,197
- Reserves months
- —
- Total cash needed
- —
Loan-product check · same deal, 3 products live
Conventional
25% down · 7.5% · 30yr
- Down + closing
- —
- Monthly P&I
- —
- Monthly cashflow
- —
- DSCR
- —
- Eligible?
- —
Personal DTI + credit; lowest rate.
DSCR
20% down · 8.5% · 30yr
- Down + closing
- —
- Monthly P&I
- —
- Monthly cashflow
- —
- DSCR
- —
- Eligible?
- —
No personal income docs; deal must DSCR.
Hard money
10% down · 12.0% · 12mo
- Down + closing
- —
- Monthly P&I
- —
- Monthly cashflow
- —
- DSCR
- —
- Eligible?
- —
Short-term bridge; refi at stabilization.
Listing history 20 events
-
2026-06-19days on market $139,900 Active 119 DOM
-
2026-06-18days on market $139,900 Active 118 DOM
-
2026-06-17days on market $139,900 Active 117 DOM
-
2026-06-16days on market $139,900 Active 116 DOM
-
2026-06-15days on market $139,900 Active 115 DOM
-
2026-06-14days on market $139,900 Active 113 DOM
-
2026-06-13pricedays on market $139,900 Active 112 DOM
-
2026-06-10days on market $149,900 Active 110 DOM
-
2026-06-09days on market $149,900 Active 109 DOM
-
2026-06-08days on market $149,900 Active 108 DOM
-
2026-06-07days on market $149,900 Active 107 DOM
-
2026-06-05days on market $149,900 Active 104 DOM
-
2026-06-03days on market $149,900 Active 103 DOM
-
2026-06-02days on market $149,900 Active 102 DOM
-
2026-06-01days on market $149,900 Active 101 DOM
-
2026-05-31days on market $149,900 Active 100 DOM
-
2026-05-30days on market $149,900 Active 99 DOM
-
2026-02-20$149,900 Active 289-char remark
Show marketing remark (289 chars)
Charming 3-bedroom 1 bath home located in the heart of Hokes Bluff. Home features kitchen with plenty of cabinet space, gas stove, refrigerator, washer and dryer, newly remodeled bathroom, central heat and air, large 2 car detached garage, additional storage building, and large back deck.
-
2014-12-17soldstatus $75,000 100-char remark
Show marketing remark (100 chars)
Investor! Home w/acerage, pond, det garage, 4BR, 1BA, LR/DR combo, family rm, brkfst rm, metal roof.
-
2014-07-01$89,900 100-char remark
Show marketing remark (100 chars)
Investor! Home w/acerage, pond, det garage, 4BR, 1BA, LR/DR combo, family rm, brkfst rm, metal roof.
ⓘ Source: listings_history table (triggers on properties + properties_extension) + one-shot
backfill from property_details.listing_events for pre-trigger history.
Tax reassessment forecast AL · Resets to sale price
- Current annual tax
- $995 · $83/mo
- Projected year-2 tax
- $995 · $83/mo
- Expected delta
- $0/yr ($0/mo · 0.0%)
ⓘ Screening estimate from a state-policy table — verify with the county assessor before closing.
Climate risk First Street
- Flood 1/10 Low FEMA zone X (unshaded) · 0% chance over 30 yrs
- Wildfire 5/10 Major
- Heat 6/10 Major 7 d/yr ≥106°F today · 19 d/yr by 30 yrs out
- Wind 5/10 Major 23% chance of damaging wind over 30 yrs
- Air quality 2/10 Low 1 unhealthy d/yr today · 1 by 30 yrs out
Nearby sold comps map
Loading sold comps map…
Walkable amenities ~0.75 mi
Loading nearby amenities…
Taxation est. · year 1
- Rental income
- $18,025
- − Mortgage interest
- −$7,837
- − Property taxes
- −$995
- − Insurance
- −$700
- − Repairs & maintenance
- −$1,442
- − Management
- −$1,442
- − Depreciation
- −$4,070
- Taxable income
- $1,540
- Est. tax owed @ 24.0%
- −$370
- After-tax cash flow
- $3,372/yr
For passive investors: Depreciation is non-cash, so a rental often shows a tax loss while cash-flowing — sheltering income. Rental losses are passive: they offset passive income freely, and up to $25,000/yr can offset ordinary (W-2) income if you actively participate and your MAGI is under $100k (phasing out to $0 by $150k); unused losses carry forward. On sale, claimed depreciation is recaptured at up to 25%, and gains may owe capital-gains tax (a 1031 exchange can defer both). Figures are a year-1 estimate at your 24.0% rate — not tax advice; consult a CPA.
Schools (NCES district)
- District
- Etowah County
- NCES district ID
- 0101380
- Math proficiency
- 21% ▼ -28.00%
- Reading proficiency
- 52% ▼ -1.00%
- Median HH income
- $46,403
- Composite
- 31.12/100
- National rank
- #6062
- State rank
- #36 of 129 in AL
Livability — Hokes Bluff
- Score
- 69/100
- State rank
- #57
- US rank
- #8636
Category grades
Schools grade is shown separately in the Schools card above.
Census & demographics
- Census place
- Hokes Bluff, AL
- Population (ZIP)
- 17,180
Population outlook (Etowah County) Hauer SSP2
- Today (2025)
- 100,500 people
- By 2030
- 98,488 · -2.0%
- By 2040
- 93,731 · -6.7%
- By 2050
- 88,681 · -11.8%
- By 2075
- 76,746 · -23.6%
- By 2100
- 65,373 · -35.0%
Race, ethnicity, and origin ACS 2023
- Neighborhood character
- Majority White (62%)
- Race & ethnicity
- White 62% Black 31% Hispanic / Latino 4% Two or more races 4% Asian 1%
- Common ancestry
- Italian 3% Slovak 2% Portuguese 1%
- Foreign-born
- 3% · Canada
- Languages at home
- 96% English-only · Spanish 4%
Political lean MEDSL · Etowah
- 2024 margin
- Solid R (+55.7) · D 21.8% · R 77.5%
- 2008→2024 swing
- -17.5pp toward R · 2008: -38.2pp · 2024: -55.7pp
- All cycles
- 2024: R+55.7 2020: R+50.2 2016: R+50.1 2012: R+38.4 2008: R+38.2
Not yet ingested
- Civics
- —
Market trends
- HPI YoY
- ▼ -29.07%
- Current HPI
- 236.2537
- Rent YoY
- —
- Metro
- —
- State GDP YoY
- ▲ 2.94%
- F500 in state
- 4
Industry mix (Fortune 500 HQ in AL)
| Industry | F500 HQs | Revenue |
|---|---|---|
| Financial Services | 1 | $8B |
|
||
| Healthcare | 1 | $5B |
|
||
Price history
+66.7% since first listed3 events — show timeline
- 2026-02-20 Listed $149,900 VMLS
- 2014-12-17 Sold (MLS) $75,000 VMLS
- 2014-07-01 Listed $89,900 VMLS
Property tax history
+6.5%/yrLatest (2025): $995 · +0.0% YoY. Source: county tax records.
Cash-flow waterfall
monthlySold comps — $/sqft
last 12 mo · ≤1 miLoading sold comps…