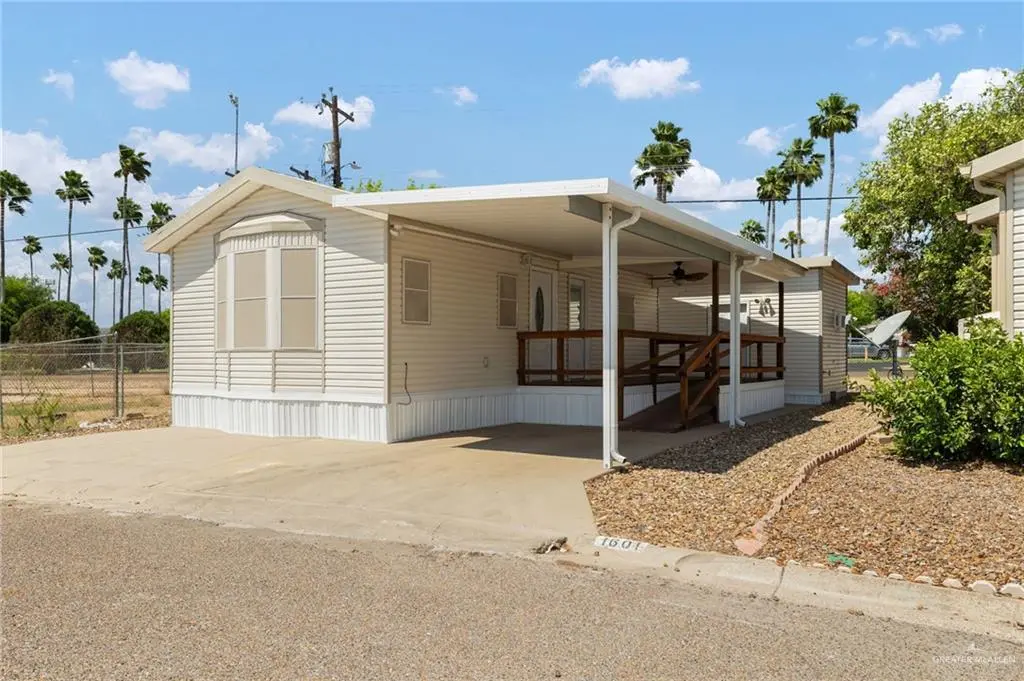
1601 Santa Rosa Ave · Mission, TX
Flood risk No data
- FEMA flood zone
- —
- Chance of flooding over 30 yrs
- —
- Est. flood insurance / yr
- —
Fire risk No data
- Est. fire insurance / yr
- —
Heat risk No data
- Hot days now (above threshold)
- —
- Hot days in 30 yrs
- —
Wind risk No data
- Chance of severe wind over 30 yrs
- —
Air-quality risk No data
- Unhealthy air days now
- —
- Unhealthy air days in 30 yrs
- —
Risk factors via First Street. Map © Google.
Why this score? — see what drove the D grade
The composite is a weighted blend of 9 inputs, each scored 0–100. Each bar is that input's sub-score; the figure is the points it added to the 100-point composite (weight × sub-score).
- Cash flow +18.8/30.0
- 1% rule +6.1/10.0
- DSCR +5.9/10.0
- Livability +3.8/5.0
- Schools +3.4/10.0
- Rent growth +2.7/5.0
- Condition / age +2.5/5.0
- ARV discount +0.0/15.0
- Appreciation +0.0/10.0
$65,000
🖨 Deal sheet (PDF) 📄 Offer letter ✓ Due diligence
Listing remarks MLS
¡AQUI ESTA LA FIESTA! Let's get the party started right here in Mission's Fiesta Village, a 55+ community conveniently located just north of the expressway off Stewart Rd.! This cozy, COMPLETELY REMODELED 1-bedroom, 1-bathroom mobile home comes fully equipped with all the appliances. The outbuilding comes with the washer and dryer, and it can be used for storage or finished out to suit your needs. You'll be just a short walk from Fiesta Village's clubhouse, huge pool, hot tub, pickle ball courts, and shuffle board courts. The clubhouse offers a large hall with organized activities like cards, dance lessons, art classes, and wood carving classes. This South Texas home was well-loved, and it's ready for you to do the same! *Lot lines in the aerial photography are approximate and for reference only.
Key facts
- Hot tub
- Completely remodeled
- Huge pool
Tags
Neighborhood map
What this means for you Summary
Snapshot
- This is a 2-bed/2.0-bath manufactured listed at $65k.
Deal economics
- At list price, monthly cash flow is $65 ($784/yr) — positive.
- The deal already cash-flows at list — no discount required.
- Meets the 1% rule at list price ($722 rent vs $65k).
- Recommended offer: $61k (6.0% below list) — sets the bar for market timing.
- Cap rate 7.5% vs local median 3.5% in Mission — top-decile yield for the area; either an underpriced asset or a hidden risk that comps aren't pricing in. Stress-test before assuming the spread holds.
Location & tenants
- Location reads 75/100 on livability (#148 in TX, #4,155 nationally) — a middle-class / working-renter tenant base. Strengths: cost of living A+, housing A+, health & safety A+; Watch: amenities F, commute F, employment D-.
- Sharyland ISD (urban): math 34% / reading 44% proficiency, ranked #406 of 826 in TX (top 49%) — families likely to look elsewhere, expect single-tenant / working-renter base with shorter leases.
- Zoned schools: Lloyd & Dolly Bentsen El (math 25% / reading 33%, grade F, #2,668 of 4,322 statewide, top 63%, 559 students, 83% FRL); B L Gray J H (math 50% / reading 55%, grade C+, #293 of 1,662 statewide, top 18%, 730 students, 67% FRL); Sharyland H S (math 36% / reading 58%, grade D-, #591 of 1,632 statewide, top 38%, 1,546 students, 57% FRL).
- Market conditions: Rents flat; 852 active listings in the ZIP; 1 comparable units currently listed for rent nearby; 7,378 units permitted in Hidalgo County in 2024 (641 in 5+ unit buildings).
- This rent is only 16% of the median local income ($54k/yr) — well below the 30% rent-burden line; pricing power to push rent on renewal without tenant pushback.
Forward outlook
- Local home prices are declining (-3.0%/yr); year-one equity from $449 of loan paydown is wiped out by about $2k of value loss. Plan a longer hold.
- Hidalgo County population projected at +28% by 2050 — long-run rental-demand tailwind backs the buy-and-hold thesis.
Negotiation context
- It's been on market 86 days — a 6% lower offer ($61k) is reasonable based on typical stale-listing flexibility.
Questions for the listing agent
- It's been on market 86 days. Have you received any prior offers? Is the seller open to a 6% concession, seller financing, or rate buy-down credit?
- What does the HOA fee cover, when was the last increase, and are there any pending special assessments or reserve-fund shortfalls?
- Why hasn't it sold? Are there any deal-killer items the seller is aware of (foundation, flood, title, zoning, code violations)?
- Is there a deadline driving the sale (1031 exchange, divorce, estate, relocation)? That informs how much negotiation room exists.
- The area grade is low — what's the realistic commute time and amenity access for the typical tenant pool here? Any planned neighborhood developments (good or bad) we should know about?
- What's the average days-on-market for RENTAL listings here right now (not sales)? A rising rental-DOM trend means longer vacancies and softer asking-rent achievability than the comps imply.
- What's the recent tenant-quality profile in this submarket — average credit score on applications, eviction rate, late-payment / NSF rate, and stable-employment percentage? A property-management company in the area should have these aggregated.
- How much new for-sale + rental construction is in the pipeline within 1–3 miles? Heavy new supply typically softens prices + rents 12–24 months out; constrained supply supports both.
Investment metrics
- 1% rule
- 1.11% ✓
- Cap rate
- 7.50%
- Cash-on-cash
- 4.31%
- DSCR
- 1.19
- GRM
- 7.5
CMA / ARV
- ARV (median comp)
- $44,511
- List price
- $65,000
- Delta
- 46.03%
- Verdict
- OVERPRICED
- Comps
- 2 within 1.0 mi
Projected returns pro-forma
-3.0% appreciation · 0.93% rent growth · sell at horizon
- IRR
- -12.1%
- Equity multiple
- 0.57×
- Total profit
- $-7,797
- Equity at exit
- $9,692
- IRR
- -6.7%
- Equity multiple
- 0.61×
- Total profit
- $-7,043
- Equity at exit
- $5,620
Cash invested: $18,200 (down + closing). Projections, not guarantees.
Landlord ↔ Tenant lean methodology
- Overall (STATE)
- 87 Strongly Landlord-Friendly
- State Texas
- 87 Strongly Landlord-Friendly · R+5
- County
- — inherits STATE
- City
- — inherits STATE
ZIP-level market 78572
- Home prices YoY
- -22.9%
- Rents YoY
- 0.9%
- Active inventory
- 852
- Price-to-rent
- 7.5×
Monthly cashflow live
- Estimated rent
- $722 medium interval (Pro) →
- Mortgage (P&I)
- −$341
- Tax from tax record
- −$113 /mo · $1,355/yr
- Insurance
- −$27
- HOA
- −$24
- Lot rent leased land?
- −$0
- Vacancy / Maint / Mgmt
- −$152
- Net cashflow
- $65
Break-even live
Sensitivity live
| Price | -10% $102 | -5% $84 | +0% $65 | +5% $47 | +10% $29 |
|---|---|---|---|---|---|
| Rent | -10% $8 | -5% $37 | +0% $65 | +5% $94 | +10% $122 |
| Rate | -1.0pp $98 | -0.5pp $82 | base $65 | +0.5pp $49 | +1.0pp $31 |
UW: 25.0% down · 7.5% · 30yr · 1.5% tax · 5.0% vac · 8.0% maint · 8.0% mgmt
Financing live
Cash to close
- Down payment
- $16,250
- Closing costs
- $1,950
- Reserves months
- —
- Total cash needed
- —
Loan-product check · same deal, 3 products live
Conventional
25% down · 7.5% · 30yr
- Down + closing
- —
- Monthly P&I
- —
- Monthly cashflow
- —
- DSCR
- —
- Eligible?
- —
Personal DTI + credit; lowest rate.
DSCR
20% down · 8.5% · 30yr
- Down + closing
- —
- Monthly P&I
- —
- Monthly cashflow
- —
- DSCR
- —
- Eligible?
- —
No personal income docs; deal must DSCR.
Hard money
10% down · 12.0% · 12mo
- Down + closing
- —
- Monthly P&I
- —
- Monthly cashflow
- —
- DSCR
- —
- Eligible?
- —
Short-term bridge; refi at stabilization.
Rent comps 1 comps
| Address | Beds | Baths | Sqft | Rent | $/sqft | DOM | Units | Dist |
|---|---|---|---|---|---|---|---|---|
| 1004 N Stewart Rd Unit 1012-07 Mission, TX | 1.0 | 1.0 | 250 | $475 | $1.90 | 46d | 1 | 0.81mi |
HOA detail
- Monthly dues
- $24 · $288/yr
- Likely covers
- pool
Listing history 18 events
-
2026-06-22days on market $65,000 Active 86 DOM
-
2026-06-18days on market $65,000 Active 83 DOM
-
2026-06-17days on market $65,000 Active 82 DOM
-
2026-06-16days on market $65,000 Active 81 DOM
-
2026-06-15days on market $65,000 Active 80 DOM
-
2026-06-14pricedays on market $65,000 Active 78 DOM
-
2026-06-10days on market $70,000 Active 75 DOM
-
2026-06-09days on market $70,000 Active 74 DOM
-
2026-06-08days on market $70,000 Active 73 DOM
-
2026-06-07days on market $70,000 Active 72 DOM
-
2026-06-03days on market $70,000 Active 68 DOM
-
2026-06-02days on market $70,000 Active 67 DOM
-
2026-06-01days on market $70,000 Active 66 DOM
-
2026-05-31days on market $70,000 Active 65 DOM
-
2026-05-31days on market $70,000 Active 64 DOM
-
2026-03-27$70,000 Active 813-char remark
Show marketing remark (813 chars)
¡AQUI ESTA LA FIESTA! Let's get the party started right here in Mission's Fiesta Village, a 55+ community conveniently located just north of the expressway off Stewart Rd.! This cozy, COMPLETELY REMODELED 1-bedroom, 1-bathroom mobile home comes fully equipped with all the appliances. The outbuilding comes with the washer and dryer, and it can be used for storage or finished out to suit your needs. You'll be just a short walk from Fiesta Village's clubhouse, huge pool, hot tub, pickle ball courts, and shuffle board courts. The clubhouse offers a large hall with organized activities like cards, dance lessons, art classes, and wood carving classes. This South Texas home was well-loved, and it's ready for you to do the same! *Lot lines in the aerial photography are approximate and for reference only.
-
2021-11-12soldstatus
-
1997-08-22soldstatus
ⓘ Source: listings_history table (triggers on properties + properties_extension) + one-shot
backfill from property_details.listing_events for pre-trigger history.
Tax reassessment forecast TX · Resets to sale price
- Current annual tax
- $1,355 · $113/mo
- Projected year-2 tax
- $1,355 · $113/mo
- Expected delta
- $0/yr ($0/mo · 0.0%)
ⓘ Screening estimate from a state-policy table — verify with the county assessor before closing.
Nearby sold comps map
Loading sold comps map…
Walkable amenities ~0.75 mi
Loading nearby amenities…
Taxation est. · year 1
- Rental income
- $8,662
- − Mortgage interest
- −$3,641
- − Property taxes
- −$1,355
- − Insurance
- −$325
- − Repairs & maintenance
- −$693
- − Management
- −$693
- − HOA
- −$288
- − Depreciation
- −$1,891
- Taxable loss
- −$224
- Est. tax savings @ 24.0%
- +$54
- After-tax cash flow
- $838/yr
For passive investors: Depreciation is non-cash, so a rental often shows a tax loss while cash-flowing — sheltering income. Rental losses are passive: they offset passive income freely, and up to $25,000/yr can offset ordinary (W-2) income if you actively participate and your MAGI is under $100k (phasing out to $0 by $150k); unused losses carry forward. On sale, claimed depreciation is recaptured at up to 25%, and gains may owe capital-gains tax (a 1031 exchange can defer both). Figures are a year-1 estimate at your 24.0% rate — not tax advice; consult a CPA.
Schools (NCES district)
- District
- Sharyland ISD
- NCES district ID
- 4839930
- Math proficiency
- 34% ▼ -35.00%
- Reading proficiency
- 44% ▼ -15.00%
- Median HH income
- $57,792
- Composite
- 34.38/100
- National rank
- #5214
- State rank
- #406 of 826 in TX
Livability — Mission
- Score
- 75/100
- State rank
- #148
- US rank
- #4155
Category grades
Schools grade is shown separately in the Schools card above.
Census & demographics
- Census place
- Mission, TX
- County
- Hidalgo County · 623,128 people
- City population
- 78,024
- Metro
- McAllen-Edinburg-Mission, TX
- Population (ZIP)
- 78,024
- Household income
- $54,298
- Rent vs Own
- Severe rent burden
- 1714.0
Population outlook (Hidalgo County) Hauer SSP2
- Today (2025)
- 955,232 people
- By 2030
- 1,009,774 · +5.7%
- By 2040
- 1,120,332 · +17.3%
- By 2050
- 1,225,036 · +28.2%
- By 2075
- 1,439,189 · +50.7%
- By 2100
- 1,533,429 · +60.5%
Race, ethnicity, and origin ACS 2023
- Neighborhood character
- Predominantly Hispanic (85%)
- Race & ethnicity
- Hispanic / Latino 85% Two or more races 47% White 12% Asian 2%
- Hispanic origin (detail)
- Mexican 80%
- Common ancestry
- Slovak 1% Portuguese 0%
- Foreign-born
- 28% · Canada, South Korea
- Languages at home
- 22% English-only · Spanish 76%
Political lean MEDSL · Hidalgo
- 2024 margin
- Toss-up / Even · D 48.1% · R 51.0%
- 2008→2024 swing
- -41.6pp toward R · 2008: 38.7pp · 2024: -2.9pp
- All cycles
- 2024: R+2.9 2020: D+17.1 2016: D+40.5 2012: D+41.8 2008: D+38.7
Not yet ingested
- Civics
- —
Market trends
- HPI YoY
- ▼ -62.35%
- Current HPI
- 209.3573
- Rent YoY
- ▲ 0.93%
- Metro
- McAllen-Edinburg-Mission, TX
- State GDP YoY
- ▲ 3.95%
- F500 in state
- 110
Industry mix (Fortune 500 HQ in TX)
| Industry | F500 HQs | Revenue |
|---|---|---|
| Energy | 16 | $1,198B |
|
||
| Technology | 5 | $198B |
|
||
| Engineering / Construction | 4 | $72B |
|
||
| Energy Services | 3 | $60B |
|
||
| Utilities | 3 | $41B |
|
||
| Healthcare | 2 | $330B |
|
||
Price history
3 events — show timeline
- 2026-03-27 Listed $70,000 MCALLENMLS
- 2021-11-12 Sold (Public Records) — Public Records
- 1997-08-22 Sold (Public Records) — Public Records
Property tax history
+7.9%/yrLatest (2025): $1,355 · +14.3% YoY. Source: county tax records.
Cash-flow waterfall
monthlySold comps — $/sqft
last 12 mo · ≤1 miLoading sold comps…