505 Long Hill Rd · Gillette, NJ
Flood risk No data
- FEMA flood zone
- —
- Chance of flooding over 30 yrs
- —
- Est. flood insurance / yr
- —
Fire risk No data
- Est. fire insurance / yr
- —
Heat risk No data
- Hot days now (above threshold)
- —
- Hot days in 30 yrs
- —
Wind risk No data
- Chance of severe wind over 30 yrs
- —
Air-quality risk No data
- Unhealthy air days now
- —
- Unhealthy air days in 30 yrs
- —
Risk factors via First Street. Map © Google.
Why this score? — see what drove the D grade
The composite is a weighted blend of 9 inputs, each scored 0–100. Each bar is that input's sub-score; the figure is the points it added to the 100-point composite (weight × sub-score).
- Cash flow +14.2/30.0
- ARV discount +7.5/15.0
- Schools +5.5/10.0
- DSCR +4.3/10.0
- 1% rule +4.0/10.0
- Rent growth +2.5/5.0
- Livability +2.5/5.0
- Condition / age +2.5/5.0
- Appreciation +0.0/10.0
$450,000
🖨 Deal sheet (PDF) 📄 Offer letter ✓ Due diligence
Listing remarks
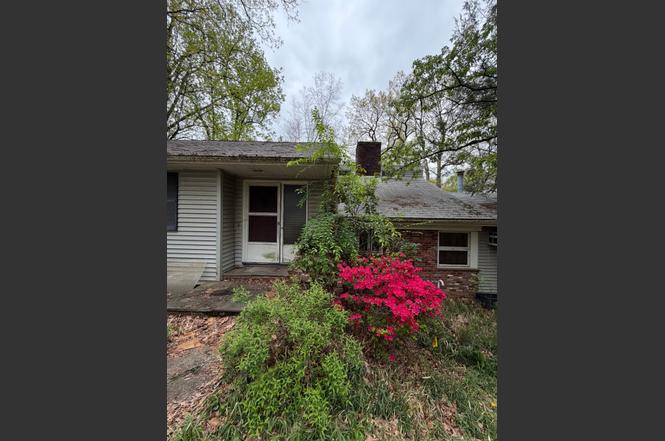
Opportunity Knocks in Gillette! This mid century split level is a true "time capsule" ready for its next chapter. Situated on . 78 acre wooded lot offering 3 bedrooms, 2 full baths, attached garage, deck, and screened porch, this home offers great bones and endless potential. This is an ideal project for an investor, contractor or a visionary buyer wanting to curate their perfect sanctuary. Sold strictly AS-IS; significant deferred maintenance throughout. Underground oil tank on site. Buyer responsible for all permits, approvals & zoning verification for any renovation or change of use. Property condition warrants caution - touring at visitor's own risk; signed hold-harmless
Key facts
- Built 1955
Property features AI
Exterior
- Home design: Single-family home; Single-story
- Construction: Living area approximately 1,721
Interior
- Bedrooms: 3 bedrooms
- Bathrooms: 2 bathrooms
- Interior features: 7 total rooms
Neighborhood map
What this means for you Summary
Snapshot
- This is a 3-bed/2.0-bath single-family listed at $450k.
Deal economics
- At list price, monthly cash flow is $76 ($913/yr) — positive.
- The deal already cash-flows at list — no discount required.
- To meet the 1% rule (rent ≥ 1% of price), the offer needs to be $403k (10.4% below list).
- Recommended offer: $403k (10.4% below list) — sets the bar for 1% rule.
Location & tenants
- Location reads: area grade D — affects rentability + tenant quality, not the cash-flow math above.
- Watchung Hills Regional High School District (suburban): math 45% / reading 63% proficiency, ranked #57 of 472 in NJ (top 12%) — acceptable for families but not a draw, mixed tenant base, ~2y average lease.
- Zoned schools: Millington Elementary School (math 34% / reading 52%, grade F, #406 of 1,303 statewide, top 32%, 352 students, 5% FRL); Central Middle School (math 34% / reading 68%, grade C, #94 of 431 statewide, top 23%, 279 students, 8% FRL); Watchung Hills Regional High School (math 45% / reading 63%, grade C-, #83 of 399 statewide, top 22%, 1,741 students, 3% FRL).
- Market conditions: 5 active listings in the ZIP; 5 comparable units currently listed for rent nearby; rentals at typical pace (median 14d on market — plan ~3-4 weeks tenant-placement turnaround); 2,357 units permitted in Morris County in 2024 (1,496 in 5+ unit buildings).
Forward outlook
- Local home prices are declining (-3.0%/yr); year-one equity from $3k of loan paydown is wiped out by about $14k of value loss. Plan a longer hold.
- Morris County population projected at +6% by 2050 — modest demand growth; plan on rents tracking national, not racing it.
Negotiation context
- Only 9 days on market — expect competitive offers; lowballing is unlikely to land.
Risks & watch-outs
- Watch-outs: built in 1955 — expect roof / HVAC / electrical / plumbing capex.
Questions for the listing agent
- Built in 1955 — when were the roof, HVAC, electrical panel, plumbing, and water heater last replaced?
- Is there a deadline driving the sale (1031 exchange, divorce, estate, relocation)? That informs how much negotiation room exists.
- The area grade is low — what's the realistic commute time and amenity access for the typical tenant pool here? Any planned neighborhood developments (good or bad) we should know about?
- What's the average days-on-market for RENTAL listings here right now (not sales)? A rising rental-DOM trend means longer vacancies and softer asking-rent achievability than the comps imply.
- What's the recent tenant-quality profile in this submarket — average credit score on applications, eviction rate, late-payment / NSF rate, and stable-employment percentage? A property-management company in the area should have these aggregated.
- How much new for-sale + rental construction is in the pipeline within 1–3 miles? Heavy new supply typically softens prices + rents 12–24 months out; constrained supply supports both.
Investment metrics
- 1% rule
- 0.90% ✗
- Cap rate
- 6.50%
- Cash-on-cash
- 0.72%
- DSCR
- 1.03
- GRM
- 9.3
CMA / ARV
No comps found within radius.
Projected returns pro-forma
-3.0% appreciation · 3.0% rent growth · sell at horizon
- IRR
- -15.1%
- Equity multiple
- 0.46×
- Total profit
- $-68,011
- Equity at exit
- $67,096
- IRR
- -6.5%
- Equity multiple
- 0.58×
- Total profit
- $-52,734
- Equity at exit
- $38,908
Cash invested: $126,000 (down + closing). Projections, not guarantees.
Landlord ↔ Tenant lean methodology
- Overall (STATE)
- 21 Tenant-Leaning
- State New Jersey
- 21 Tenant-Leaning · D+6
- County
- — inherits STATE
- City
- — inherits STATE
ZIP-level market 07933
- Home prices YoY
- -24.1%
- Active inventory
- 5
- Price-to-rent
- 9.3×
Monthly cashflow live
- Estimated rent
- $4,033 high interval (Pro) →
- Mortgage (P&I)
- −$2,360
- Tax est. 1.5%
- −$562 /mo · $6,750/yr
- Insurance
- −$188
- HOA
- −$0
- Vacancy / Maint / Mgmt
- −$847
- Net cashflow
- $76
Break-even live
Sensitivity live
| Price | -10% $387 | -5% $232 | +0% $76 | +5% $-79 | +10% $-235 |
|---|---|---|---|---|---|
| Rent | -10% $-242 | -5% $-83 | +0% $76 | +5% $235 | +10% $395 |
| Rate | -1.0pp $303 | -0.5pp $191 | base $76 | +0.5pp $-40 | +1.0pp $-159 |
UW: 25.0% down · 7.5% · 30yr · 1.5% tax · 5.0% vac · 8.0% maint · 8.0% mgmt
Financing live
Cash to close
- Down payment
- $112,500
- Closing costs
- $13,500
- Reserves months
- —
- Total cash needed
- —
Loan-product check · same deal, 3 products live
Conventional
25% down · 7.5% · 30yr
- Down + closing
- —
- Monthly P&I
- —
- Monthly cashflow
- —
- DSCR
- —
- Eligible?
- —
Personal DTI + credit; lowest rate.
DSCR
20% down · 8.5% · 30yr
- Down + closing
- —
- Monthly P&I
- —
- Monthly cashflow
- —
- DSCR
- —
- Eligible?
- —
No personal income docs; deal must DSCR.
Hard money
10% down · 12.0% · 12mo
- Down + closing
- —
- Monthly P&I
- —
- Monthly cashflow
- —
- DSCR
- —
- Eligible?
- —
Short-term bridge; refi at stabilization.
Rent comps 5 comps
| Address | Beds | Baths | Sqft | Rent | $/sqft | DOM | Units | Dist |
|---|---|---|---|---|---|---|---|---|
| 663 Springfield Ave Berkeley Heights, NJ | 1.0–2.0 | 1.0–2.0 | 1078 | $3,600 | $3.34 | 0d | 3 | 0.90mi |
| 434 Springfield Ave Berkeley Heights, NJ | 1.0–2.0 | 1.0–2.0 | 1082 | $5,124 | $4.73 | 0d | 82 | 1.28mi |
| 450 Springfield Ave Unit 301 Berkeley Heights, NJ | 2.0 | 2.0 | 1422 | $3,950 | $2.78 | 17d | 1 | 1.30mi |
| 450 Springfield Ave Unit 203 Berkeley Heights, NJ | 2.0 | 2.0 | 1504 | $4,250 | $2.83 | 17d | 1 | 1.30mi |
| 239 Sherman Ave Berkeley Heights, NJ | 1.0–2.0 | 1.0–2.0 | 884 | $3,150 | $3.56 | 14d | 3 | 1.38mi |
Listing history 8 events
-
2026-06-21days on market $450,000 Coming Soon 9 DOM
-
2026-06-18days on market $450,000 Coming Soon 6 DOM
-
2026-06-17days on market $450,000 Coming Soon 5 DOM
-
2026-06-16days on market $450,000 Coming Soon 4 DOM
-
2026-06-15price $450,000 Coming Soon 3 DOM
-
2026-06-15days on market Coming Soon 3 DOM
-
2026-06-13remarks 685-char remark
-
2026-06-13Coming Soon 1 DOM
ⓘ Source: listings_history table (triggers on properties + properties_extension) + one-shot
backfill from property_details.listing_events for pre-trigger history.
Nearby sold comps map
Loading sold comps map…
Walkable amenities ~0.75 mi
Loading nearby amenities…
Taxation est. · year 1
- Rental income
- $48,394
- − Mortgage interest
- −$25,207
- − Property taxes
- −$6,750
- − Insurance
- −$2,250
- − Repairs & maintenance
- −$3,872
- − Management
- −$3,872
- − Depreciation
- −$13,091
- Taxable loss
- −$6,647
- Est. tax savings @ 24.0%
- +$1,595
- After-tax cash flow
- $2,509/yr
For passive investors: Depreciation is non-cash, so a rental often shows a tax loss while cash-flowing — sheltering income. Rental losses are passive: they offset passive income freely, and up to $25,000/yr can offset ordinary (W-2) income if you actively participate and your MAGI is under $100k (phasing out to $0 by $150k); unused losses carry forward. On sale, claimed depreciation is recaptured at up to 25%, and gains may owe capital-gains tax (a 1031 exchange can defer both). Figures are a year-1 estimate at your 24.0% rate — not tax advice; consult a CPA.
Schools (NCES district)
- District
- Watchung Hills Regional High School District
- NCES district ID
- 3417220
- Math proficiency
- 45% ▲ 3.00%
- Reading proficiency
- 63% ▼ -9.00%
- Median HH income
- $142,921
- Composite
- 54.91/100
- National rank
- #1311
- State rank
- #57 of 472 in NJ
Livability — Gillette
No livability data for this city. (Only ~50 U.S. cities are tracked.)
Census & demographics
- Census place
- Gillette, NJ
- City population
- 2,920
- Population (ZIP)
- 2,920
Population outlook (Morris County) Hauer SSP2
- Today (2025)
- 516,747 people
- By 2030
- 524,603 · +1.5%
- By 2040
- 539,582 · +4.4%
- By 2050
- 548,986 · +6.2%
- By 2075
- 571,326 · +10.6%
- By 2100
- 561,122 · +8.6%
Race, ethnicity, and origin ACS 2023
- Neighborhood character
- Predominantly White (75%)
- Race & ethnicity
- White 75% Hispanic / Latino 19% Two or more races 8% Asian 2%
- Hispanic origin (detail)
- Puerto Rican 4% Dominican 2%
- Common ancestry
- Romanian 6% Subsaharan African 3% Russian 2%
- Foreign-born
- 18% · Canada, China, Dominican Republic
- Languages at home
- 74% English-only · Spanish 17% Russian/Polish/Slavic 3% German/W. Germanic 3%
Political lean MEDSL · Morris
- 2024 margin
- Toss-up / Even · D 47.7% · R 50.4% · Other 1.9%
- 2008→2024 swing
- +5.4pp toward D · 2008: -8.1pp · 2024: -2.7pp
- All cycles
- 2024: R+2.7 2020: D+4.2 2016: R+4.4 2012: R+11.6 2008: R+8.1
Not yet ingested
- Civics
- —
Market trends
- HPI YoY
- ▼ -77.18%
- Current HPI
- 243.2579
- Rent YoY
- —
- Metro
- —
- State GDP YoY
- ▲ 2.05%
- F500 in state
- 34
Industry mix (Fortune 500 HQ in NJ)
| Industry | F500 HQs | Revenue |
|---|---|---|
| Consumer Goods | 3 | $31B |
|
||
| Pharmaceuticals | 2 | $153B |
|
||
| Technology | 2 | $21B |
|
||
| Insurance | 2 | $20B |
|
||
| Healthcare | 2 | $19B |
|
||
| Financial Services | 1 | $70B |
|
||
Cash-flow waterfall
monthlySold comps — $/sqft
last 12 mo · ≤1 miLoading sold comps…