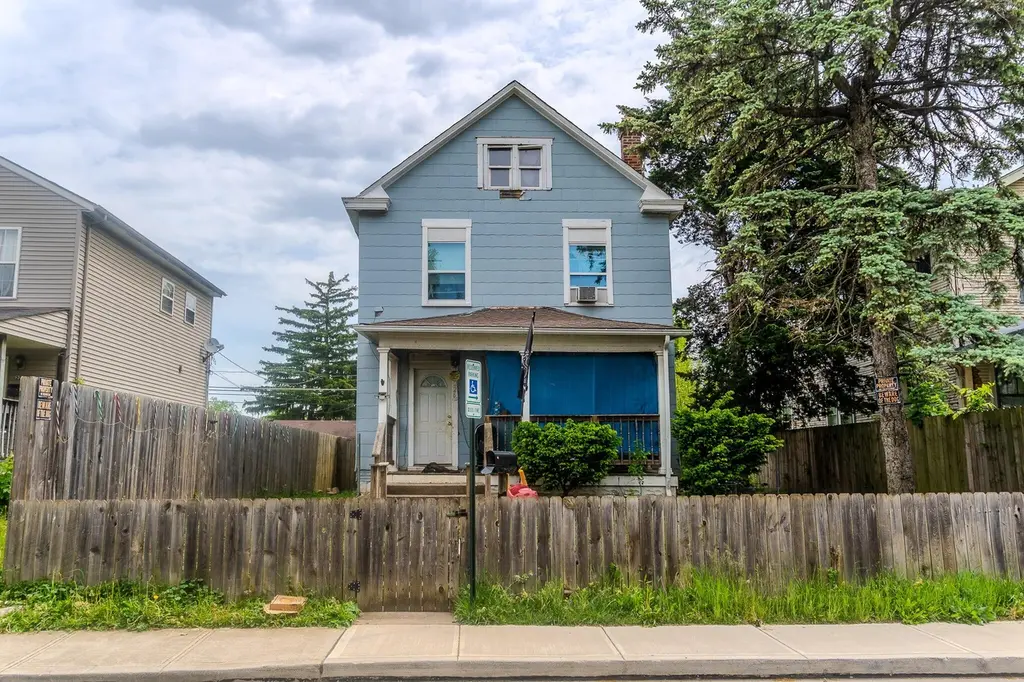
226 Midland Ave · Columbus, OH
Flood risk 1/10 · Minimal
- FEMA flood zone
- X (unshaded)
- Chance of flooding over 30 yrs
- 0.0%
- Est. flood insurance / yr
- $473 – $860
Fire risk 1/10 · Minimal
- Est. fire insurance / yr
- $713 – $1,323
Heat risk 4/10 · Minor
- Hot days now (above 100°F)
- 7 days/yr
- Hot days in 30 yrs
- 18 days/yr
Wind risk 2/10 · Minimal
- Chance of severe wind over 30 yrs
- 1.0%
Air-quality risk 3/10 · Minor
- Unhealthy air days now
- 1 days/yr
- Unhealthy air days in 30 yrs
- 4 days/yr
Risk factors via First Street. Map © Google.
Why this score? — see what drove the B- grade
The composite is a weighted blend of 9 inputs, each scored 0–100. Each bar is that input's sub-score; the figure is the points it added to the 100-point composite (weight × sub-score).
- Cash flow +30.0/30.0
- 1% rule +10.0/10.0
- DSCR +10.0/10.0
- ARV discount +7.5/15.0
- Livability +4.0/5.0
- Rent growth +3.7/5.0
- Condition / age +2.5/5.0
- Schools +1.7/10.0
- Appreciation +0.0/10.0
$86,000
🖨 Deal sheet (PDF) 📄 Offer letter ✓ Due diligence
Listing remarks MLS
A handyman or rehabbers dream come true. Lots of potential for the first time buyer or fix it for flip or rental. It has 3rd floor with the 4th bedroom or home office. some newer windows. It has a full basement with lots of storage. The property does need work but is priced accordingly. Call today to see this daimond in the rough. All offers will be considered, call to set up a showing today.
Key facts
- 5,227 sq ft lot
- Built 1920
- Listed 14 days
Property features AI
Exterior
- Parking: On-street parking
- Utilities: Public water; Public sewer
- Home design: Single family residence; Two levels; Built in 1920; No shared/common walls
- Construction: Built 1920
- Exterior features: Block foundation; Lot approximately 0.12 acre
Interior
- Flooring: Wood flooring; Carpeted areas
- Bathrooms: 1 full bathroom
- Heating & cooling: Forced air heating; Central air conditioning
- Interior features: Decorative fireplace; Insulated partial windows; Full basement
Neighborhood map
What this means for you Summary
Snapshot
- This is a 4-bed/1.0-bath single-family listed at $86k.
Deal economics
- At list price, monthly cash flow is $544 ($7k/yr) — positive.
- The deal already cash-flows at list — no discount required.
- Meets the 1% rule at list price ($2k rent vs $86k).
- Cap rate 13.9% vs local median 3.8% in Columbus — top-decile yield for the area; either an underpriced asset or a hidden risk that comps aren't pricing in. Stress-test before assuming the spread holds.
Location & tenants
- Location reads 81/100 on livability (#97 in OH, #1,491 nationally) — a professional / high-income tenant draw. Strengths: commute A+, cost of living A+, housing A+; Watch: employment C-, crime F.
- Columbus City School District (urban): math 15% / reading 26% proficiency, ranked #626 of 656 in OH (top 95%) — low school quality limits family demand, transient renter base, plan for 1-2y turnover; 72% free/reduced lunch — lower-income household profile, screen leases tightly.
- Market conditions: Rents rising fast (+4.6%/yr); 147 active listings in the ZIP; 40 comparable units currently listed for rent nearby; rentals at typical pace (median 21d on market — plan ~3-4 weeks tenant-placement turnaround); 8,139 units permitted in Franklin County in 2024 (5,940 in 5+ unit buildings).
- This rent runs 39% of the median local income ($47k/yr) — at the standard rent-burdened threshold; future hikes will face affordability resistance.
Forward outlook
- Local home prices are declining (-3.0%/yr); year-one equity from $595 of loan paydown is wiped out by about $3k of value loss. Plan a longer hold.
- Franklin County population projected at +34% by 2050 — long-run rental-demand tailwind backs the buy-and-hold thesis.
- At projected returns (-3.0% appreciation + 4.6% rent growth), your $24k cash investment doubles in ~5 years — after that, you're playing with house money.
Negotiation context
- Only 14 days on market — expect competitive offers; lowballing is unlikely to land.
- 4 sale attempts since 9y ago with the ask held roughly flat each time — persistent listings suggest the price (not the market) is what's stuck; bring a comps-based counter.
- Current owner paid $12k; list at $86k implies a 617% gain — meaningful room to come down on a strong offer.
Risks & watch-outs
- Watch-outs: built in 1920 — expect roof / HVAC / electrical / plumbing capex.
Questions for the listing agent
- Built in 1920 — when were the roof, HVAC, electrical panel, plumbing, and water heater last replaced?
- Is there a deadline driving the sale (1031 exchange, divorce, estate, relocation)? That informs how much negotiation room exists.
- Crime grade is F in this area — have there been break-ins, vandalism, or insurance claims at this property in the last 3 years? What carrier currently insures it and at what premium?
- What's the average days-on-market for RENTAL listings here right now (not sales)? A rising rental-DOM trend means longer vacancies and softer asking-rent achievability than the comps imply.
- What's the recent tenant-quality profile in this submarket — average credit score on applications, eviction rate, late-payment / NSF rate, and stable-employment percentage? A property-management company in the area should have these aggregated.
- How much new for-sale + rental construction is in the pipeline within 1–3 miles? Heavy new supply typically softens prices + rents 12–24 months out; constrained supply supports both.
Investment metrics
- 1% rule
- 1.77% ✓
- Cap rate
- 13.88%
- Cash-on-cash
- 27.09%
- DSCR
- 2.21
- GRM
- 4.7
CMA / ARV
- ARV (on-the-fly)
- $185,168
- Comps found
- 12
Show comp detail 12 sales within ~0.75 mi
| Address | Dist | Beds/Ba | Sqft | Sold | Price | $/sf | Match |
|---|---|---|---|---|---|---|---|
| 237 Midland Ave | 0.03mi | 4/1.0 | 1,452 (+11%) | 1mo | $159,000 | $110 | 79 |
| 283 Whitethorne Ave | 0.09mi | 3/1.5 (-1) | 1,376 (+6%) | 1mo | $170,000 | $124 | 79 |
| 1930 Floral Ave | 0.38mi | 3/1.5 (-1) | 1,328 (+2%) | 1mo | $220,000 | $166 | 72 |
| 479 Nashoba Ave | 0.48mi | 3/1.0 (-1) | 1,332 (+2%) | 2mo | $119,000 | $89 | 68 |
| 246 S Terrace Ave | 0.47mi | 3/1.0 (-1) | 1,232 (-6%) | 0mo | $205,000 | $166 | 64 |
| 321 Belvidere Ave | 0.18mi | 3/1.0 (-1) | 1,494 (+15%) | 1mo | $85,000 | $57 | 61 |
| 557 Woodbury Ave | 0.68mi | 3/1.0 (-1) | 1,312 (+1%) | 2mo | $199,000 | $152 | 61 |
| 427 S Richardson Ave | 0.63mi | 4/1.0 | 1,378 (+6%) | 0mo | $160,000 | $116 | 61 |
| 1924 Sullivant Ave | 0.43mi | 3/2.5 (-1) | 1,360 (+4%) | 2mo | $210,000 | $154 | 60 |
| 330 S Richardson Ave | 0.56mi | 3/1.5 (-1) | 1,381 (+6%) | 2mo | $196,000 | $142 | 56 |
| 229 S Richardson Ave | 0.56mi | 3/1.0 (-1) | 1,168 (-10%) | 1mo | $165,000 | $141 | 51 |
| 121 N Terrace Ave | 0.75mi | 3/2.0 (-1) | 1,447 (+11%) | 1mo | $230,000 | $159 | 37 |
Match score weights: distance 35% · size 25% · config 20% · recency 20%. Top-matched comps best support the ARV.
Projected returns pro-forma
-3.0% appreciation · 4.61% rent growth · sell at horizon
- IRR
- 23.0%
- Equity multiple
- 1.97×
- Total profit
- $23,257
- Equity at exit
- $12,823
- IRR
- 32.1%
- Equity multiple
- 4.14×
- Total profit
- $75,704
- Equity at exit
- $7,436
Cash invested: $24,080 (down + closing). Projections, not guarantees.
Landlord ↔ Tenant lean methodology
- Overall (STATE)
- 73 Landlord-Friendly
- State Ohio
- 73 Landlord-Friendly · R+6
- County
- — inherits STATE
- City
- — inherits STATE
ZIP-level market 43223
- Rents YoY
- 4.6%
- Active inventory
- 147
- Price-to-rent
- 4.7×
Monthly cashflow live
- Estimated rent
- $1,520 high interval (Pro) →
- Mortgage (P&I)
- −$451
- Tax from tax record
- −$171 /mo · $2,048/yr
- Insurance
- −$36
- HOA
- −$0
- Vacancy / Maint / Mgmt
- −$319
- Net cashflow
- $544
Break-even live
Sensitivity live
| Price | -10% $592 | -5% $568 | +0% $544 | +5% $519 | +10% $495 |
|---|---|---|---|---|---|
| Rent | -10% $424 | -5% $484 | +0% $544 | +5% $604 | +10% $664 |
| Rate | -1.0pp $587 | -0.5pp $566 | base $544 | +0.5pp $521 | +1.0pp $499 |
UW: 25.0% down · 7.5% · 30yr · 1.5% tax · 5.0% vac · 8.0% maint · 8.0% mgmt
Financing live
Cash to close
- Down payment
- $21,500
- Closing costs
- $2,580
- Reserves months
- —
- Total cash needed
- —
Loan-product check · same deal, 3 products live
Conventional
25% down · 7.5% · 30yr
- Down + closing
- —
- Monthly P&I
- —
- Monthly cashflow
- —
- DSCR
- —
- Eligible?
- —
Personal DTI + credit; lowest rate.
DSCR
20% down · 8.5% · 30yr
- Down + closing
- —
- Monthly P&I
- —
- Monthly cashflow
- —
- DSCR
- —
- Eligible?
- —
No personal income docs; deal must DSCR.
Hard money
10% down · 12.0% · 12mo
- Down + closing
- —
- Monthly P&I
- —
- Monthly cashflow
- —
- DSCR
- —
- Eligible?
- —
Short-term bridge; refi at stabilization.
Rent comps 40 comps
| Address | Beds | Baths | Sqft | Rent | $/sqft | DOM | Units | Dist |
|---|---|---|---|---|---|---|---|---|
| 95-97 Whitethorne Ave Columbus, OH | 3.0 | 1.5 | 1260 | $1,375 | $1.09 | 4d | 1 | 0.18mi |
| 95-97 Whitethorne Ave Columbus, OH | 3.0 | 1.5 | 1260 | $1,475 | $1.17 | 20d | 1 | 0.18mi |
| 2205 Sullivant Ave Columbus, OH | 3.0 | 1.0 | 1275 | $1,200 | $0.94 | 44d | 1 | 0.33mi |
| 252-254 S Wayne Ave Unit 254 Columbus, OH | 3.0 | 1.0 | 1120 | $1,300 | $1.16 | 18d | 1 | 0.35mi |
| 1964 Sullivant Ave Columbus, OH | 4.0 | 2.0 | 1580 | $1,650 | $1.04 | 24d | 1 | 0.37mi |
| 41 S Oakley Ave Columbus, OH | 3.0 | 1.5 | 1428 | $1,550 | $1.09 | 44d | 1 | 0.41mi |
| 329 S Wayne Ave Columbus, OH | 3.0 | 1.0 | 1120 | $1,425 | $1.27 | 4d | 1 | 0.42mi |
| 548 S Wayne Ave Columbus, OH | 3.0 | 1.0 | 1008 | $1,225 | $1.22 | 20d | 1 | 0.57mi |
| 521-523 S Wayne Ave Columbus, OH | 3.0 | 1.0 | 1092 | $1,195 | $1.09 | 4d | 1 | 0.57mi |
| 29 S Terrace Ave Columbus, OH | 3.0 | 1.0 | 1144 | $1,260 | $1.10 | 24d | 1 | 0.59mi |
| 27-29 N Terrace Ave Unit 29 Columbus, OH | 3.0 | 1.0 | 1144 | $1,260 | $1.10 | 24d | 1 | 0.59mi |
| 488 Woodbury Ave Columbus, OH | 3.0 | 1.5 | 1222 | $1,250 | $1.02 | 44d | 1 | 0.60mi |
| 39 Eldon Ave Unit 1 Columbus, OH | 3.0 | 2.0 | 1043 | $1,500 | $1.44 | 24d | 1 | 0.63mi |
| 543 Woodbury Ave Unit NA Columbus, OH | 3.0 | 1.0 | 1308 | $1,645 | $1.26 | 15d | 1 | 0.64mi |
| 2545-2547 Sullivant Ave Columbus, OH | 3.0 | 1.0 | 1064 | $1,100 | $1.03 | 11d | 1 | 0.68mi |
| 133 N Eureka Ave Columbus, OH | 3.0 | 1.0 | 1484 | $1,350 | $0.91 | 13d | 1 | 0.68mi |
| 692 S Wheatland Ave Columbus, OH | 3.0 | 1.0 | 1608 | $1,547 | $0.96 | 44d | 1 | 0.69mi |
| 695 S Eureka Ave Columbus, OH | 3.0 | 1.0 | 1344 | $1,425 | $1.06 | 22d | 1 | 0.78mi |
| 80 S Warren Ave Columbus, OH | 3.0 | 1.0 | 1258 | $1,345 | $1.07 | 44d | 1 | 0.78mi |
| 80 S Warren Ave Columbus, OH | 3.0 | 1.0 | 1258 | $1,345 | $1.07 | 4d | 1 | 0.78mi |
| 54 N Ogden Ave Columbus, OH | 3.0 | 1.0 | 1176 | $950 | $0.81 | 3d | 1 | 0.79mi |
| 432 Catherine St Columbus, OH | 3.0 | 1.0 | 1073 | $1,325 | $1.23 | 15d | 1 | 0.81mi |
| 432 Catherine St Columbus, OH | 3.0 | 1.0 | 1073 | $1,325 | $1.23 | 13d | 1 | 0.81mi |
| 791-793 Butler Ave Unit 791 Columbus, OH | 3.0 | 1.0 | 1000 | $1,395 | $1.40 | 4d | 1 | 0.82mi |
| 2676 Sullivant Ave Columbus, OH | 3.0 | 1.0 | 1524 | $1,200 | $0.79 | 44d | 1 | 0.84mi |
| 616-618 S Ogden Ave Columbus, OH | 3.0 | 1.0 | 1100 | $1,125 | $1.02 | 44d | 1 | 0.87mi |
| 661-663 S Burgess Ave Columbus, OH | 3.0 | 1.0 | 1100 | $1,028 | $0.93 | 44d | 1 | 0.88mi |
| 92 S Hague Ave Columbus, OH | 3.0 | 2.0 | 1456 | $1,400 | $0.96 | 24d | 1 | 0.89mi |
| 2709-2711 Sullivant Ave Columbus, OH | 3.0 | 2.0 | 1344 | $1,380 | $1.03 | 4d | 1 | 0.89mi |
| 2709-2711 Sullivant Ave Unit 2709 Columbus, OH | 3.0 | 2.0 | 1344 | $1,380 | $1.03 | 4d | 1 | 0.89mi |
| 32 Schultz Ave Columbus, OH | 3.0 | 1.0 | 1218 | $1,250 | $1.03 | 22d | 1 | 0.92mi |
| 608 Racine Ave #610 Columbus, OH | 3.0 | 1.0 | 1168 | $1,195 | $1.02 | 44d | 1 | 0.96mi |
| 58 Stevens Ave Columbus, OH | 3.0 | 1.0 | 1176 | $1,250 | $1.06 | 44d | 1 | 1.00mi |
| 394 S Guilford Ave Columbus, OH | 3.0 | 1.5 | 1404 | $1,450 | $1.03 | 8d | 1 | 1.04mi |
| 137 N Guilford Ave Columbus, OH | 4.0 | 2.0 | 1456 | $1,850 | $1.27 | 44d | 1 | 1.08mi |
| 2735 Sutton Ave Columbus, OH | 3.0 | 1.0 | 1099 | $1,175 | $1.07 | 4d | 1 | 1.08mi |
| 120 S Central Ave Columbus, OH | 1.0–3.0 | 1.0–2.0 | 944 | $1,295 | $1.37 | 15d | 12 | 1.10mi |
| 43-45 N Chase Ave Unit 43 Columbus, OH | 3.0 | 1.0 | 1200 | $1,400 | $1.17 | 11d | 1 | 1.11mi |
| 43 N Chase Ave Columbus, OH | 3.0 | 1.0 | 1200 | $1,400 | $1.17 | 11d | 1 | 1.12mi |
| 43 N Roys Ave Columbus, OH | 3.0 | 1.5 | 1332 | $1,599 | $1.20 | 24d | 1 | 1.18mi |
Listing history 10 events
-
2026-05-16status Active
-
2026-05-11status Pending
-
2026-05-09$86,000 Active
-
2026-05-08historical $86,000
-
2020-08-01historical
-
2020-03-17$116,900 Active
-
2017-02-10soldstatus $12,000 Closed 396-char remark
Show marketing remark (396 chars)
A handyman or rehabbers dream come true. Lots of potential for the first time buyer or fix it for flip or rental. It has 3rd floor with the 4th bedroom or home office. some newer windows. It has a full basement with lots of storage. The property does need work but is priced accordingly. Call today to see this daimond in the rough. All offers will be considered, call to set up a showing today.
-
2017-02-02status Pending 396-char remark
Show marketing remark (396 chars)
A handyman or rehabbers dream come true. Lots of potential for the first time buyer or fix it for flip or rental. It has 3rd floor with the 4th bedroom or home office. some newer windows. It has a full basement with lots of storage. The property does need work but is priced accordingly. Call today to see this daimond in the rough. All offers will be considered, call to set up a showing today.
-
2017-01-18$14,997 Active 396-char remark
Show marketing remark (396 chars)
A handyman or rehabbers dream come true. Lots of potential for the first time buyer or fix it for flip or rental. It has 3rd floor with the 4th bedroom or home office. some newer windows. It has a full basement with lots of storage. The property does need work but is priced accordingly. Call today to see this daimond in the rough. All offers will be considered, call to set up a showing today.
-
1994-12-20soldstatus $37,938
ⓘ Source: listings_history table (triggers on properties + properties_extension) + one-shot
backfill from property_details.listing_events for pre-trigger history.
Tax reassessment forecast OH · Partial reset (capped growth)
- Current annual tax
- $2,048 · $171/mo
- Projected year-2 tax
- $2,048 · $171/mo
- Expected delta
- $0/yr ($0/mo · 0.0%)
ⓘ Screening estimate from a state-policy table — verify with the county assessor before closing.
Climate risk First Street
- Flood 1/10 Low FEMA zone X (unshaded) · 0% chance over 30 yrs
- Wildfire 1/10 Low
- Heat 4/10 Moderate 7 d/yr ≥100°F today · 18 d/yr by 30 yrs out
- Wind 2/10 Low 100% chance of damaging wind over 30 yrs
- Air quality 3/10 Moderate 1 unhealthy d/yr today · 4 by 30 yrs out
Nearby sold comps map
Loading sold comps map…
Walkable amenities ~0.75 mi
Loading nearby amenities…
Taxation est. · year 1
- Rental income
- $18,246
- − Mortgage interest
- −$4,817
- − Property taxes
- −$2,048
- − Insurance
- −$430
- − Repairs & maintenance
- −$1,460
- − Management
- −$1,460
- − Depreciation
- −$2,502
- Taxable income
- $5,529
- Est. tax owed @ 24.0%
- −$1,327
- After-tax cash flow
- $5,197/yr
For passive investors: Depreciation is non-cash, so a rental often shows a tax loss while cash-flowing — sheltering income. Rental losses are passive: they offset passive income freely, and up to $25,000/yr can offset ordinary (W-2) income if you actively participate and your MAGI is under $100k (phasing out to $0 by $150k); unused losses carry forward. On sale, claimed depreciation is recaptured at up to 25%, and gains may owe capital-gains tax (a 1031 exchange can defer both). Figures are a year-1 estimate at your 24.0% rate — not tax advice; consult a CPA.
Schools (NCES district)
- District
- Columbus City School District
- NCES district ID
- 3904380
- Math proficiency
- 15% ▼ -17.00%
- Reading proficiency
- 26% ▼ -12.00%
- Median HH income
- $38,483
- Composite
- 17.19/100
- National rank
- #9105
- State rank
- #626 of 656 in OH
Livability — Columbus
- Score
- 81/100
- State rank
- #97
- US rank
- #1491
Category grades
Schools grade is shown separately in the Schools card above.
Census & demographics
- Census place
- Columbus, OH
- County
- Franklin County · 1,351,780 people
- City population
- 612,189
- Metro
- Columbus, OH
- Population (ZIP)
- 28,187
- Household income
- $46,911
- Rent vs Own
- Severe rent burden
- 1689.0
Population outlook (Franklin County) Hauer SSP2
- Today (2025)
- 1,456,139 people
- By 2030
- 1,556,890 · +6.9%
- By 2040
- 1,757,349 · +20.7%
- By 2050
- 1,950,539 · +34.0%
- By 2075
- 2,376,171 · +63.2%
- By 2100
- 2,636,796 · +81.1%
Race, ethnicity, and origin ACS 2023
- Neighborhood character
- Diverse neighborhood (Simpson 0.55)
- Race & ethnicity
- White 63% Black 22% Two or more races 8% Hispanic / Latino 8%
- Hispanic origin (detail)
- Mexican 4% Puerto Rican 3%
- Common ancestry
- Romanian 4% Italian 1% Slovak 1%
- Foreign-born
- 5% · Canada
- Languages at home
- 91% English-only · Spanish 5%
Political lean MEDSL · Franklin
- 2024 margin
- Strong D (+28.4) · D 63.7% · R 35.3% · Other 1.0%
- 2008→2024 swing
- +7.7pp toward D · 2008: 20.7pp · 2024: 28.4pp
- All cycles
- 2024: D+28.4 2020: D+31.4 2016: D+25.9 2012: D+21.7 2008: D+20.7
Not yet ingested
- Civics
- —
Market trends
- HPI YoY
- ▼ -135.33%
- Current HPI
- 211.6742
- Rent YoY
- ▲ 4.61%
- Metro
- Columbus, OH
- State GDP YoY
- ▲ 1.98%
- F500 in state
- 48
Industry mix (Fortune 500 HQ in OH)
| Industry | F500 HQs | Revenue |
|---|---|---|
| Insurance | 3 | $145B |
|
||
| Industrial Machinery | 3 | $49B |
|
||
| Financial Services | 3 | $24B |
|
||
| Consumer Goods | 2 | $93B |
|
||
| Aerospace / Defense | 2 | $47B |
|
||
| Utilities | 2 | $33B |
|
||
Price history
+126.7% since first listed10 events — show timeline
- 2026-05-16 Relisted — CBRMLS
- 2026-05-11 Pending — CBRMLS
- 2026-05-09 Listed $86,000 CBRMLS
- 2026-05-08 Coming Soon $86,000 CBRMLS
- 2020-08-01 Listing Removed — CBRMLS
- 2020-03-17 Listed $116,900 CBRMLS
- 2017-02-10 Sold (MLS) $12,000 CBRMLS
- 2017-02-02 Pending — CBRMLS
- 2017-01-18 Listed $14,997 CBRMLS
- 1994-12-20 Sold (Public Records) $37,938 Public Records
Property tax history
+12.7%/yrLatest (2024): $2,048 · -2.8% YoY. Source: county tax records.
Cash-flow waterfall
monthlySold comps — $/sqft
last 12 mo · ≤1 miLoading sold comps…