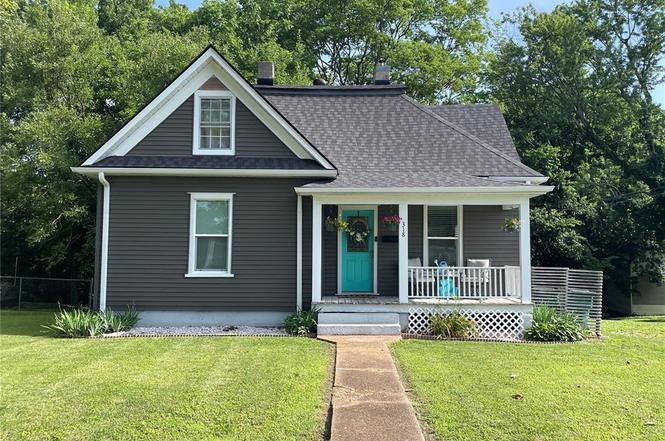
318 Greensferry Rd · Jackson, MO
Flood risk 1/10 · Minimal
- FEMA flood zone
- X (unshaded)
- Chance of flooding over 30 yrs
- 0.0%
- Est. flood insurance / yr
- $473 – $860
Fire risk 3/10 · Minor
- Est. fire insurance / yr
- $1,054 – $1,958
Heat risk 5/10 · Moderate
- Hot days now (above 109°F)
- 7 days/yr
- Hot days in 30 yrs
- 21 days/yr
Wind risk 2/10 · Minimal
- Chance of severe wind over 30 yrs
- 3.0%
Air-quality risk 2/10 · Minimal
- Unhealthy air days now
- 0 days/yr
- Unhealthy air days in 30 yrs
- 1 days/yr
Risk factors via First Street. Map © Google.
Why this score? — see what drove the F grade
The composite is a weighted blend of 9 inputs, each scored 0–100. Each bar is that input's sub-score; the figure is the points it added to the 100-point composite (weight × sub-score).
- Cash flow +8.9/30.0
- ARV discount +8.0/15.0
- Schools +4.0/10.0
- Rent growth +3.6/5.0
- Livability +3.5/5.0
- DSCR +2.5/10.0
- Condition / age +2.5/5.0
- 1% rule +1.6/10.0
- Appreciation +0.0/10.0
$192,000
🖨 Deal sheet 📄 Offer letter ✓ Due diligence
Listing remarks MLS
Adorable remodeled 1.5 story home on a large level lot. Gorgeous original wood floors add tons of character throughout. Second level has spacious bedrooms and private bath. Kitchen features new cabinets, granite counters, and large pantry.
Key facts
- Tree shaded backyard
- New deck
- Updated cabinetry
Tags
Property features AI
Finance
- Other: Private ownership; Above-grade finished area: 1,602 (per Assessor)
- Financial info: Lease not considered; No second mortgage reported
Exterior
- Utilities: Public water; Public sewer; Single-phase electric; Cable available
- Home design: Single family residence; One and one-half levels; Private ownership
- Construction: Vinyl siding; Shingle roof; Block foundation; Basement: block, unfinished; Built (year source: Assessor)
- Exterior features: Deck; Front porch; Back yard; Few trees; Gentle sloping lot
Interior
- Kitchen: Dishwasher; Microwave; Oven; Range; Refrigerator; Granite counters
- Bedrooms: 3 bedrooms total; 2 bedrooms on the main level; 1 bedroom on the upper level
- Flooring: Hardwood flooring
- Bathrooms: 2 full bathrooms total; 1 full bathroom on the main level; 1 full bathroom on the upper level
- Heating & cooling: Forced air heating (natural gas); Central air conditioning; Ceiling fans
- Interior features: Ceiling fans; Granite counters; High ceilings
- Laundry & utility: Washer and dryer included; Gas water heater
Neighborhood map
What this means for you Summary
Snapshot
- This is a 2-bed/1.0-bath single-family listed at $192k.
Deal economics
- At list price, monthly cash flow is $-154 ($-2k/yr) — negative.
- To cash-flow at today's rent, offer at most $165k (14.1% below list).
- To meet the 1% rule (rent ≥ 1% of price), the offer needs to be $126k (34.2% below list).
- Recommended offer: $126k (34.2% below list) — sets the bar for 1% rule.
- Cap rate 5.3% vs local median 3.4% in Jackson — top-decile yield for the area; either an underpriced asset or a hidden risk that comps aren't pricing in. Stress-test before assuming the spread holds.
Location & tenants
- Location reads 69/100 on livability (#160 in MO) — a middle-class / working-renter tenant base. Strengths: crime A+, cost of living A+, housing A+; Watch: amenities F, commute F, health & safety F.
- Jackson R-II (suburban): math 41% / reading 51% proficiency, ranked #73 of 324 in MO (top 22%) — families likely to look elsewhere, expect single-tenant / working-renter base with shorter leases.
- Zoned schools: Orchard Drive Elem. (math 37% / reading 42%, grade F, #537 of 1,115 statewide, top 53%, 388 students, 52% FRL); Jackson Sr. High (math 45% / reading 62%, grade C-, #83 of 521 statewide, top 16%, 1,764 students, 30% FRL).
- Market conditions: Rents rising fast (+4.5%/yr); 176 active listings in the ZIP; solid renter incomes; 81 units permitted in Cape Girardeau County in 2024 (0 in 5+ unit buildings).
Forward outlook
- Local home prices are declining (-3.0%/yr); year-one equity from $1k of loan paydown is wiped out by about $6k of value loss. Plan a longer hold.
- Cape Girardeau County population projected at +17% by 2050 — long-run rental-demand tailwind backs the buy-and-hold thesis.
Negotiation context
- Only 5 days on market — expect competitive offers; lowballing is unlikely to land.
Risks & watch-outs
- Watch-outs: built in 1940 — expect roof / HVAC / electrical / plumbing capex.
- Climate carrying-cost: extreme-heat days projected 7→21/yr by 2055 (HVAC capex compounding) — expect insurance premiums to compound above CPI over the hold.
Questions for the listing agent
- What do current leases actually rent for vs. the listed asking? Can we see a recent rent roll and the last 12 months of T-12 income?
- Built in 1940 — when were the roof, HVAC, electrical panel, plumbing, and water heater last replaced?
- Is there a deadline driving the sale (1031 exchange, divorce, estate, relocation)? That informs how much negotiation room exists.
- The area grade is low — what's the realistic commute time and amenity access for the typical tenant pool here? Any planned neighborhood developments (good or bad) we should know about?
- What's the average days-on-market for RENTAL listings here right now (not sales)? A rising rental-DOM trend means longer vacancies and softer asking-rent achievability than the comps imply.
- What's the recent tenant-quality profile in this submarket — average credit score on applications, eviction rate, late-payment / NSF rate, and stable-employment percentage? A property-management company in the area should have these aggregated.
- How much new for-sale + rental construction is in the pipeline within 1–3 miles? Heavy new supply typically softens prices + rents 12–24 months out; constrained supply supports both.
Investment metrics
- 1% rule
- 0.66% ✗
- Cap rate
- 5.33%
- Cash-on-cash
- -3.43%
- DSCR
- 0.85
- GRM
- 12.7
CMA / ARV
- ARV (on-the-fly)
- $194,250
- Comps found
- 12
Show comp detail 12 sales within ~0.75 mi
| Address | Dist | Beds/Ba | Sqft | Sold | Price | $/sf | Match |
|---|---|---|---|---|---|---|---|
| 826 Odus Dr | 0.38mi | 3/1.0 (+1) | 1,612 (+4%) | 14mo | $209,000 | $130 | 59 |
| 413 Byrd Ct | 0.38mi | 3/2.0 (+1) | 1,450 (-7%) | 8mo | $324,900 | $224 | 56 |
| 509 Blanche St | 0.73mi | 3/2.0 (+1) | 1,551 (-0%) | 4mo | $162,000 | $104 | 53 |
| 1002 Greensferry Rd | 0.69mi | 3/2.0 (+1) | 1,596 (+3%) | 4mo | $118,500 | $74 | 51 |
| 303 E Washington St | 0.33mi | 3/2.0 (+1) | 1,400 (-10%) | 12mo | $264,000 | $189 | 49 |
| 237 Kies Ave | 0.73mi | 3/1.0 (+1) | 1,536 (-1%) | 12mo | $125,000 | $81 | 49 |
| 425 Elm St | 0.61mi | 2/1.5 | 1,600 (+3%) | 19mo | $160,000 | $100 | 49 |
| 414 N Russell | 0.33mi | 3/2.0 (+1) | 1,395 (-10%) | 12mo | $174,900 | $125 | 48 |
| 319 N Russell St | 0.38mi | 3/2.0 (+1) | 1,683 (+8%) | 14mo | $219,000 | $130 | 48 |
| 1016 E Adams St | 0.65mi | 3/1.0 (+1) | 1,428 (-8%) | 8mo | $173,500 | $121 | 45 |
| 901 E Jefferson St | 0.64mi | 3/2.0 (+1) | 1,527 (-2%) | 17mo | $198,000 | $130 | 44 |
| 304 Morgan St | 0.66mi | 3/2.0 (+1) | 1,693 (+9%) | 8mo | $209,900 | $124 | 39 |
Match score weights: distance 35% · size 25% · config 20% · recency 20%. Top-matched comps best support the ARV.
Projected returns pro-forma
-3.0% appreciation · 4.49% rent growth · sell at horizon
- IRR
- -20.7%
- Equity multiple
- 0.27×
- Total profit
- $-39,058
- Equity at exit
- $28,628
- IRR
- -11.5%
- Equity multiple
- 0.28×
- Total profit
- $-38,834
- Equity at exit
- $16,601
Cash invested: $53,760 (down + closing). Projections, not guarantees.
Landlord ↔ Tenant lean methodology
- Overall (STATE)
- 81 Strongly Landlord-Friendly
- State Missouri
- 81 Strongly Landlord-Friendly · R+10
- County
- — inherits STATE
- City
- — inherits STATE
ZIP-level market 63755
- Rents YoY
- 4.5%
- Active inventory
- 176
- Price-to-rent
- 12.7×
Monthly cashflow live
- Estimated rent
- $1,263 medium interval (Pro) →
- Mortgage (P&I)
- −$1,007
- Tax from tax record
- −$65 /mo · $775/yr
- Insurance
- −$80
- HOA
- −$0
- Vacancy / Maint / Mgmt
- −$265
- Net cashflow
- $-154
Break-even live
UW: 25.0% down · 7.5% · 30yr · 1.5% tax · 5.0% vac · 8.0% maint · 8.0% mgmt
Financing live
Cash to close
- Down payment
- $48,000
- Closing costs
- $5,760
- Reserves months
- —
- Total cash needed
- —
Loan-product check · same deal, 3 products live
Conventional
25% down · 7.5% · 30yr
- Down + closing
- —
- Monthly P&I
- —
- Monthly cashflow
- —
- DSCR
- —
- Eligible?
- —
Personal DTI + credit; lowest rate.
DSCR
20% down · 8.5% · 30yr
- Down + closing
- —
- Monthly P&I
- —
- Monthly cashflow
- —
- DSCR
- —
- Eligible?
- —
No personal income docs; deal must DSCR.
Hard money
10% down · 12.0% · 12mo
- Down + closing
- —
- Monthly P&I
- —
- Monthly cashflow
- —
- DSCR
- —
- Eligible?
- —
Short-term bridge; refi at stabilization.
Listing history 6 events
-
2026-06-19days on market $192,000 Coming Soon 5 DOM
-
2026-06-18days on market $192,000 Coming Soon 4 DOM
-
2026-06-17days on market $192,000 Coming Soon 3 DOM
-
2026-06-16days on market $192,000 Coming Soon 2 DOM
-
2026-06-15remarks 662-char remark
-
2026-06-15$192,000 Coming Soon 1 DOM
ⓘ Source: listings_history table (triggers on properties + properties_extension) + one-shot
backfill from property_details.listing_events for pre-trigger history.
Tax reassessment forecast MO · Resets to sale price
- Current annual tax
- $775 · $65/mo
- Projected year-2 tax
- $1,862 · $155/mo
- Expected delta
- +$1,088/yr (+$91/mo · 140.4%)
ⓘ Screening estimate from a state-policy table — verify with the county assessor before closing.
Climate risk First Street
- Flood 1/10 Low FEMA zone X (unshaded) · 0% chance over 30 yrs
- Wildfire 3/10 Moderate
- Heat 5/10 Major 7 d/yr ≥109°F today · 21 d/yr by 30 yrs out
- Wind 2/10 Low 3% chance of damaging wind over 30 yrs
- Air quality 2/10 Low 0 unhealthy d/yr today · 1 by 30 yrs out
Nearby sold comps map
Loading sold comps map…
Walkable amenities ~0.75 mi
Loading nearby amenities…
Taxation est. · year 1
- Rental income
- $15,158
- − Mortgage interest
- −$10,755
- − Property taxes
- −$775
- − Insurance
- −$960
- − Repairs & maintenance
- −$1,213
- − Management
- −$1,213
- − Depreciation
- −$5,585
- Taxable loss
- −$5,343
- Est. tax savings @ 24.0%
- +$1,282
- After-tax cash flow
- $-560/yr
For passive investors: Depreciation is non-cash, so a rental often shows a tax loss while cash-flowing — sheltering income. Rental losses are passive: they offset passive income freely, and up to $25,000/yr can offset ordinary (W-2) income if you actively participate and your MAGI is under $100k (phasing out to $0 by $150k); unused losses carry forward. On sale, claimed depreciation is recaptured at up to 25%, and gains may owe capital-gains tax (a 1031 exchange can defer both). Figures are a year-1 estimate at your 24.0% rate — not tax advice; consult a CPA.
Schools (NCES district)
- District
- Jackson R-II
- NCES district ID
- 2915600
- Math proficiency
- 41% ▼ -6.00%
- Reading proficiency
- 51% ▬ 0.00%
- Median HH income
- $52,935
- Composite
- 39.72/100
- National rank
- #3898
- State rank
- #73 of 324 in MO
Livability — Jackson
- Score
- 69/100
- State rank
- #160
- US rank
- #8843
Category grades
Schools grade is shown separately in the Schools card above.
Census & demographics
- Census place
- Jackson, MO
- County
- Cape Girardeau County · 75,175 people
- City population
- 27,629
- Metro
- Cape Girardeau, MO-IL
- Population (ZIP)
- 27,629
- Household income
- $78,750
- Rent vs Own
- Severe rent burden
- 354.0
Population outlook (Cape Girardeau County) Hauer SSP2
- Today (2025)
- 84,807 people
- By 2030
- 88,016 · +3.8%
- By 2040
- 93,914 · +10.7%
- By 2050
- 99,541 · +17.4%
- By 2075
- 114,527 · +35.0%
- By 2100
- 121,718 · +43.5%
Race, ethnicity, and origin ACS 2023
- Neighborhood character
- Predominantly White (92%)
- Race & ethnicity
- White 92% Two or more races 4% Hispanic / Latino 3% Black 2%
- Common ancestry
- Slovak 2% Italian 2% Lithuanian 1%
- Foreign-born
- 1% · Canada
- Languages at home
- 98% English-only · Spanish 1%
Political lean MEDSL · Cape Girardeau
- 2024 margin
- Solid R (+46.5) · D 26.2% · R 72.7% · Other 1.1%
- 2008→2024 swing
- -12.9pp toward R · 2008: -33.6pp · 2024: -46.5pp
- All cycles
- 2024: R+46.5 2020: R+45.0 2016: R+50.1 2012: R+43.8 2008: R+33.6
Not yet ingested
- Civics
- —
Market trends
- HPI YoY
- ▼ -120.83%
- Current HPI
- 179.1136
- Rent YoY
- ▲ 4.49%
- Metro
- Cape Girardeau, MO-IL
- State GDP YoY
- ▲ 1.84%
- F500 in state
- 20
Industry mix (Fortune 500 HQ in MO)
| Industry | F500 HQs | Revenue |
|---|---|---|
| Healthcare | 1 | $163B |
|
||
| Insurance | 1 | $21B |
|
||
| Industrial Technology | 1 | $17B |
|
||
| Retail | 1 | $16B |
|
||
| Industrial Distribution | 1 | $10B |
|
||
| Utilities | 1 | $9B |
|
||
Price history
+55.0% since first listed4 events — show timeline
- 2026-06-14 Coming Soon $192,000 MARIS as Distributed by MLS Grid
- 2019-03-12 Sold (Public Records) — Public Records
- 2019-03-11 Sold (MLS) — MARIS as Distributed by MLS Grid
- 2019-01-31 Listed $123,900 MARIS as Distributed by MLS Grid
Property tax history
+1.8%/yrLatest (2025): $775 · +5.1% YoY. Source: county tax records.
Cash-flow waterfall
monthlySold comps — $/sqft
last 12 mo · ≤1 miLoading sold comps…