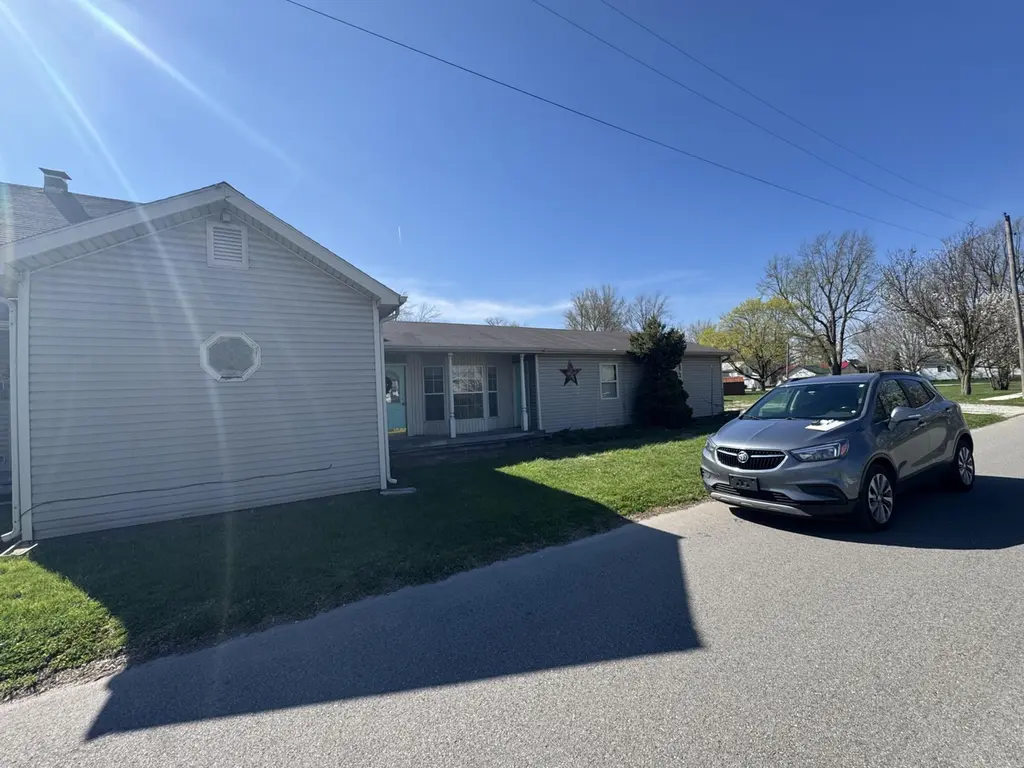
202 W Walnut St · Akron, IN
Flood risk 1/10 · Minimal
- FEMA flood zone
- X (unshaded)
- Chance of flooding over 30 yrs
- 0.0%
- Est. flood insurance / yr
- $473 – $860
Fire risk 1/10 · Minimal
- Est. fire insurance / yr
- $717 – $1,331
Heat risk 3/10 · Minor
- Hot days now (above 100°F)
- 7 days/yr
- Hot days in 30 yrs
- 16 days/yr
Wind risk 2/10 · Minimal
- Chance of severe wind over 30 yrs
- —
Air-quality risk 3/10 · Minor
- Unhealthy air days now
- 1 days/yr
- Unhealthy air days in 30 yrs
- 3 days/yr
Risk factors via First Street. Map © Google.
Why this score? — see what drove the C- grade
The composite is a weighted blend of 9 inputs, each scored 0–100. Each bar is that input's sub-score; the figure is the points it added to the 100-point composite (weight × sub-score).
- Cash flow +15.8/30.0
- ARV discount +13.9/15.0
- DSCR +4.9/10.0
- Livability +3.9/5.0
- Schools +3.5/10.0
- 1% rule +3.1/10.0
- Rent growth +2.5/5.0
- Condition / age +2.5/5.0
- Appreciation +0.0/10.0
$149,000
🖨 Deal sheet (PDF) 📄 Offer letter ✓ Due diligence
Listing remarks
Charming 3-bedroom, 2-bath home offering 1,886 sq ft of comfortable living space in a quiet Akron neighborhood. Bright interiors feature spacious living areas, a functional layout, and plenty of natural light. The kitchen provides ample storage and flows easily into the dining space, ideal for everyday living. Generous bedrooms and a versatile layout add flexibility for your needs. Convenient location near local amenities. Property sold AS-IS
Key facts
- 8,451 sq ft lot
- 2 garage spots
- Built 1900
Neighborhood map
What this means for you Summary
Snapshot
- This is a 3-bed/2.0-bath single-family listed at $149k.
Deal economics
- At list price, monthly cash flow is $68 ($817/yr) — positive.
- The deal already cash-flows at list — no discount required.
- To meet the 1% rule (rent ≥ 1% of price), the offer needs to be $121k (18.5% below list).
- Recommended offer: $121k (18.5% below list) — sets the bar for 1% rule.
Location & tenants
- Location reads 77/100 on livability (#44 in IN, #3,242 nationally) — a middle-class / working-renter tenant base. Strengths: crime A+, cost of living A+, housing A+; Watch: amenities F, commute F.
- Tippecanoe Valley School Corporation (rural): math 40% / reading 42% proficiency, ranked #126 of 301 in IN (top 42%) — families likely to look elsewhere, expect single-tenant / working-renter base with shorter leases.
- Zoned schools: Mentone Elementary School (math 52% / reading 37%, grade F, #379 of 994 statewide, top 41%, 440 students, 54% FRL); Tippecanoe Valley Middle School (math 38% / reading 39%, grade F, #132 of 330 statewide, top 41%, 409 students, 58% FRL); Tippecanoe Valley High School (math 32% / reading 62%, grade D-, #143 of 369 statewide, top 44%, 545 students, 49% FRL).
- Market conditions: 9 active listings in the ZIP; 23 units permitted in Fulton County in 2024 (0 in 5+ unit buildings).
Forward outlook
- Local home prices are declining (-3.0%/yr); year-one equity from $1k of loan paydown is wiped out by about $4k of value loss. Plan a longer hold.
- Fulton County population projected at -13% by 2050 — secular population decline; favor cash flow + early exit over multi-decade hold.
Negotiation context
- Only 5 days on market — expect competitive offers; lowballing is unlikely to land.
Risks & watch-outs
- Watch-outs: built in 1900 — expect roof / HVAC / electrical / plumbing capex.
Questions for the listing agent
- Built in 1900 — when were the roof, HVAC, electrical panel, plumbing, and water heater last replaced?
- Is there a deadline driving the sale (1031 exchange, divorce, estate, relocation)? That informs how much negotiation room exists.
- Schools are D-rated, which usually means shorter tenancies and higher turnover. Who's the typical renter profile here, and what's been the actual vacancy rate?
- What's the average days-on-market for RENTAL listings here right now (not sales)? A rising rental-DOM trend means longer vacancies and softer asking-rent achievability than the comps imply.
- What's the recent tenant-quality profile in this submarket — average credit score on applications, eviction rate, late-payment / NSF rate, and stable-employment percentage? A property-management company in the area should have these aggregated.
- How much new for-sale + rental construction is in the pipeline within 1–3 miles? Heavy new supply typically softens prices + rents 12–24 months out; constrained supply supports both.
Investment metrics
- 1% rule
- 0.81% ✗
- Cap rate
- 6.84%
- Cash-on-cash
- 1.96%
- DSCR
- 1.09
- GRM
- 10.2
CMA / ARV
- ARV (on-the-fly)
- $173,512
- Comps found
- 6
Show comp detail 6 sales within ~0.75 mi
| Address | Dist | Beds/Ba | Sqft | Sold | Price | $/sf | Match |
|---|---|---|---|---|---|---|---|
| 202 W Walnut St | 0.00mi | 3/2.0 | 1,896 (+0%) | 0mo | $149,000 | $79 | 99 |
| 308 S Pine St | 0.51mi | 3/2.0 | 1,824 (-3%) | 3mo | $172,000 | $94 | 69 |
| 110 N Whittenberger St | 0.12mi | 3/1.0 | 2,022 (+7%) | 13mo | $180,000 | $89 | 68 |
| 710 E Rochester St. St | 0.46mi | 3/1.0 | 1,805 (-4%) | 1mo | $172,000 | $95 | 67 |
| 306 W Rochester St | 0.11mi | 3/1.0 | 1,650 (-12%) | 8mo | $150,000 | $91 | 64 |
| 306 E Rochester St | 0.21mi | 3/1.0 | 1,685 (-11%) | 9mo | $155,000 | $92 | 61 |
Match score weights: distance 35% · size 25% · config 20% · recency 20%. Top-matched comps best support the ARV.
Projected returns pro-forma
-3.0% appreciation · 3.0% rent growth · sell at horizon
- IRR
- -13.2%
- Equity multiple
- 0.52×
- Total profit
- $-19,877
- Equity at exit
- $22,216
- IRR
- -4.4%
- Equity multiple
- 0.71×
- Total profit
- $-11,999
- Equity at exit
- $12,883
Cash invested: $41,720 (down + closing). Projections, not guarantees.
Landlord ↔ Tenant lean methodology
- Overall (STATE)
- 90 Strongly Landlord-Friendly
- State Indiana
- 90 Strongly Landlord-Friendly · R+11
- County
- — inherits STATE
- City
- — inherits STATE
ZIP-level market 46910
- Home prices YoY
- -13.1%
- Active inventory
- 9
- Price-to-rent
- 10.2×
Monthly cashflow live
- Estimated rent
- $1,214 medium interval (Pro) →
- Mortgage (P&I)
- −$781
- Tax from tax record
- −$47 /mo · $568/yr
- Insurance
- −$62
- HOA
- −$0
- Vacancy / Maint / Mgmt
- −$255
- Net cashflow
- $68
Break-even live
Sensitivity live
| Price | -10% $152 | -5% $110 | +0% $68 | +5% $26 | +10% $-16 |
|---|---|---|---|---|---|
| Rent | -10% $-28 | -5% $20 | +0% $68 | +5% $116 | +10% $164 |
| Rate | -1.0pp $143 | -0.5pp $106 | base $68 | +0.5pp $29 | +1.0pp $-10 |
UW: 25.0% down · 7.5% · 30yr · 1.5% tax · 5.0% vac · 8.0% maint · 8.0% mgmt
Financing live
Cash to close
- Down payment
- $37,250
- Closing costs
- $4,470
- Reserves months
- —
- Total cash needed
- —
Loan-product check · same deal, 3 products live
Conventional
25% down · 7.5% · 30yr
- Down + closing
- —
- Monthly P&I
- —
- Monthly cashflow
- —
- DSCR
- —
- Eligible?
- —
Personal DTI + credit; lowest rate.
DSCR
20% down · 8.5% · 30yr
- Down + closing
- —
- Monthly P&I
- —
- Monthly cashflow
- —
- DSCR
- —
- Eligible?
- —
No personal income docs; deal must DSCR.
Hard money
10% down · 12.0% · 12mo
- Down + closing
- —
- Monthly P&I
- —
- Monthly cashflow
- —
- DSCR
- —
- Eligible?
- —
Short-term bridge; refi at stabilization.
Listing history 2 events
-
2026-04-26status Pending
-
2026-04-17$149,000 Active
ⓘ Source: listings_history table (triggers on properties + properties_extension) + one-shot
backfill from property_details.listing_events for pre-trigger history.
Tax reassessment forecast IN · Partial reset (capped growth)
- Current annual tax
- $568 · $47/mo
- Projected year-2 tax
- $917 · $76/mo
- Expected delta
- +$349/yr (+$29/mo · 61.4%)
ⓘ Screening estimate from a state-policy table — verify with the county assessor before closing.
Climate risk First Street
- Flood 1/10 Low FEMA zone X (unshaded) · 0% chance over 30 yrs
- Wildfire 1/10 Low
- Heat 3/10 Moderate 7 d/yr ≥100°F today · 16 d/yr by 30 yrs out
- Wind 2/10 Low
- Air quality 3/10 Moderate 1 unhealthy d/yr today · 3 by 30 yrs out
Nearby sold comps map
Loading sold comps map…
Walkable amenities ~0.75 mi
Loading nearby amenities…
Taxation est. · year 1
- Rental income
- $14,565
- − Mortgage interest
- −$8,346
- − Property taxes
- −$568
- − Insurance
- −$745
- − Repairs & maintenance
- −$1,165
- − Management
- −$1,165
- − Depreciation
- −$4,335
- Taxable loss
- −$1,759
- Est. tax savings @ 24.0%
- +$422
- After-tax cash flow
- $1,239/yr
For passive investors: Depreciation is non-cash, so a rental often shows a tax loss while cash-flowing — sheltering income. Rental losses are passive: they offset passive income freely, and up to $25,000/yr can offset ordinary (W-2) income if you actively participate and your MAGI is under $100k (phasing out to $0 by $150k); unused losses carry forward. On sale, claimed depreciation is recaptured at up to 25%, and gains may owe capital-gains tax (a 1031 exchange can defer both). Figures are a year-1 estimate at your 24.0% rate — not tax advice; consult a CPA.
Schools (NCES district)
- District
- Tippecanoe Valley School Corporation
- NCES district ID
- 1811370
- Math proficiency
- 40% ▼ -9.00%
- Reading proficiency
- 42% ▼ -5.00%
- Median HH income
- $49,697
- Composite
- 35.29/100
- National rank
- #4969
- State rank
- #126 of 301 in IN
Livability — Akron
- Score
- 77/100
- State rank
- #44
- US rank
- #3242
Category grades
Schools grade is shown separately in the Schools card above.
Census & demographics
- Census place
- Akron, IN
- Population (ZIP)
- 3,125
Population outlook (Fulton County) Hauer SSP2
- Today (2025)
- 19,537 people
- By 2030
- 19,013 · -2.7%
- By 2040
- 17,959 · -8.1%
- By 2050
- 17,038 · -12.8%
- By 2075
- 15,117 · -22.6%
- By 2100
- 13,179 · -32.5%
Race, ethnicity, and origin ACS 2023
- Neighborhood character
- Predominantly White (83%)
- Race & ethnicity
- White 83% Hispanic / Latino 16% Two or more races 4%
- Hispanic origin (detail)
- Mexican 16%
- Common ancestry
- Romanian 3% Italian 1%
- Foreign-born
- 7% · Canada
- Languages at home
- 86% English-only · Spanish 14%
Political lean MEDSL · Fulton
- 2024 margin
- Solid R (+51.2) · D 23.7% · R 74.9% · Other 1.4%
- 2008→2024 swing
- -35.2pp toward R · 2008: -16.0pp · 2024: -51.2pp
- All cycles
- 2024: R+51.2 2020: R+48.2 2016: R+48.4 2012: R+33.2 2008: R+16.0
Not yet ingested
- Civics
- —
Market trends
- HPI YoY
- ▼ -39.71%
- Current HPI
- 262.777
- Rent YoY
- —
- Metro
- —
- State GDP YoY
- ▲ 2.90%
- F500 in state
- 18
Industry mix (Fortune 500 HQ in IN)
| Industry | F500 HQs | Revenue |
|---|---|---|
| Industrial Machinery | 2 | $37B |
|
||
| Healthcare | 1 | $177B |
|
||
| Pharmaceuticals | 1 | $45B |
|
||
| Metals / Steel | 1 | $18B |
|
||
| Agriculture | 1 | $17B |
|
||
| Packaging | 1 | $12B |
|
||
Price history
2 events — show timeline
- 2026-04-26 Pending — NIRA MLS as Distributed by MLS Grid
- 2026-04-17 Listed $149,000 NIRA MLS as Distributed by MLS Grid
Property tax history
+0.6%/yrLatest (2024): $568 · -6.0% YoY. Source: county tax records.
Cash-flow waterfall
monthlySold comps — $/sqft
last 12 mo · ≤1 miLoading sold comps…