 🏷️ Likely Rental
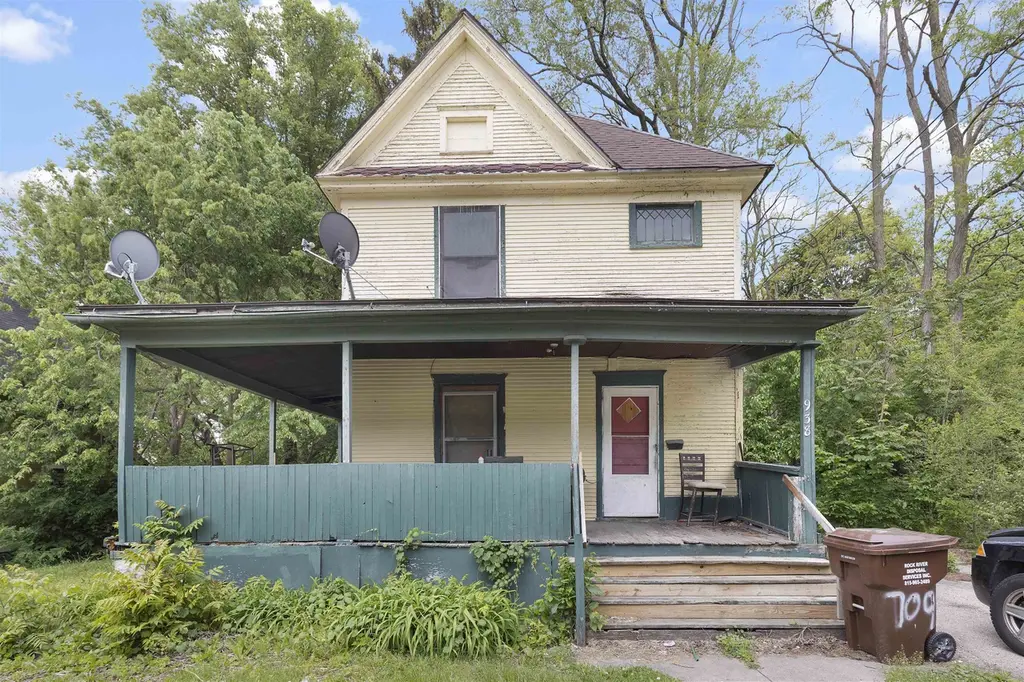
938 Woodlawn Ave · Rockford, IL
Flood risk 1/10 · Minimal
- FEMA flood zone
- X (unshaded)
- Chance of flooding over 30 yrs
- 0.0%
- Est. flood insurance / yr
- $473 – $860
Fire risk 1/10 · Minimal
- Est. fire insurance / yr
- $804 – $1,492
Heat risk 2/10 · Minimal
- Hot days now (above 102°F)
- 7 days/yr
- Hot days in 30 yrs
- 15 days/yr
Wind risk 2/10 · Minimal
- Chance of severe wind over 30 yrs
- —
Air-quality risk 2/10 · Minimal
- Unhealthy air days now
- 1 days/yr
- Unhealthy air days in 30 yrs
- 2 days/yr
Risk factors via First Street. Map © Google.
Why this score? — see what drove the B- grade
The composite is a weighted blend of 9 inputs, each scored 0–100. Each bar is that input's sub-score; the figure is the points it added to the 100-point composite (weight × sub-score).
- Cash flow +30.0/30.0
- 1% rule +10.0/10.0
- DSCR +10.0/10.0
- ARV discount +7.5/15.0
- Rent growth +4.5/5.0
- Livability +3.1/5.0
- Condition / age +2.5/5.0
- Schools +1.2/10.0
- Appreciation +0.0/10.0
$65,000
🖨 Deal sheet (PDF) 📄 Offer letter ✓ Due diligence
Listing remarks MLS
Attention investors and rehabbers! Spacious 2-story home featuring 4 bedrooms and 1 bathroom with tons of potential. This tenant-occupied property offers a large covered front porch, original woodwork and trim, spacious room sizes, an eat-in kitchen, and hardwood flooring in several areas. Home needs work and is ready for renovation, making it a great opportunity for sweat equity or future rental income. Sold as-is. No FHA/VA
Key facts
- Hardwood flooring
- Eat-in kitchen
- 9,583 sq ft lot
Tags
Property features AI
Finance
- HOA & community: No master association fee required
Exterior
- Utilities: Public water; Public sewer
- Home design: Detached single-family home; 2-story house; Built over 100 years ago; Wood siding construction; Built before 1978
- Construction: Wood siding; More than 100 years old
- Exterior features: Lot dimensions approximately 44 x 148.5; Lot smaller than 0.25 acre; Property currently leased
Interior
- Kitchen: Kitchen on main level (approx. 10 x 12)
- Bedrooms: Four bedrooms (master on main; three additional bedrooms on second floor)
- Bathrooms: One full bathroom
- Heating & cooling: Forced air heating
- Interior features: Six total rooms; Unfinished full basement
- Laundry & utility: Laundry room
Neighborhood map
What this means for you Summary
Snapshot
- This is a 4-bed/1.0-bath single-family listed at $65k.
Deal economics
- At list price, monthly cash flow is $785 ($9k/yr) — positive.
- The deal already cash-flows at list — no discount required.
- Meets the 1% rule at list price ($2k rent vs $65k).
- Recommended offer: $64k (1.5% below list) — sets the bar for market timing.
- Cap rate 20.8% vs local median 6.1% in Rockford — top-decile yield for the area; either an underpriced asset or a hidden risk that comps aren't pricing in. Stress-test before assuming the spread holds.
Location & tenants
- Location reads 62/100 on livability (#876 in IL) — a middle-class / working-renter tenant base. Strengths: cost of living A+, housing A+, health & safety A+; Watch: crime F, amenities F, commute F.
- Rockford SD 205 (urban): math 12% / reading 16% proficiency, ranked #533 of 620 in IL (top 86%) — low school quality limits family demand, transient renter base, plan for 1-2y turnover; 73% free/reduced lunch — lower-income household profile, screen leases tightly.
- Zoned schools: R K Welsh Elem School (math 7% / reading 7%, grade F, #1,719 of 2,056 statewide, top 84%, 435 students, 0% FRL); West Middle School (math 3% / reading 11%, grade F, #627 of 665 statewide, top 95%, 849 students, 0% FRL); Guilford High School (math 15% / reading 28%, grade F, #345 of 693 statewide, top 50%, 2,071 students, 0% FRL) — zoned schools average 0% FRL vs 73% district-wide (73 pts lower); this property's tenant base skews higher-income than the district average.
- Market conditions: Rents rising fast (+8.1%/yr); 105 active listings in the ZIP; 9 comparable units currently listed for rent nearby; rentals at typical pace (median 23d on market — plan ~3-4 weeks tenant-placement turnaround); 44% of comp listings sitting > 30 days — soft ceiling on asking rent; 285 units permitted in Winnebago County in 2024 (0 in 5+ unit buildings).
- This rent runs 37% of the median local income ($51k/yr) — at the standard rent-burdened threshold; future hikes will face affordability resistance.
Forward outlook
- Local home prices are declining (-3.0%/yr); year-one equity from $449 of loan paydown is wiped out by about $2k of value loss. Plan a longer hold.
- Winnebago County population projected at -20% by 2050 — secular population decline; favor cash flow + early exit over multi-decade hold.
- At projected returns (-3.0% appreciation + 8.0% rent growth), your $18k cash investment doubles in ~3 years — after that, you're playing with house money.
Negotiation context
- It's been on market 24 days — a 2% lower offer ($64k) is reasonable based on typical stale-listing flexibility.
- 2 sale attempts with the ask held roughly flat each time — persistent listings suggest the price (not the market) is what's stuck; bring a comps-based counter.
Risks & watch-outs
- Watch-outs: built in 1900 — expect roof / HVAC / electrical / plumbing capex.
Questions for the listing agent
- Built in 1900 — when were the roof, HVAC, electrical panel, plumbing, and water heater last replaced?
- Is there a deadline driving the sale (1031 exchange, divorce, estate, relocation)? That informs how much negotiation room exists.
- Schools are F-rated, which usually means shorter tenancies and higher turnover. Who's the typical renter profile here, and what's been the actual vacancy rate?
- Crime grade is F in this area — have there been break-ins, vandalism, or insurance claims at this property in the last 3 years? What carrier currently insures it and at what premium?
- What's the average days-on-market for RENTAL listings here right now (not sales)? A rising rental-DOM trend means longer vacancies and softer asking-rent achievability than the comps imply.
- What's the recent tenant-quality profile in this submarket — average credit score on applications, eviction rate, late-payment / NSF rate, and stable-employment percentage? A property-management company in the area should have these aggregated.
- How much new for-sale + rental construction is in the pipeline within 1–3 miles? Heavy new supply typically softens prices + rents 12–24 months out; constrained supply supports both.
Investment metrics
- 1% rule
- 2.43% ✓
- Cap rate
- 20.78%
- Cash-on-cash
- 51.74%
- DSCR
- 3.30
- GRM
- 3.4
CMA / ARV
- ARV (on-the-fly)
- $131,376
- Comps found
- 12
Show comp detail 12 sales within ~0.75 mi
| Address | Dist | Beds/Ba | Sqft | Sold | Price | $/sf | Match |
|---|---|---|---|---|---|---|---|
| 809 N Winnebago St | 0.18mi | 5/2.0 (+1) | 1,943 (+1%) | 11mo | $71,000 | $37 | 72 |
| 844 Haskell Ave | 0.19mi | 4/1.5 | 2,079 (+8%) | 11mo | $118,000 | $57 | 68 |
| 1025 Grant Ave | 0.42mi | 4/1.5 | 1,680 (-13%) | 1mo | $163,000 | $97 | 56 |
| 1027 Grant Ave | 0.43mi | 4/2.0 | 1,700 (-12%) | 0mo | $177,000 | $104 | 56 |
| 725 N Horsman St | 0.22mi | 3/1.5 (-1) | 1,736 (-10%) | 13mo | $83,000 | $48 | 54 |
| 706 John St | 0.36mi | 4/3.0 | 1,716 (-11%) | 2mo | $230,000 | $134 | 54 |
| 511 King St | 0.62mi | 3/1.0 (-1) | 1,900 (-2%) | 13mo | $140,000 | $74 | 52 |
| 1434 N Church St St | 0.73mi | 3/1.5 (-1) | 1,948 (+1%) | 12mo | $65,000 | $33 | 48 |
| 407 N Avon St | 0.59mi | 4/2.0 | 2,121 (+10%) | 9mo | $143,750 | $68 | 44 |
| 417 Reynolds St | 0.63mi | 3/1.5 (-1) | 1,781 (-8%) | 8mo | $170,000 | $95 | 44 |
| 1520 Grant Ave | 0.66mi | 3/1.0 (-1) | 1,658 (-14%) | 3mo | $102,000 | $62 | 38 |
| 330 King St | 0.74mi | 5/2.0 (+1) | 1,680 (-13%) | 5mo | $90,000 | $54 | 30 |
Match score weights: distance 35% · size 25% · config 20% · recency 20%. Top-matched comps best support the ARV.
Projected returns pro-forma
-3.0% appreciation · 8.0% rent growth · sell at horizon
- IRR
- 55.3%
- Equity multiple
- 3.63×
- Total profit
- $47,841
- Equity at exit
- $9,692
- IRR
- 62.3%
- Equity multiple
- 8.92×
- Total profit
- $144,207
- Equity at exit
- $5,620
Cash invested: $18,200 (down + closing). Projections, not guarantees.
Landlord ↔ Tenant lean methodology
- Overall (STATE)
- 43 Moderately Tenant-Leaning
- State Illinois
- 43 Moderately Tenant-Leaning · D+7
- County
- — inherits STATE
- City
- — inherits STATE
ZIP-level market 61103
- Home prices YoY
- -27.3%
- Rents YoY
- 8.1%
- Active inventory
- 105
- Price-to-rent
- 3.4×
Monthly cashflow live
- Estimated rent
- $1,582 high interval (Pro) →
- Mortgage (P&I)
- −$341
- Tax from tax record
- −$97 /mo · $1,167/yr
- Insurance
- −$27
- HOA
- −$0
- Vacancy / Maint / Mgmt
- −$332
- Net cashflow
- $785
Break-even live
Sensitivity live
| Price | -10% $822 | -5% $803 | +0% $785 | +5% $766 | +10% $748 |
|---|---|---|---|---|---|
| Rent | -10% $660 | -5% $722 | +0% $785 | +5% $847 | +10% $910 |
| Rate | -1.0pp $817 | -0.5pp $801 | base $785 | +0.5pp $768 | +1.0pp $751 |
UW: 25.0% down · 7.5% · 30yr · 1.5% tax · 5.0% vac · 8.0% maint · 8.0% mgmt
Financing live
Cash to close
- Down payment
- $16,250
- Closing costs
- $1,950
- Reserves months
- —
- Total cash needed
- —
Loan-product check · same deal, 3 products live
Conventional
25% down · 7.5% · 30yr
- Down + closing
- —
- Monthly P&I
- —
- Monthly cashflow
- —
- DSCR
- —
- Eligible?
- —
Personal DTI + credit; lowest rate.
DSCR
20% down · 8.5% · 30yr
- Down + closing
- —
- Monthly P&I
- —
- Monthly cashflow
- —
- DSCR
- —
- Eligible?
- —
No personal income docs; deal must DSCR.
Hard money
10% down · 12.0% · 12mo
- Down + closing
- —
- Monthly P&I
- —
- Monthly cashflow
- —
- DSCR
- —
- Eligible?
- —
Short-term bridge; refi at stabilization.
Rent comps 9 comps
| Address | Beds | Baths | Sqft | Rent | $/sqft | DOM | Units | Dist |
|---|---|---|---|---|---|---|---|---|
| 728 N Winnebago St Rockford, IL | 4.0 | 1.0 | 1250 | $1,600 | $1.28 | 15d | 1 | 0.21mi |
| 1146 Fairview Ave Rockford, IL | 4.0 | 1.5 | 1344 | $1,250 | $0.93 | 23d | 1 | 0.63mi |
| 303 Forest Ave Rockford, IL | 4.0 | 1.0 | 1568 | $1,800 | $1.15 | 45d | 1 | 0.76mi |
| 418 Orchard Park Rockford, IL | 3.0 | 1.0 | 1232 | $1,500 | $1.22 | 15d | 1 | 0.87mi |
| 1510 School St Unit 1 Rockford, IL | 3.0 | 1.5 | 1400 | $1,200 | $0.86 | 45d | 1 | 0.94mi |
| 207 N Central Ave Rockford, IL | 4.0 | 1.5 | 1296 | $1,500 | $1.16 | 15d | 1 | 1.08mi |
| 2308 Fremont St Rockford, IL | 3.0 | 1.0 | 1320 | $1,600 | $1.21 | 45d | 1 | 1.27mi |
| 2222 Andrews St Rockford, IL | 4.0 | 1.0 | 1400 | $1,600 | $1.14 | 15d | 1 | 1.40mi |
| 3007 Huffman Blvd Rockford, IL | 3.0 | 1.5 | 1296 | $1,450 | $1.12 | 45d | 1 | 1.49mi |
Listing history 15 events
-
2026-06-21days on market $65,000 Active 24 DOM
-
2026-06-19days on market $65,000 Active 22 DOM
-
2026-06-18days on market $65,000 Active 21 DOM
-
2026-06-17days on market $65,000 Active 20 DOM
-
2026-06-16days on market $65,000 Active 19 DOM
-
2026-06-15days on market $65,000 Active 18 DOM
-
2026-06-14days on market $65,000 Active 16 DOM
-
2026-06-13days on market $65,000 Active 15 DOM
-
2026-06-10days on market $65,000 Active 13 DOM
-
2026-06-09days on market $65,000 Active 12 DOM
-
2026-06-08days on market $65,000 Active 10 DOM
-
2026-06-07statusdays on market $65,000 Active 9 DOM
-
2026-05-30status $65,000 Pending 5 DOM
-
2026-05-24$65,000 Active 429-char remark
Show marketing remark (429 chars)
Attention investors and rehabbers! Spacious 2-story home featuring 4 bedrooms and 1 bathroom with tons of potential. This tenant-occupied property offers a large covered front porch, original woodwork and trim, spacious room sizes, an eat-in kitchen, and hardwood flooring in several areas. Home needs work and is ready for renovation, making it a great opportunity for sweat equity or future rental income. Sold as-is. No FHA/VA
-
2026-05-24$65,000 Active
Show marketing remark (429 chars)
Attention investors and rehabbers! Spacious 2-story home featuring 4 bedrooms and 1 bathroom with tons of potential. This tenant-occupied property offers a large covered front porch, original woodwork and trim, spacious room sizes, an eat-in kitchen, and hardwood flooring in several areas. Home needs work and is ready for renovation, making it a great opportunity for sweat equity or future rental income. Sold as-is. No FHA/VA
ⓘ Source: listings_history table (triggers on properties + properties_extension) + one-shot
backfill from property_details.listing_events for pre-trigger history.
Tax reassessment forecast IL · Partial reset (capped growth)
- Current annual tax
- $1,167 · $97/mo
- Projected year-2 tax
- $1,321 · $110/mo
- Expected delta
- +$154/yr (+$13/mo · 13.2%)
ⓘ Screening estimate from a state-policy table — verify with the county assessor before closing.
Climate risk First Street
- Flood 1/10 Low FEMA zone X (unshaded) · 0% chance over 30 yrs
- Wildfire 1/10 Low
- Heat 2/10 Low 7 d/yr ≥102°F today · 15 d/yr by 30 yrs out
- Wind 2/10 Low
- Air quality 2/10 Low 1 unhealthy d/yr today · 2 by 30 yrs out
Nearby sold comps map
Loading sold comps map…
Walkable amenities ~0.75 mi
Loading nearby amenities…
Taxation est. · year 1
- Rental income
- $18,986
- − Mortgage interest
- −$3,641
- − Property taxes
- −$1,167
- − Insurance
- −$325
- − Repairs & maintenance
- −$1,519
- − Management
- −$1,519
- − Depreciation
- −$1,891
- Taxable income
- $8,924
- Est. tax owed @ 24.0%
- −$2,142
- After-tax cash flow
- $7,275/yr
For passive investors: Depreciation is non-cash, so a rental often shows a tax loss while cash-flowing — sheltering income. Rental losses are passive: they offset passive income freely, and up to $25,000/yr can offset ordinary (W-2) income if you actively participate and your MAGI is under $100k (phasing out to $0 by $150k); unused losses carry forward. On sale, claimed depreciation is recaptured at up to 25%, and gains may owe capital-gains tax (a 1031 exchange can defer both). Figures are a year-1 estimate at your 24.0% rate — not tax advice; consult a CPA.
Schools (NCES district)
- District
- Rockford SD 205
- NCES district ID
- 1734510
- Math proficiency
- 12% ▼ -2.00%
- Reading proficiency
- 16% ▼ -3.00%
- Median HH income
- $42,533
- Composite
- 12.21/100
- National rank
- #9649
- State rank
- #533 of 620 in IL
Livability — Rockford
- Score
- 62/100
- State rank
- #876
- US rank
- #17035
Category grades
Schools grade is shown separately in the Schools card above.
Census & demographics
- Census place
- Rockford, IL
- County
- Winnebago County · 147,297 people
- City population
- 147,297
- Metro
- Rockford, IL
- Population (ZIP)
- 22,869
- Household income
- $51,161
- Rent vs Own
- Severe rent burden
- 1402.0
Population outlook (Winnebago County) Hauer SSP2
- Today (2025)
- 271,080 people
- By 2030
- 260,684 · -3.8%
- By 2040
- 238,405 · -12.1%
- By 2050
- 216,129 · -20.3%
- By 2075
- 172,882 · -36.2%
- By 2100
- 135,336 · -50.1%
Race, ethnicity, and origin ACS 2023
- Neighborhood character
- Diverse neighborhood (Simpson 0.61)
- Race & ethnicity
- White 56% Black 25% Two or more races 13% Hispanic / Latino 12%
- Hispanic origin (detail)
- Mexican 10%
- Common ancestry
- Romanian 3% Portuguese 2% Italian 2%
- Foreign-born
- 7% · Canada
- Languages at home
- 88% English-only · Spanish 9% Russian/Polish/Slavic 1%
Political lean MEDSL · Winnebago
- 2024 margin
- Toss-up / Even · D 49.5% · R 49.0% · Other 1.5%
- 2008→2024 swing
- -12.2pp toward R · 2008: 12.8pp · 2024: 0.6pp
- All cycles
- 2024: D+0.6 2020: D+2.5 2016: R+1.2 2012: D+5.7 2008: D+12.8
Not yet ingested
- Civics
- —
Market trends
- HPI YoY
- ▼ -81.02%
- Current HPI
- 215.8559
- Rent YoY
- ▲ 8.11%
- Metro
- Rockford, IL
- State GDP YoY
- ▲ 1.59%
- F500 in state
- 60
Industry mix (Fortune 500 HQ in IL)
| Industry | F500 HQs | Revenue |
|---|---|---|
| Insurance | 4 | $201B |
|
||
| Consumer Goods | 4 | $87B |
|
||
| Industrial Machinery | 3 | $64B |
|
||
| Healthcare | 2 | $55B |
|
||
| Retail / Pharmacy | 1 | $148B |
|
||
| Agriculture / Food | 1 | $86B |
|
||
Price history
+0.0% since first listed2 events — show timeline
- 2026-05-24 Listed $65,000 NWIAR
- 2026-05-24 Listed $65,000 MRED as Distributed by MLS Grid
Property tax history
+0.5%/yrLatest (2024): $1,167 · +84.2% YoY. Source: county tax records.
Cash-flow waterfall
monthlySold comps — $/sqft
last 12 mo · ≤1 miLoading sold comps…