196 S Perch Rd · Bowie, TX
Flood risk 3/10 · Minor
- FEMA flood zone
- X (unshaded)
- Chance of flooding over 30 yrs
- 0.12%
- Est. flood insurance / yr
- $507 – $1,088
Fire risk 5/10 · Moderate
- Est. fire insurance / yr
- $1,222 – $2,270
Heat risk 6/10 · Moderate
- Hot days now (above 109°F)
- 7 days/yr
- Hot days in 30 yrs
- 19 days/yr
Wind risk 4/10 · Minor
- Chance of severe wind over 30 yrs
- 19.0%
Air-quality risk 1/10 · Minimal
- Unhealthy air days now
- 0 days/yr
- Unhealthy air days in 30 yrs
- 0 days/yr
Risk factors via First Street. Map © Google.
Why this score? — see what drove the B- grade
The composite is a weighted blend of 9 inputs, each scored 0–100. Each bar is that input's sub-score; the figure is the points it added to the 100-point composite (weight × sub-score).
- Cash flow +30.0/30.0
- DSCR +10.0/10.0
- 1% rule +8.1/10.0
- ARV discount +7.5/15.0
- Schools +3.2/10.0
- Livability +3.2/5.0
- Rent growth +2.5/5.0
- Condition / age +2.5/5.0
- Appreciation +0.0/10.0
$130,000
🖨 Deal sheet 📄 Offer letter ✓ Due diligence
Listing remarks
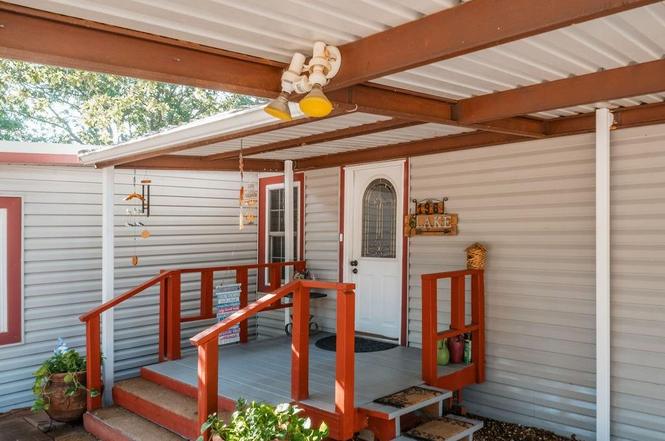
This inviting 4-bedroom, 2-bath home offers nearly 1,700 square feet of thoughtfully designed living space, just minutes from the shores of beautiful Amon Carter Lake, where boating, fishing, and lakeside fun become part of your everyday lifestyle. From the moment you arrive, this property draws you in with its versatility and comfort. Inside, you’ll find great-quality, double-pane windows that enhance energy efficiency and natural light, while the spray-insulated well house and recently replaced well pump provide peace of mind and long-term reliability. A water softener adds an extra layer of comfort to daily living. One of the standout features is the spacious enclosed outdoor flex
Key facts
- Water softener
- Double-pane windows
- 0.73 acre lot
Tags
Property features AI
Finance
- Other: Lot approximately 0.73 acres (assessor)
- HOA & community: No association
Exterior
- Parking: Attached carport; Carport with 2 covered spaces (2 carport spaces)
- Utilities: Co-op electric; Electricity connected; Septic system; Well water
- Home design: Single-family residence; Accessory unit present; Attached property; Built in 1992; Metal roof
- Construction: Siding and wood construction; Pillar/post/pier and slab foundation
- Exterior features: Covered porch(es); Awning(s); Gutters; RV hookup; RV/boat parking; Horse permitted; Sandy loam soil
Interior
- Kitchen: Dishwasher; Electric range; Pantry; Eat-in kitchen
- Bedrooms: 4 bedrooms (primary bedroom on level 1)
- Flooring: Carpet; Ceramic tile; Laminate
- Bathrooms: 2 full bathrooms
- Heating & cooling: Central heating (electric); Central air (electric); Ceiling fan(s)
- Interior features: Built-in features; Decorative lighting; Double vanity; Eat-in kitchen; High-speed internet available; Pantry; Walk-in closet(s); Two living areas; One dining area; One and one-half levels
- Laundry & utility: Electric water heater
Neighborhood map
What this means for you Summary
Snapshot
- This is a 4-bed/2.0-bath manufactured listed at $130k.
Deal economics
- At list price, monthly cash flow is $533 ($6k/yr) — positive.
- The deal already cash-flows at list — no discount required.
- Meets the 1% rule at list price ($2k rent vs $130k).
- Recommended offer: $114k (12.0% below list) — sets the bar for market timing.
- Cap rate 11.2% vs local median 3.1% in Bowie — top-decile yield for the area; either an underpriced asset or a hidden risk that comps aren't pricing in. Stress-test before assuming the spread holds.
Location & tenants
- Location reads 64/100 on livability (#796 in TX) — a middle-class / working-renter tenant base. Strengths: cost of living A+, housing A+; Watch: health & safety C-, amenities F, commute F.
- Bowie ISD (town): math 34% / reading 41% proficiency, ranked #469 of 826 in TX (top 57%) — families likely to look elsewhere, expect single-tenant / working-renter base with shorter leases.
- Zoned schools: Bowie El (422 students, 65% FRL) — zoned schools average 65% FRL vs 42% district-wide (24 pts higher); higher-poverty schools than district average — tighter screening recommended.
- Market conditions: 238 active listings in the ZIP; 23 units permitted in Montague County in 2024 (0 in 5+ unit buildings).
Forward outlook
- Local home prices are declining (-3.0%/yr); year-one equity from $899 of loan paydown is wiped out by about $4k of value loss. Plan a longer hold.
- Montague County population projected at -15% by 2050 — secular population decline; favor cash flow + early exit over multi-decade hold.
- At projected returns (-3.0% appreciation + 3.0% rent growth), your $36k cash investment doubles in ~7 years — after that, you're playing with house money.
Negotiation context
- It's been on market 154 days — a 12% lower offer ($114k) is reasonable based on typical stale-listing flexibility.
- 5 sale attempts since 2y ago; this cycle's ask has dropped $35k (21%) from the opening price — seller is motivated, your offer sets the floor, not the list.
Risks & watch-outs
- Climate carrying-cost: moderate wildfire risk; extreme-heat days projected 7→19/yr by 2055 (HVAC capex compounding) — expect insurance premiums to compound above CPI over the hold.
Questions for the listing agent
- It's been on market 154 days. Have you received any prior offers? Is the seller open to a 12% concession, seller financing, or rate buy-down credit?
- Why hasn't it sold? Are there any deal-killer items the seller is aware of (foundation, flood, title, zoning, code violations)?
- Is there a deadline driving the sale (1031 exchange, divorce, estate, relocation)? That informs how much negotiation room exists.
- Schools are D-rated, which usually means shorter tenancies and higher turnover. Who's the typical renter profile here, and what's been the actual vacancy rate?
- What's the average days-on-market for RENTAL listings here right now (not sales)? A rising rental-DOM trend means longer vacancies and softer asking-rent achievability than the comps imply.
- What's the recent tenant-quality profile in this submarket — average credit score on applications, eviction rate, late-payment / NSF rate, and stable-employment percentage? A property-management company in the area should have these aggregated.
- How much new for-sale + rental construction is in the pipeline within 1–3 miles? Heavy new supply typically softens prices + rents 12–24 months out; constrained supply supports both.
Investment metrics
- 1% rule
- 1.31% ✓
- Cap rate
- 11.21%
- Cash-on-cash
- 17.57%
- DSCR
- 1.78
- GRM
- 6.4
CMA / ARV
No comps found within radius.
Projected returns pro-forma
-3.0% appreciation · 3.0% rent growth · sell at horizon
- IRR
- 9.0%
- Equity multiple
- 1.35×
- Total profit
- $12,841
- Equity at exit
- $19,383
- IRR
- 18.1%
- Equity multiple
- 2.50×
- Total profit
- $54,759
- Equity at exit
- $11,240
Cash invested: $36,400 (down + closing). Projections, not guarantees.
Landlord ↔ Tenant lean methodology
- Overall (STATE)
- 87 Strongly Landlord-Friendly
- State Texas
- 87 Strongly Landlord-Friendly · R+5
- County
- — inherits STATE
- City
- — inherits STATE
ZIP-level market 76230
- Home prices YoY
- -27.1%
- Active inventory
- 238
- Price-to-rent
- 6.4×
Monthly cashflow live
- Estimated rent
- $1,697 medium interval (Pro) →
- Mortgage (P&I)
- −$682
- Tax from tax record
- −$72 /mo · $867/yr
- Insurance
- −$54
- HOA
- −$0
- Vacancy / Maint / Mgmt
- −$356
- Net cashflow
- $533
Break-even live
UW: 25.0% down · 7.5% · 30yr · 1.5% tax · 5.0% vac · 8.0% maint · 8.0% mgmt
Financing live
Cash to close
- Down payment
- $32,500
- Closing costs
- $3,900
- Reserves months
- —
- Total cash needed
- —
Loan-product check · same deal, 3 products live
Conventional
25% down · 7.5% · 30yr
- Down + closing
- —
- Monthly P&I
- —
- Monthly cashflow
- —
- DSCR
- —
- Eligible?
- —
Personal DTI + credit; lowest rate.
DSCR
20% down · 8.5% · 30yr
- Down + closing
- —
- Monthly P&I
- —
- Monthly cashflow
- —
- DSCR
- —
- Eligible?
- —
No personal income docs; deal must DSCR.
Hard money
10% down · 12.0% · 12mo
- Down + closing
- —
- Monthly P&I
- —
- Monthly cashflow
- —
- DSCR
- —
- Eligible?
- —
Short-term bridge; refi at stabilization.
Listing history 29 events
-
2026-06-18days on market $130,000 Active 154 DOM
-
2026-06-17days on market $130,000 Active 153 DOM
-
2026-06-16days on market $130,000 Active 152 DOM
-
2026-06-15days on market $130,000 Active 151 DOM
-
2026-06-13days on market $130,000 Active 149 DOM
-
2026-06-12days on market $130,000 Active 148 DOM
-
2026-06-09days on market $130,000 Active 145 DOM
-
2026-06-08days on market $130,000 Active 144 DOM
-
2026-06-08days on market $130,000 Active 143 DOM
-
2026-06-07days on market $130,000 Active 142 DOM
-
2026-06-03days on market $130,000 Active 139 DOM
-
2026-06-02days on market $130,000 Active 138 DOM
-
2026-06-01days on market $130,000 Active 137 DOM
-
2026-05-31days on market $130,000 Active 136 DOM
-
2026-05-07status Active
-
2026-04-21historical Active Option Contract
-
2026-02-22price $150,000
-
2026-01-14$165,000 Active
-
2026-01-09historical
-
2025-10-04status Active
-
2025-09-22status Pending
-
2025-09-19historical Active Option Contract
-
2025-07-03price $165,000
-
2025-04-05price $185,000
-
2025-01-09$199,500 Active
-
2025-01-06historical
-
2024-10-07price $199,500
-
2024-07-26price $215,000
-
2024-06-27$235,000 Active
ⓘ Source: listings_history table (triggers on properties + properties_extension) + one-shot
backfill from property_details.listing_events for pre-trigger history.
Tax reassessment forecast TX · Resets to sale price
- Current annual tax
- $867 · $72/mo
- Projected year-2 tax
- $2,379 · $198/mo
- Expected delta
- +$1,512/yr (+$126/mo · 174.5%)
ⓘ Screening estimate from a state-policy table — verify with the county assessor before closing.
Climate risk First Street
- Flood 3/10 Moderate FEMA zone X (unshaded) · 12% chance over 30 yrs
- Wildfire 5/10 Major
- Heat 6/10 Major 7 d/yr ≥109°F today · 19 d/yr by 30 yrs out
- Wind 4/10 Moderate 19% chance of damaging wind over 30 yrs
- Air quality 1/10 Low 0 unhealthy d/yr today · 0 by 30 yrs out
Nearby sold comps map
Loading sold comps map…
Walkable amenities ~0.75 mi
Loading nearby amenities…
Taxation est. · year 1
- Rental income
- $20,369
- − Mortgage interest
- −$7,282
- − Property taxes
- −$867
- − Insurance
- −$650
- − Repairs & maintenance
- −$1,630
- − Management
- −$1,630
- − Depreciation
- −$3,782
- Taxable income
- $4,529
- Est. tax owed @ 24.0%
- −$1,087
- After-tax cash flow
- $5,307/yr
For passive investors: Depreciation is non-cash, so a rental often shows a tax loss while cash-flowing — sheltering income. Rental losses are passive: they offset passive income freely, and up to $25,000/yr can offset ordinary (W-2) income if you actively participate and your MAGI is under $100k (phasing out to $0 by $150k); unused losses carry forward. On sale, claimed depreciation is recaptured at up to 25%, and gains may owe capital-gains tax (a 1031 exchange can defer both). Figures are a year-1 estimate at your 24.0% rate — not tax advice; consult a CPA.
Schools (NCES district)
- District
- Bowie ISD
- NCES district ID
- 4810990
- Math proficiency
- 34% ▼ -8.00%
- Reading proficiency
- 41% ▼ -2.00%
- Median HH income
- $45,720
- Composite
- 31.99/100
- National rank
- #5836
- State rank
- #469 of 826 in TX
Livability — Bowie
- Score
- 64/100
- State rank
- #796
- US rank
- #14499
Category grades
Schools grade is shown separately in the Schools card above.
Census & demographics
- Population (ZIP)
- 9,885
Population outlook (Montague County) Hauer SSP2
- Today (2025)
- 18,216 people
- By 2030
- 17,603 · -3.4%
- By 2040
- 16,451 · -9.7%
- By 2050
- 15,424 · -15.3%
- By 2075
- 13,365 · -26.6%
- By 2100
- 10,998 · -39.6%
Race, ethnicity, and origin ACS 2023
- Neighborhood character
- Predominantly White (83%)
- Race & ethnicity
- White 83% Hispanic / Latino 12% Two or more races 7%
- Hispanic origin (detail)
- Mexican 12%
- Common ancestry
- Serbian 2% Romanian 2% Slovak 1%
- Foreign-born
- 4% · Canada
- Languages at home
- 89% English-only · Spanish 10% Other Indo-European 1%
Political lean MEDSL · Montague
- 2024 margin
- Solid R (+77.7) · D 10.9% · R 88.5%
- 2008→2024 swing
- -19.2pp toward R · 2008: -58.5pp · 2024: -77.7pp
- All cycles
- 2024: R+77.7 2020: R+76.6 2016: R+77.2 2012: R+70.1 2008: R+58.5
Not yet ingested
- Civics
- —
Market trends
- HPI YoY
- ▼ -75.69%
- Current HPI
- 204.0919
- Rent YoY
- —
- Metro
- —
- State GDP YoY
- ▲ 3.95%
- F500 in state
- 110
Industry mix (Fortune 500 HQ in TX)
| Industry | F500 HQs | Revenue |
|---|---|---|
| Energy | 16 | $1,198B |
|
||
| Technology | 5 | $198B |
|
||
| Engineering / Construction | 4 | $72B |
|
||
| Energy Services | 3 | $60B |
|
||
| Utilities | 3 | $41B |
|
||
| Healthcare | 2 | $330B |
|
||
Price history
-36.2% since first listed15 events — show timeline
- 2026-05-07 Relisted — NTREIS
- 2026-04-21 Contingent — NTREIS
- 2026-02-22 Price Changed $150,000 NTREIS
- 2026-01-14 Listed $165,000 NTREIS
- 2026-01-09 Listing Removed — NTREIS
- 2025-10-04 Relisted — NTREIS
- 2025-09-22 Pending — NTREIS
- 2025-09-19 Contingent — NTREIS
- 2025-07-03 Price Changed $165,000 NTREIS
- 2025-04-05 Price Changed $185,000 NTREIS
- 2025-01-09 Listed $199,500 NTREIS
- 2025-01-06 Listing Removed — NTREIS
- 2024-10-07 Price Changed $199,500 NTREIS
- 2024-07-26 Price Changed $215,000 NTREIS
- 2024-06-27 Listed $235,000 NTREIS
Property tax history
+3.0%/yrLatest (2025): $867 · +0.0% YoY. Source: county tax records.
Cash-flow waterfall
monthlySold comps — $/sqft
last 12 mo · ≤1 miLoading sold comps…