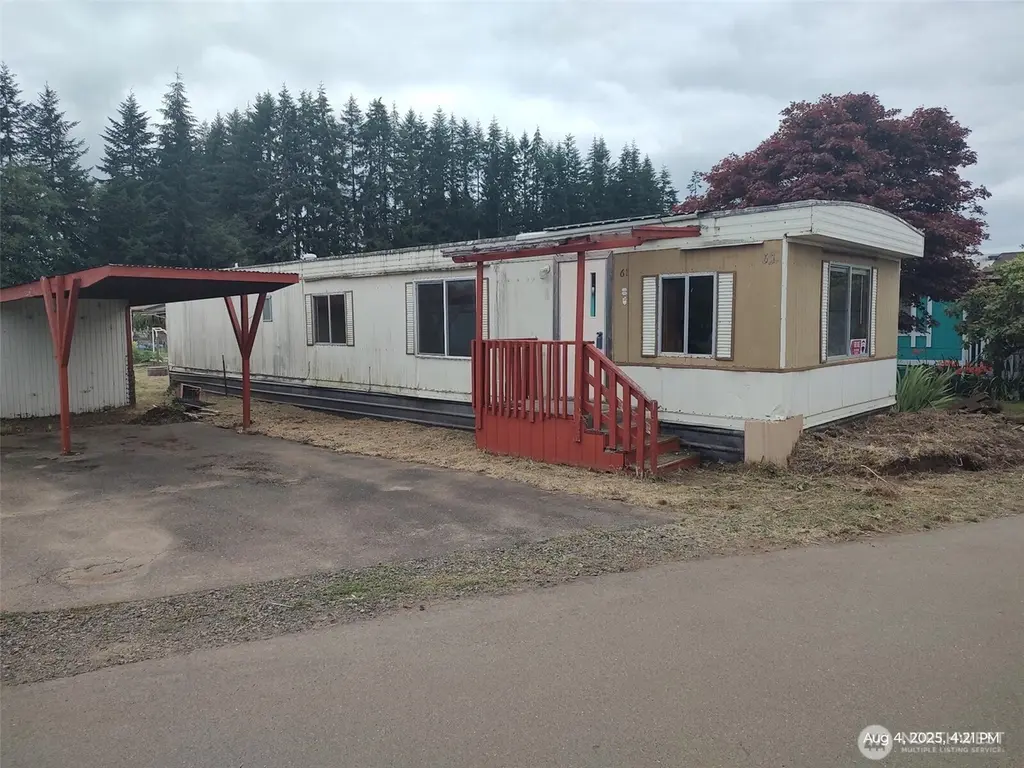
1194 US - Hwy 12 #61 · Central Park, WA
Flood risk 1/10 · Minimal
- FEMA flood zone
- X
- Chance of flooding over 30 yrs
- 0.0%
- Est. flood insurance / yr
- $435 – $905
Fire risk 1/10 · Minimal
- Est. fire insurance / yr
- $604 – $1,122
Heat risk 1/10 · Minimal
- Hot days now (above threshold)
- 7 days/yr
- Hot days in 30 yrs
- 14 days/yr
Wind risk No data
- Chance of severe wind over 30 yrs
- —
Air-quality risk 6/10 · Moderate
- Unhealthy air days now
- 6 days/yr
- Unhealthy air days in 30 yrs
- 6 days/yr
Risk factors via First Street. Map © Google.
Why this score? — see what drove the D+ grade
The composite is a weighted blend of 9 inputs, each scored 0–100. Each bar is that input's sub-score; the figure is the points it added to the 100-point composite (weight × sub-score).
- Cash flow +15.0/30.0
- ARV discount +7.5/15.0
- Schools +5.3/10.0
- 1% rule +5.0/10.0
- DSCR +5.0/10.0
- Livability +3.7/5.0
- Rent growth +2.5/5.0
- Condition / age +2.5/5.0
- Appreciation +0.0/10.0
$18,500
🖨 Deal sheet (PDF) 📄 Offer letter ✓ Due diligence
Listing remarks
Owner Financing Available! The mobile home located in Hidden Valley MHP with space rent of $795 per month. build sweat equity with this one fixer! 2 bedroom 2 bathroom
Key facts
- 85 parking spots
- Built 1975
- Listed 223 days
Neighborhood map
What this means for you Summary
Snapshot
- This is a 2-bed/2.0-bath manufactured listed at $18k.
Deal economics
- At list price, monthly cash flow is $607 ($7k/yr) — positive.
- The deal already cash-flows at list — no discount required.
- Meets the 1% rule at list price ($905 rent vs $18k).
- Recommended offer: $16k (12.0% below list) — sets the bar for market timing.
Location & tenants
- Location reads 74/100 on livability (#174 in WA, #4,470 nationally) — a middle-class / working-renter tenant base. Strengths: employment A+, housing A+, commute A; Watch: health & safety C-, schools D, amenities F.
- Montesano School District (town): math 57% / reading 63% proficiency, ranked #60 of 291 in WA (top 21%) — acceptable for families but not a draw, mixed tenant base, ~2y average lease.
- Market conditions: 69 active listings in the ZIP; 297 units permitted in Grays Harbor County in 2024 (17 in 5+ unit buildings).
Forward outlook
- Local home prices are declining (-3.0%/yr); year-one equity from $128 of loan paydown is wiped out by about $555 of value loss. Plan a longer hold.
- Grays Harbor County population projected at -24% by 2050 — secular population decline; favor cash flow + early exit over multi-decade hold.
- At projected returns (-3.0% appreciation + 3.0% rent growth), your $5k cash investment doubles in ~1 year — after that, you're playing with house money.
Negotiation context
- It's been on market 224 days — a 12% lower offer ($16k) is reasonable based on typical stale-listing flexibility.
Questions for the listing agent
- It's been on market 224 days. Have you received any prior offers? Is the seller open to a 12% concession, seller financing, or rate buy-down credit?
- Built in 1975 — when were the roof, HVAC, electrical panel, plumbing, and water heater last replaced?
- Why hasn't it sold? Are there any deal-killer items the seller is aware of (foundation, flood, title, zoning, code violations)?
- Is there a deadline driving the sale (1031 exchange, divorce, estate, relocation)? That informs how much negotiation room exists.
- Schools are D-rated, which usually means shorter tenancies and higher turnover. Who's the typical renter profile here, and what's been the actual vacancy rate?
- The area grade is low — what's the realistic commute time and amenity access for the typical tenant pool here? Any planned neighborhood developments (good or bad) we should know about?
- What's the average days-on-market for RENTAL listings here right now (not sales)? A rising rental-DOM trend means longer vacancies and softer asking-rent achievability than the comps imply.
- What's the recent tenant-quality profile in this submarket — average credit score on applications, eviction rate, late-payment / NSF rate, and stable-employment percentage? A property-management company in the area should have these aggregated.
- How much new for-sale + rental construction is in the pipeline within 1–3 miles? Heavy new supply typically softens prices + rents 12–24 months out; constrained supply supports both.
Investment metrics
- 1% rule
- 4.89% ✓
- Cap rate
- 45.68%
- Cash-on-cash
- 140.67%
- DSCR
- 7.26
- GRM
- 1.7
CMA / ARV
- ARV (median comp)
- $8,998
- List price
- $18,500
- Delta
- 105.61%
- Verdict
- OVERPRICED
- Comps
- 3 within 1.0 mi
Show comp detail 2 sales within ~0.75 mi
| Address | Dist | Beds/Ba | Sqft | Sold | Price | $/sf | Match |
|---|---|---|---|---|---|---|---|
| 1194 US - HWY 12 #18 | 0.00mi | 2/2.0 | 924 (+10%) | 10mo | $9,000 | $10 | 75 |
| 1194 US - Hwy 12 #19 | 0.00mi | 3/1.0 (+1) | 896 (+7%) | 8mo | $3,500 | $4 | 74 |
Match score weights: distance 35% · size 25% · config 20% · recency 20%. Top-matched comps best support the ARV.
Projected returns pro-forma
-3.0% appreciation · 3.0% rent growth · sell at horizon
- IRR
- —
- Equity multiple
- 7.89×
- Total profit
- $35,679
- Equity at exit
- $2,758
- IRR
- —
- Equity multiple
- 16.61×
- Total profit
- $80,876
- Equity at exit
- $1,600
Cash invested: $5,180 (down + closing). Projections, not guarantees.
Landlord ↔ Tenant lean methodology
- Overall (STATE)
- 28 Tenant-Leaning
- State Washington
- 28 Tenant-Leaning · D+8
- County
- — inherits STATE
- City
- — inherits STATE
ZIP-level market 98563
- Active inventory
- 69
- Price-to-rent
- 1.7×
Monthly cashflow live
- Estimated rent
- $905 medium interval (Pro) →
- Mortgage (P&I)
- −$97
- Tax from tax record
- −$3 /mo · $40/yr
- Insurance
- −$8
- HOA
- −$0
- Vacancy / Maint / Mgmt
- −$190
- Net cashflow
- $607
Break-even live
Sensitivity live
| Price | -10% $618 | -5% $612 | +0% $607 | +5% $602 | +10% $575 |
|---|---|---|---|---|---|
| Rent | -10% $536 | -5% $571 | +0% $607 | +5% $643 | +10% $679 |
| Rate | -1.0pp $617 | -0.5pp $612 | base $607 | +0.5pp $602 | +1.0pp $598 |
UW: 25.0% down · 7.5% · 30yr · 1.5% tax · 5.0% vac · 8.0% maint · 8.0% mgmt
Financing live
Cash to close
- Down payment
- $4,625
- Closing costs
- $555
- Reserves months
- —
- Total cash needed
- —
Loan-product check · same deal, 3 products live
Conventional
25% down · 7.5% · 30yr
- Down + closing
- —
- Monthly P&I
- —
- Monthly cashflow
- —
- DSCR
- —
- Eligible?
- —
Personal DTI + credit; lowest rate.
DSCR
20% down · 8.5% · 30yr
- Down + closing
- —
- Monthly P&I
- —
- Monthly cashflow
- —
- DSCR
- —
- Eligible?
- —
No personal income docs; deal must DSCR.
Hard money
10% down · 12.0% · 12mo
- Down + closing
- —
- Monthly P&I
- —
- Monthly cashflow
- —
- DSCR
- —
- Eligible?
- —
Short-term bridge; refi at stabilization.
Listing history 20 events
-
2026-06-19days on market $18,500 Active 224 DOM
-
2026-06-18days on market $18,500 Active 223 DOM
-
2026-06-17days on market $18,500 Active 222 DOM
-
2026-06-16days on market $18,500 Active 221 DOM
-
2026-06-15days on market $18,500 Active 220 DOM
-
2026-06-14days on market $18,500 Active 218 DOM
-
2026-06-12days on market $18,500 Active 217 DOM
-
2026-06-08days on market $18,500 Active 213 DOM
-
2026-06-07days on market $18,500 Active 212 DOM
-
2026-06-05days on market $18,500 Active 209 DOM
-
2026-06-03days on market $18,500 Active 208 DOM
-
2026-06-02days on market $18,500 Active 207 DOM
-
2026-06-01days on market $18,500 Active 206 DOM
-
2026-05-31days on market $18,500 Active 205 DOM
-
2026-05-30days on market $18,500 Active 204 DOM
-
2026-04-25price $18,500
-
2026-03-10price $19,000
-
2025-11-30price $20,000
-
2025-11-23price $22,500
-
2025-11-07$24,500 Active
ⓘ Source: listings_history table (triggers on properties + properties_extension) + one-shot
backfill from property_details.listing_events for pre-trigger history.
Tax reassessment forecast WA · Resets to sale price
- Current annual tax
- $40 · $3/mo
- Projected year-2 tax
- $181 · $15/mo
- Expected delta
- +$141/yr (+$12/mo · 348.1%)
ⓘ Screening estimate from a state-policy table — verify with the county assessor before closing.
Climate risk First Street
- Flood 1/10 Low FEMA zone X · 0% chance over 30 yrs
- Wildfire 1/10 Low
- Heat 1/10 Low
- Air quality 6/10 Major 6 unhealthy d/yr today · 6 by 30 yrs out
Nearby sold comps map
Loading sold comps map…
Walkable amenities ~0.75 mi
Loading nearby amenities…
Taxation est. · year 1
- Rental income
- $10,866
- − Mortgage interest
- −$1,036
- − Property taxes
- −$40
- − Insurance
- −$92
- − Repairs & maintenance
- −$869
- − Management
- −$869
- − Depreciation
- −$538
- Taxable income
- $7,420
- Est. tax owed @ 24.0%
- −$1,781
- After-tax cash flow
- $5,506/yr
For passive investors: Depreciation is non-cash, so a rental often shows a tax loss while cash-flowing — sheltering income. Rental losses are passive: they offset passive income freely, and up to $25,000/yr can offset ordinary (W-2) income if you actively participate and your MAGI is under $100k (phasing out to $0 by $150k); unused losses carry forward. On sale, claimed depreciation is recaptured at up to 25%, and gains may owe capital-gains tax (a 1031 exchange can defer both). Figures are a year-1 estimate at your 24.0% rate — not tax advice; consult a CPA.
Schools (NCES district)
- District
- Montesano School District
- NCES district ID
- 5305160
- Math proficiency
- 57% ▲ 3.00%
- Reading proficiency
- 63% ▼ -2.00%
- Median HH income
- $54,981
- Composite
- 53.15/100
- National rank
- #3220
- State rank
- #60 of 291 in WA
Livability — Central Park
- Score
- 74/100
- State rank
- #174
- US rank
- #4470
Category grades
Schools grade is shown separately in the Schools card above.
Census & demographics
- Population (ZIP)
- 7,630
Population outlook (Grays Harbor County) Hauer SSP2
- Today (2025)
- 66,443 people
- By 2030
- 63,255 · -4.8%
- By 2040
- 56,466 · -15.0%
- By 2050
- 50,516 · -24.0%
- By 2075
- 39,296 · -40.9%
- By 2100
- 31,142 · -53.1%
Race, ethnicity, and origin ACS 2023
- Neighborhood character
- Predominantly White (88%)
- Race & ethnicity
- White 88% Two or more races 7% Hispanic / Latino 6%
- Hispanic origin (detail)
- Mexican 4%
- Common ancestry
- Italian 5% Portuguese 3% Lithuanian 2%
- Foreign-born
- 3% · Canada
- Languages at home
- 98% English-only · Russian/Polish/Slavic 1% Spanish 1%
Political lean MEDSL · Grays Harbor
- 2024 margin
- Lean R (+6.0) · D 45.6% · R 51.6% · Other 2.8%
- 2008→2024 swing
- -20.6pp toward R · 2008: 14.6pp · 2024: -6.0pp
- All cycles
- 2024: R+6.0 2020: R+6.6 2016: R+7.1 2012: D+14.0 2008: D+14.6
Not yet ingested
- Civics
- —
Market trends
- HPI YoY
- ▼ -249.34%
- Current HPI
- 213.2127
- Rent YoY
- —
- Metro
- —
- State GDP YoY
- ▲ 4.65%
- F500 in state
- 22
Industry mix (Fortune 500 HQ in WA)
| Industry | F500 HQs | Revenue |
|---|---|---|
| Retail | 2 | $269B |
|
||
| Technology / Retail | 1 | $638B |
|
||
| Technology | 1 | $245B |
|
||
| Telecommunications | 1 | $38B |
|
||
| Food / Beverage | 1 | $36B |
|
||
| Automotive / Trucks | 1 | $34B |
|
||
Price history
-24.5% since first listed5 events — show timeline
- 2026-04-25 Price Changed $18,500 NWMLS as Distributed by MLS Grid
- 2026-03-10 Price Changed $19,000 NWMLS as Distributed by MLS Grid
- 2025-11-30 Price Changed $20,000 NWMLS as Distributed by MLS Grid
- 2025-11-23 Price Changed $22,500 NWMLS as Distributed by MLS Grid
- 2025-11-07 Listed $24,500 NWMLS as Distributed by MLS Grid
Property tax history
+13.7%/yrLatest (2026): $40 · -1.8% YoY. Source: county tax records.
Cash-flow waterfall
monthlySold comps — $/sqft
last 12 mo · ≤1 miLoading sold comps…