 12-Plex
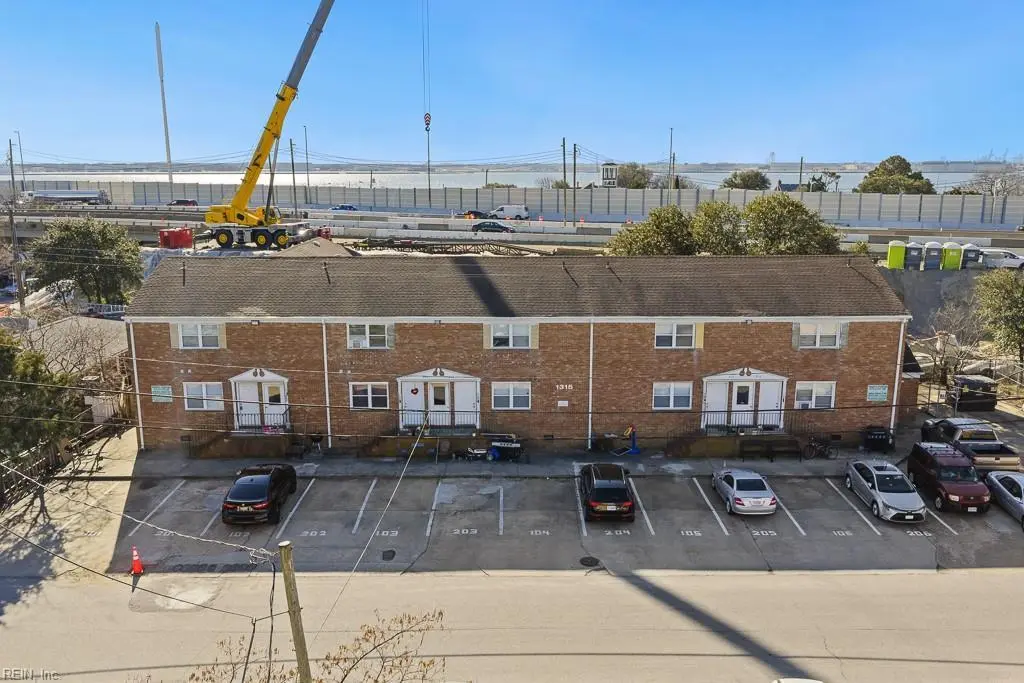
1315 Little Bay Ave · Norfolk, VA
Flood risk 10/10 · Severe
- FEMA flood zone
- AE
- Chance of flooding over 30 yrs
- 0.99%
- Est. flood insurance / yr
- $1,737 – $8,500
Fire risk 1/10 · Minimal
- Est. fire insurance / yr
- $666 – $1,236
Heat risk 9/10 · Severe
- Hot days now (above 105°F)
- 7 days/yr
- Hot days in 30 yrs
- 16 days/yr
Wind risk 8/10 · Major
- Chance of severe wind over 30 yrs
- 80.0%
Air-quality risk 2/10 · Minimal
- Unhealthy air days now
- 2 days/yr
- Unhealthy air days in 30 yrs
- 2 days/yr
Risk factors via First Street. Map © Google.
Why this score? — see what drove the B- grade
The composite is a weighted blend of 9 inputs, each scored 0–100. Each bar is that input's sub-score; the figure is the points it added to the 100-point composite (weight × sub-score).
- Cash flow +28.8/30.0
- DSCR +10.0/10.0
- ARV discount +7.5/15.0
- 1% rule +7.3/10.0
- Livability +4.2/5.0
- Rent growth +3.7/5.0
- Schools +3.5/10.0
- Condition / age +2.5/5.0
- Appreciation +0.0/10.0
$1,500,000
🖨 Deal sheet (PDF) 📄 Offer letter ✓ Due diligence
Multi-family units
County records classify this as Multi-Family (5+ Unit). Listing-text estimate: 12 units. confirmed
5+ unit building — per-unit beds/baths from public records are typically unavailable; the breakdown below (if shown) is an estimate from the listing text.
Listing remarks MLS
Value-add 12-unit multifamily opportunity: (12) 2-bedroom apartments at 1315 Little Bay Ave with an all-2BR unit mix. Minutes to local beaches with quick access to the interstate and major military bases. Solid brick exterior with strong curb appeal and excellent interstate visibility in a high-traffic corridor. Rents are currently below market, while unit turnovers are in progress—creating a near-term runway to renovate, raise rents, and capture upside without betting on heavy lease-up (vacancy has remained low). On-site common-area laundry adds convenience and potential ancillary income. Pro forma upside through rent lifts and continued unit refreshes. Ideal for an investor seeking stable in-place cash flow plus straightforward value-creation levers.
Key facts
- 2 bedroom apartments
- Strong curb appeal
- Solid brick exterior
Tags
Neighborhood map
What this means for you Summary
Snapshot
- This is a 12 × 2-bed/1-bath units multifamily listed at $1.50M.
Deal economics
- At list price, monthly cash flow is $5k ($55k/yr) — positive. Per door: $384/mo.
- The deal already cash-flows at list — no discount required.
- Meets the 1% rule at list price ($18k rent vs $1.50M).
- Recommended offer: $1.32M (12.0% below list) — sets the bar for market timing.
- Cap rate 10.3% vs local median 4.0% in Norfolk — top-decile yield for the area; either an underpriced asset or a hidden risk that comps aren't pricing in. Stress-test before assuming the spread holds.
Location & tenants
- Location reads 83/100 on livability (#43 in VA, #1,026 nationally) — a professional / high-income tenant draw. Strengths: amenities A+, commute A+, health & safety A+; Watch: employment C-, crime F.
- Norfolk City Public School District (urban): math 27% / reading 56% proficiency, ranked #118 of 131 in VA (top 90%) — families likely to look elsewhere, expect single-tenant / working-renter base with shorter leases.
- Market conditions: Rents rising fast (+4.8%/yr); 198 active listings in the ZIP; 438 units permitted in Norfolk city in 2024 (273 in 5+ unit buildings).
- At $18,500/mo this rent would consume 328% of the median local household income ($68k/yr) (locally 1948% of renters already pay >50% of income on rent) — very limited rent-growth headroom before tenants either downsize or default.
Forward outlook
- Local home prices are declining (-3.0%/yr); year-one equity from $10k of loan paydown is wiped out by about $45k of value loss. Plan a longer hold.
- At projected returns (-3.0% appreciation + 4.8% rent growth), your $420k cash investment doubles in ~8 years — after that, you're playing with house money.
Negotiation context
- It's been on market 154 days — a 12% lower offer ($1.32M) is reasonable based on typical stale-listing flexibility.
- Current owner paid $899k; list at $1.50M implies a 67% gain — meaningful room to come down on a strong offer.
Risks & watch-outs
- Watch-outs: flood insurance adds $427/mo.
- Climate carrying-cost: in FEMA flood zone AE (mandatory federal flood insurance); severe wind risk, 80% chance of damaging wind over 30y; extreme-heat days projected 7→16/yr by 2055 (HVAC capex compounding) — expect insurance premiums to compound above CPI over the hold.
Questions for the listing agent
- It's been on market 154 days. Have you received any prior offers? Is the seller open to a 12% concession, seller financing, or rate buy-down credit?
- Can we see the unit-by-unit rent roll, current vacancy, and any below-market leases? What's the average tenancy length?
- What capital expenditures (roof, boiler, parking lot, exteriors) have been made in the last 5 years, and what's planned in the next 2?
- Built in 1979 — when were the roof, HVAC, electrical panel, plumbing, and water heater last replaced?
- What's the actual annual flood-insurance premium (NFIP or private), and is the property in a SFHA with mandatory coverage?
- Why hasn't it sold? Are there any deal-killer items the seller is aware of (foundation, flood, title, zoning, code violations)?
- Is there a deadline driving the sale (1031 exchange, divorce, estate, relocation)? That informs how much negotiation room exists.
- Schools are A-rated — typically a magnet for longer-tenancy family renters. What's the average tenant stay here, and is there a school-zone premium baked into asking?
- Crime grade is F in this area — have there been break-ins, vandalism, or insurance claims at this property in the last 3 years? What carrier currently insures it and at what premium?
- What's the average days-on-market for RENTAL listings here right now (not sales)? A rising rental-DOM trend means longer vacancies and softer asking-rent achievability than the comps imply.
- What's the recent tenant-quality profile in this submarket — average credit score on applications, eviction rate, late-payment / NSF rate, and stable-employment percentage? A property-management company in the area should have these aggregated.
- How much new apartment / multifamily construction is in the pipeline within 1–3 miles? Heavy new supply (>2% of stock underway) typically softens rents 12–24 months out; light construction supports rent growth.
Investment metrics
- 1% rule
- 1.23% ✓
- Cap rate
- 10.32%
- Cash-on-cash
- 14.37%
- DSCR
- 1.64
- GRM
- 6.8
CMA / ARV
- ARV (median comp)
- $386,421
- List price
- $1,500,000
- Delta
- 288.18%
- Verdict
- OVERPRICED
- Comps
- 4 within 1.0 mi
Projected returns pro-forma
-3.0% appreciation · 4.76% rent growth · sell at horizon
- IRR
- 5.0%
- Equity multiple
- 1.20×
- Total profit
- $83,544
- Equity at exit
- $223,655
- IRR
- 16.0%
- Equity multiple
- 2.41×
- Total profit
- $592,351
- Equity at exit
- $129,693
Cash invested: $420,000 (down + closing). Projections, not guarantees.
Landlord ↔ Tenant lean methodology
- Overall (STATE)
- 55 Moderately Landlord-Leaning
- State Virginia
- 55 Moderately Landlord-Leaning · D+2
- County
- — inherits STATE
- City
- — inherits STATE
ZIP-level market 23503
- Home prices YoY
- -19.9%
- Rents YoY
- 4.8%
- Active inventory
- 198
- Price-to-rent
- 81.1×
Monthly cashflow live
- Estimated rent
- $18,500 high interval (Pro) →
- Mortgage (P&I)
- −$7,866
- Tax from tax record
- −$1,094 /mo · $13,123/yr
- Insurance
- −$625
- Flood insurance flood zone
- −$427 /mo · $5,118/yr
- HOA
- −$0
- Vacancy / Maint / Mgmt
- −$3,885
- Net cashflow
- $4,604
Break-even live
Sensitivity live
| Price | -10% $5,453 | -5% $5,028 | +0% $4,604 | +5% $4,179 | +10% $3,755 |
|---|---|---|---|---|---|
| Rent | -10% $3,142 | -5% $3,873 | +0% $4,604 | +5% $5,334 | +10% $6,065 |
| Rate | -1.0pp $5,359 | -0.5pp $4,985 | base $4,604 | +0.5pp $4,215 | +1.0pp $3,820 |
12-unit breakdown (identical units grouped — click to expand)
| Units | Beds | Baths | Est. rent |
|---|---|---|---|
| 12× units | 2 | 1 | $18,504 |
| #1 | 2 | 1 | $1,542 |
| #2 | 2 | 1 | $1,542 |
| #3 | 2 | 1 | $1,542 |
| #4 | 2 | 1 | $1,542 |
| #5 | 2 | 1 | $1,542 |
| #6 | 2 | 1 | $1,542 |
| #7 | 2 | 1 | $1,542 |
| #8 | 2 | 1 | $1,542 |
| #9 | 2 | 1 | $1,542 |
| #10 | 2 | 1 | $1,542 |
| #11 | 2 | 1 | $1,542 |
| #12 | 2 | 1 | $1,542 |
| Total (12 units) | $18,500 | ||
UW: 25.0% down · 7.5% · 30yr · 1.5% tax · 5.0% vac · 8.0% maint · 8.0% mgmt
Financing live
Cash to close
- Down payment
- $375,000
- Closing costs
- $45,000
- Reserves months
- —
- Total cash needed
- —
Loan-product check · same deal, 3 products live
Conventional
25% down · 7.5% · 30yr
- Down + closing
- —
- Monthly P&I
- —
- Monthly cashflow
- —
- DSCR
- —
- Eligible?
- —
Personal DTI + credit; lowest rate.
DSCR
20% down · 8.5% · 30yr
- Down + closing
- —
- Monthly P&I
- —
- Monthly cashflow
- —
- DSCR
- —
- Eligible?
- —
No personal income docs; deal must DSCR.
Hard money
10% down · 12.0% · 12mo
- Down + closing
- —
- Monthly P&I
- —
- Monthly cashflow
- —
- DSCR
- —
- Eligible?
- —
Short-term bridge; refi at stabilization.
Listing history 17 events
-
2026-06-21days on market $1,500,000 Active 154 DOM
-
2026-06-18days on market $1,500,000 Active 151 DOM
-
2026-06-17days on market $1,500,000 Active 150 DOM
-
2026-06-16days on market $1,500,000 Active 149 DOM
-
2026-06-15days on market $1,500,000 Active 148 DOM
-
2026-06-13days on market $1,500,000 Active 146 DOM
-
2026-06-09days on market $1,500,000 Active 142 DOM
-
2026-06-08days on market $1,500,000 Active 141 DOM
-
2026-06-07days on market $1,500,000 Active 140 DOM
-
2026-06-03days on market $1,500,000 Active 136 DOM
-
2026-06-02days on market $1,500,000 Active 135 DOM
-
2026-06-01days on market $1,500,000 Active 134 DOM
-
2026-05-31days on market $1,500,000 Active 133 DOM
-
2026-02-18price $1,500,000 769-char remark
Show marketing remark (769 chars)
Value-add 12-unit multifamily opportunity: (12) 2-bedroom apartments at 1315 Little Bay Ave with an all-2BR unit mix. Minutes to local beaches with quick access to the interstate and major military bases. Solid brick exterior with strong curb appeal and excellent interstate visibility in a high-traffic corridor. Rents are currently below market, while unit turnovers are in progress—creating a near-term runway to renovate, raise rents, and capture upside without betting on heavy lease-up (vacancy has remained low). On-site common-area laundry adds convenience and potential ancillary income. Pro forma upside through rent lifts and continued unit refreshes. Ideal for an investor seeking stable in-place cash flow plus straightforward value-creation levers.
-
2026-01-16$1,590,000 Active 769-char remark
Show marketing remark (769 chars)
Value-add 12-unit multifamily opportunity: (12) 2-bedroom apartments at 1315 Little Bay Ave with an all-2BR unit mix. Minutes to local beaches with quick access to the interstate and major military bases. Solid brick exterior with strong curb appeal and excellent interstate visibility in a high-traffic corridor. Rents are currently below market, while unit turnovers are in progress—creating a near-term runway to renovate, raise rents, and capture upside without betting on heavy lease-up (vacancy has remained low). On-site common-area laundry adds convenience and potential ancillary income. Pro forma upside through rent lifts and continued unit refreshes. Ideal for an investor seeking stable in-place cash flow plus straightforward value-creation levers.
-
2025-12-18soldstatus $899,000
-
2000-04-13soldstatus $285,000
ⓘ Source: listings_history table (triggers on properties + properties_extension) + one-shot
backfill from property_details.listing_events for pre-trigger history.
Tax reassessment forecast VA · Resets to sale price
- Current annual tax
- $13,123 · $1,094/mo
- Projected year-2 tax
- $13,123 · $1,094/mo
- Expected delta
- $0/yr ($0/mo · -0.0%)
ⓘ Screening estimate from a state-policy table — verify with the county assessor before closing.
Climate risk First Street
- Flood 10/10 Extreme FEMA zone AE · 99% chance over 30 yrs
- Wildfire 1/10 Low
- Heat 9/10 Extreme 7 d/yr ≥105°F today · 16 d/yr by 30 yrs out
- Wind 8/10 Severe 80% chance of damaging wind over 30 yrs
- Air quality 2/10 Low 2 unhealthy d/yr today · 2 by 30 yrs out
Nearby sold comps map
Loading sold comps map…
Walkable amenities ~0.75 mi
Loading nearby amenities…
Taxation est. · year 1
- Rental income
- $222,000
- − Mortgage interest
- −$84,023
- − Property taxes
- −$13,123
- − Insurance
- −$12,618
- − Repairs & maintenance
- −$17,760
- − Management
- −$17,760
- − Depreciation
- −$43,636
- Taxable income
- $33,079
- Est. tax owed @ 24.0%
- −$7,939
- After-tax cash flow
- $47,306/yr
For passive investors: Depreciation is non-cash, so a rental often shows a tax loss while cash-flowing — sheltering income. Rental losses are passive: they offset passive income freely, and up to $25,000/yr can offset ordinary (W-2) income if you actively participate and your MAGI is under $100k (phasing out to $0 by $150k); unused losses carry forward. On sale, claimed depreciation is recaptured at up to 25%, and gains may owe capital-gains tax (a 1031 exchange can defer both). Figures are a year-1 estimate at your 24.0% rate — not tax advice; consult a CPA.
Schools (NCES district)
- District
- Norfolk City Public School District
- NCES district ID
- 5102670
- Math proficiency
- 27% ▼ -44.00%
- Reading proficiency
- 56% ▼ -10.00%
- Median HH income
- $44,358
- Composite
- 35.08/100
- National rank
- #5026
- State rank
- #118 of 131 in VA
Livability — Norfolk
- Score
- 83/100
- State rank
- #43
- US rank
- #1026
Category grades
Schools grade is shown separately in the Schools card above.
Census & demographics
- Census place
- Norfolk, VA
- County
- Norfolk City · 214,042 people
- City population
- 214,042
- Metro
- Virginia Beach-Norfolk-Newport News, VA-NC
- Population (ZIP)
- 30,216
- Household income
- $67,649
- Rent vs Own
- Severe rent burden
- 1948.0
Population outlook (Norfolk County) Hauer SSP2
- Today (2025)
- 249,032 people
- By 2030
- 252,347 · +1.3%
- By 2040
- 253,644 · +1.9%
- By 2050
- 251,913 · +1.2%
- By 2075
- 245,281 · -1.5%
- By 2100
- 219,548 · -11.8%
Race, ethnicity, and origin ACS 2023
- Neighborhood character
- Diverse neighborhood (Simpson 0.63)
- Race & ethnicity
- White 56% Black 20% Hispanic / Latino 13% Two or more races 9% Asian 3% Native American 1%
- Hispanic origin (detail)
- Mexican 5% Puerto Rican 2%
- Common ancestry
- Lithuanian 2% Slovak 2% Romanian 2%
- Foreign-born
- 9% · Canada, China
- Languages at home
- 87% English-only · Spanish 8% Tagalog/Filipino 1% Other Asian/Pacific 1%
Political lean MEDSL · Norfolk
- 2024 margin
- Solid D (+41.5) · D 70.0% · R 28.5% · Other 1.6%
- 2008→2024 swing
- -1.4pp toward R · 2008: 43.0pp · 2024: 41.5pp
- All cycles
- 2024: D+41.5 2020: D+45.6 2016: D+42.0 2012: D+44.0 2008: D+43.0
Not yet ingested
- Civics
- —
Market trends
- HPI YoY
- ▼ -78.48%
- Current HPI
- 316.1563
- Rent YoY
- ▲ 4.76%
- Metro
- Virginia Beach-Norfolk-Newport News, VA-NC
- State GDP YoY
- ▲ 2.40%
- F500 in state
- 50
Industry mix (Fortune 500 HQ in VA)
| Industry | F500 HQs | Revenue |
|---|---|---|
| Aerospace / Defense | 4 | $236B |
|
||
| Technology / Defense | 3 | $32B |
|
||
| Financial Services | 2 | $176B |
|
||
| Utilities | 2 | $27B |
|
||
| Insurance | 2 | $25B |
|
||
| Technology | 2 | $15B |
|
||
Price history
+426.3% since first listed4 events — show timeline
- 2026-02-18 Price Changed $1,500,000 REINMLS
- 2026-01-16 Listed $1,590,000 REINMLS
- 2025-12-18 Sold (Public Records) $899,000 Public Records
- 2000-04-13 Sold (Public Records) $285,000 Public Records
Property tax history
+5.3%/yrLatest (2025): $13,123 · +18.6% YoY. Source: county tax records.
Cash-flow waterfall
monthlySold comps — $/sqft
last 12 mo · ≤1 miLoading sold comps…