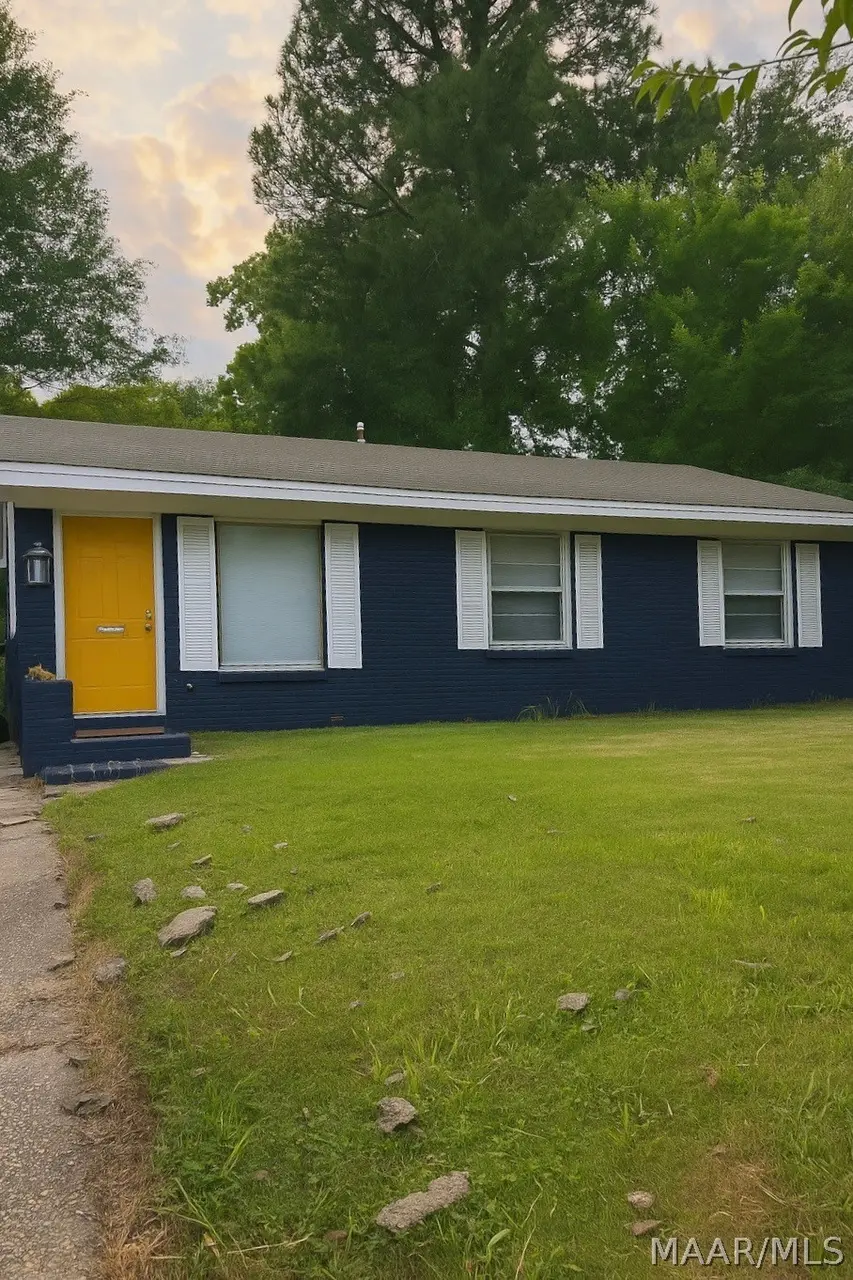
1522 Dunbar St · Montgomery, AL
Flood risk 1/10 · Minimal
- FEMA flood zone
- X (unshaded)
- Chance of flooding over 30 yrs
- 0.0%
- Est. flood insurance / yr
- $507 – $1,088
Fire risk 2/10 · Minimal
- Est. fire insurance / yr
- $916 – $1,700
Heat risk 7/10 · Major
- Hot days now (above 107°F)
- 7 days/yr
- Hot days in 30 yrs
- 20 days/yr
Wind risk 8/10 · Major
- Chance of severe wind over 30 yrs
- 80.0%
Air-quality risk 3/10 · Minor
- Unhealthy air days now
- 4 days/yr
- Unhealthy air days in 30 yrs
- 4 days/yr
Risk factors via First Street. Map © Google.
Why this score? — see what drove the B- grade
The composite is a weighted blend of 9 inputs, each scored 0–100. Each bar is that input's sub-score; the figure is the points it added to the 100-point composite (weight × sub-score).
- Cash flow +30.0/30.0
- 1% rule +10.0/10.0
- DSCR +10.0/10.0
- ARV discount +7.5/15.0
- Rent growth +4.1/5.0
- Livability +3.2/5.0
- Condition / age +2.5/5.0
- Schools +1.7/10.0
- Appreciation +0.0/10.0
$78,900
🖨 Deal sheet 📄 Offer letter ✓ Due diligence
Listing remarks
Turnkey opportunity just minutes from Alabama State University and Huntingdon College! This 3-bedroom, 1-bath home features hardwood floors throughout and is ready for immediate occupancy. Ideal for investors seeking a strong rental near campus or first-time buyers looking for an affordable, low-maintenance option. Convenient access to the interstate makes commuting easy. This property offers excellent potential and value. Schedule your private showing today!
Key facts
- Strong rental
- Excellent potential
- Convenient access
Tags
Property features AI
Finance
- Other: Annual tax information not included per instructions
- Financial info: Lease expiration: 2026-05-31
- HOA & community: No HOA information specified
Exterior
- Parking: Driveway
- Security: No security features specified
- Utilities: Public water; Public sewer; Utilities otherwise listed as unknown
- Home design: Single-story home; Brick construction; Slab foundation
- Construction: Built (year source: public records)
- Exterior features: Partial fencing; City lot
Interior
- Kitchen: Kitchen on the first level
- Bedrooms: Three bedrooms on the first level
- Flooring: Tile; Vinyl; Wood
- Bathrooms: One full bathroom
- Heating & cooling: Central heating (electric and gas); Central electric cooling
- Interior features: Tile, vinyl, and wood flooring; Water heater
- Laundry & utility: Utility features not specified
Neighborhood map
What this means for you Summary
Snapshot
- This is a 3-bed/1.0-bath single-family listed at $79k.
Deal economics
- At list price, monthly cash flow is $441 ($5k/yr) — positive.
- The deal already cash-flows at list — no discount required.
- Meets the 1% rule at list price ($1k rent vs $79k).
- Recommended offer: $77k (3.0% below list) — sets the bar for market timing.
- Cap rate 13.0% vs local median 6.0% in Montgomery — top-decile yield for the area; either an underpriced asset or a hidden risk that comps aren't pricing in. Stress-test before assuming the spread holds.
Location & tenants
- Location reads 65/100 on livability (#138 in AL) — a middle-class / working-renter tenant base. Strengths: cost of living A+, housing A+; Watch: schools C-, employment D, crime F.
- Montgomery County (urban): math 9% / reading 31% proficiency, ranked #106 of 129 in AL (top 82%) — low school quality limits family demand, transient renter base, plan for 1-2y turnover; 70% free/reduced lunch — lower-income household profile, screen leases tightly.
- Market conditions: Rents rising fast (+6.3%/yr); 137 active listings in the ZIP; 31 comparable units currently listed for rent nearby; rentals lingering (median 44d on market — plan ~5-8 weeks vacancy on turnover, expect pricing pressure); 52% of comp listings sitting > 30 days — soft ceiling on asking rent; 460 units permitted in Montgomery County in 2024 (37 in 5+ unit buildings).
Forward outlook
- Local home prices are declining (-3.0%/yr); year-one equity from $545 of loan paydown is wiped out by about $2k of value loss. Plan a longer hold.
- Montgomery County population projected to shrink 8% by 2050 — rents likely to lag national; underwrite the cash flow, not the appreciation.
- At projected returns (-3.0% appreciation + 6.3% rent growth), your $22k cash investment doubles in ~5 years — after that, you're playing with house money.
Negotiation context
- It's been on market 44 days — a 3% lower offer ($77k) is reasonable based on typical stale-listing flexibility.
Risks & watch-outs
- Watch-outs: built in 1940 — expect roof / HVAC / electrical / plumbing capex.
- Climate carrying-cost: severe wind risk, 80% chance of damaging wind over 30y; extreme-heat days projected 7→20/yr by 2055 (HVAC capex compounding) — expect insurance premiums to compound above CPI over the hold.
Questions for the listing agent
- It's been on market 44 days. Have you received any prior offers? Is the seller open to a 3% concession, seller financing, or rate buy-down credit?
- Built in 1940 — when were the roof, HVAC, electrical panel, plumbing, and water heater last replaced?
- Is there a deadline driving the sale (1031 exchange, divorce, estate, relocation)? That informs how much negotiation room exists.
- Crime grade is F in this area — have there been break-ins, vandalism, or insurance claims at this property in the last 3 years? What carrier currently insures it and at what premium?
- What's the average days-on-market for RENTAL listings here right now (not sales)? A rising rental-DOM trend means longer vacancies and softer asking-rent achievability than the comps imply.
- What's the recent tenant-quality profile in this submarket — average credit score on applications, eviction rate, late-payment / NSF rate, and stable-employment percentage? A property-management company in the area should have these aggregated.
- How much new for-sale + rental construction is in the pipeline within 1–3 miles? Heavy new supply typically softens prices + rents 12–24 months out; constrained supply supports both.
Investment metrics
- 1% rule
- 1.51% ✓
- Cap rate
- 13.00%
- Cash-on-cash
- 23.96%
- DSCR
- 2.07
- GRM
- 5.5
CMA / ARV
- ARV (median comp)
- $46,636
- List price
- $78,900
- Delta
- 69.18%
- Verdict
- OVERPRICED
- Comps
- 20 within 1.0 mi
Show comp detail 3 sales within ~0.75 mi
| Address | Dist | Beds/Ba | Sqft | Sold | Price | $/sf | Match |
|---|---|---|---|---|---|---|---|
| 1227 Woodward Ave | 0.32mi | 2/2.0 (-1) | 1,164 (+14%) | 4mo | $180,000 | $155 | 50 |
| 700 Genetta Ct | 0.58mi | 3/2.0 | 1,148 (+12%) | 6mo | $75,000 | $65 | 43 |
| 1208 S Mcdonough St | 0.67mi | 3/1.0 | 1,122 (+10%) | 21mo | $50,000 | $45 | 35 |
Match score weights: distance 35% · size 25% · config 20% · recency 20%. Top-matched comps best support the ARV.
Projected returns pro-forma
-3.0% appreciation · 6.29% rent growth · sell at horizon
- IRR
- 20.7%
- Equity multiple
- 1.88×
- Total profit
- $19,361
- Equity at exit
- $11,764
- IRR
- 30.9%
- Equity multiple
- 4.21×
- Total profit
- $70,833
- Equity at exit
- $6,822
Cash invested: $22,092 (down + closing). Projections, not guarantees.
Landlord ↔ Tenant lean methodology
- Overall (STATE)
- 90 Strongly Landlord-Friendly
- State Alabama
- 90 Strongly Landlord-Friendly · R+15
- County
- — inherits STATE
- City
- — inherits STATE
ZIP-level market 36106
- Home prices YoY
- -13.1%
- Rents YoY
- 6.3%
- Active inventory
- 137
- Price-to-rent
- 5.5×
Monthly cashflow live
- Estimated rent
- $1,189 high interval (Pro) →
- Mortgage (P&I)
- −$414
- Tax from tax record
- −$51 /mo · $615/yr
- Insurance
- −$33
- HOA
- −$0
- Vacancy / Maint / Mgmt
- −$250
- Net cashflow
- $441
Break-even live
UW: 25.0% down · 7.5% · 30yr · 1.5% tax · 5.0% vac · 8.0% maint · 8.0% mgmt
Financing live
Cash to close
- Down payment
- $19,725
- Closing costs
- $2,367
- Reserves months
- —
- Total cash needed
- —
Loan-product check · same deal, 3 products live
Conventional
25% down · 7.5% · 30yr
- Down + closing
- —
- Monthly P&I
- —
- Monthly cashflow
- —
- DSCR
- —
- Eligible?
- —
Personal DTI + credit; lowest rate.
DSCR
20% down · 8.5% · 30yr
- Down + closing
- —
- Monthly P&I
- —
- Monthly cashflow
- —
- DSCR
- —
- Eligible?
- —
No personal income docs; deal must DSCR.
Hard money
10% down · 12.0% · 12mo
- Down + closing
- —
- Monthly P&I
- —
- Monthly cashflow
- —
- DSCR
- —
- Eligible?
- —
Short-term bridge; refi at stabilization.
Rent comps 31 comps
| Address | Beds | Baths | Sqft | Rent | $/sqft | DOM | Units | Dist |
|---|---|---|---|---|---|---|---|---|
| 1343 Felder Ave Montgomery, AL | 2.0 | 1.0 | 1000 | $1,095 | $1.09 | 13d | 1 | 0.37mi |
| 1347 Felder Ave Montgomery, AL | 2.0 | 1.0 | 1000 | $1,095 | $1.09 | 13d | 1 | 0.37mi |
| 2727 Boultier St Montgomery, AL | 1.0–3.0 | 1.0–2.0 | 1070 | $1,582 | $1.48 | 13d | 3 | 0.50mi |
| 432 Clanton Ave Montgomery, AL | 2.0 | 1.0 | 800 | $995 | $1.24 | 13d | 1 | 0.52mi |
| 906 E Fairview Ave Unit 902 Montgomery, AL | 2.0 | 1.0 | 1100 | $995 | $0.90 | 21d | 1 | 0.57mi |
| 2020 E 3rd St Montgomery, AL | 2.0 | 1.0 | 1186 | $750 | $0.63 | 21d | 1 | 0.66mi |
| 1301 S Perry St Unit A Montgomery, AL | 2.0 | 1.0 | 1100 | $950 | $0.86 | 13d | 1 | 0.79mi |
| 2205 E 5th St Montgomery, AL | 3.0 | 1.0 | 1020 | $800 | $0.78 | 43d | 1 | 0.80mi |
| 2000 Cherry St Montgomery, AL | 2.0 | 1.0 | 1106 | $950 | $0.86 | 43d | 1 | 0.95mi |
| 24 Flood St Montgomery, AL | 2.0 | 1.0 | 1140 | $1,000 | $0.88 | 21d | 1 | 0.96mi |
| 671 S Perry St Montgomery, AL | 2.0 | 1.0–2.0 | 525 | $1,725 | $3.29 | 21d | 1 | 0.99mi |
| 3356 Audubon Rd Montgomery, AL | 2.0 | 1.5 | 1340 | $950 | $0.71 | 43d | 1 | 1.00mi |
| 105 Arlington Rd Unit B Montgomery, AL | 2.0 | 1.0 | 1100 | $925 | $0.84 | 43d | 1 | 1.01mi |
| 3369 Montezuma Rd Montgomery, AL | 3.0 | 1.0 | 1281 | $1,150 | $0.90 | 43d | 1 | 1.03mi |
| 3357 Lexington Rd Montgomery, AL | 2.0 | 1.0 | 1200 | $1,175 | $0.98 | 13d | 1 | 1.04mi |
| 945 E Edgemont Ave Unit 951 Montgomery, AL | 2.0 | 1.0 | 841 | $750 | $0.89 | 43d | 1 | 1.05mi |
| 951 E Edgemont Ave Montgomery, AL | 2.0 | 1.0 | 841 | $750 | $0.89 | 43d | 1 | 1.05mi |
| 2454 Spruce Curv Montgomery, AL | 3.0 | 1.0 | 988 | $1,100 | $1.11 | 43d | 1 | 1.07mi |
| 3338 S Hull St Montgomery, AL | 2.0 | 2.0 | 1311 | $1,150 | $0.88 | 21d | 1 | 1.11mi |
| 2009 Palmetto St Montgomery, AL | 3.0 | 1.0 | 1487 | $1,050 | $0.71 | 43d | 1 | 1.16mi |
| 1008 Pelham St Montgomery, AL | 4.0 | 2.0 | 1288 | $1,300 | $1.01 | 43d | 1 | 1.18mi |
| 3394 Southmont Dr Unit 3 Montgomery, AL | 2.0 | 1.0 | 810 | $1,050 | $1.30 | 43d | 1 | 1.26mi |
| 3394 Southmont Dr Unit 2 Montgomery, AL | 2.0 | 1.0 | 810 | $1,475 | $1.82 | 43d | 1 | 1.26mi |
| 3445 Le Bron Rd Montgomery, AL | 4.0 | 1.0 | 1100 | $1,050 | $0.95 | 21d | 1 | 1.32mi |
| 39 S Lewis St Montgomery, AL | 2.0 | 1.0 | 1209 | $950 | $0.79 | 43d | 1 | 1.38mi |
| 3515 Norman Bridge Rd Unit A Montgomery, AL | 2.0 | 1.0 | 1150 | $1,150 | $1.00 | 43d | 1 | 1.43mi |
| 1814 Pinecrest Dr Montgomery, AL | 3.0 | 1.0 | 1053 | $990 | $0.94 | 43d | 1 | 1.43mi |
| 1415 Madison Ave Apt E Montgomery, AL | 2.0 | 1.0 | 825 | $1,095 | $1.33 | 13d | 1 | 1.44mi |
| 1839 Robison Hill Rd Montgomery, AL | 4.0 | 2.0 | 1370 | $1,550 | $1.13 | 21d | 1 | 1.45mi |
| 1827 Capitol Ave Montgomery, AL | 2.0 | 1.0 | 1068 | $1,600 | $1.50 | 13d | 1 | 1.48mi |
| 1827 Capitol Ave Montgomery, AL | 2.0 | 1.0 | 1068 | $1,600 | $1.50 | 43d | 1 | 1.48mi |
Listing history 17 events
-
2026-06-18days on market $78,900 Active 44 DOM
-
2026-06-17days on market $78,900 Active 43 DOM
-
2026-06-16days on market $78,900 Active 42 DOM
-
2026-06-15days on market $78,900 Active 41 DOM
-
2026-06-14days on market $78,900 Active 39 DOM
-
2026-06-13days on market $78,900 Active 38 DOM
-
2026-06-10days on market $78,900 Active 36 DOM
-
2026-06-09days on market $78,900 Active 35 DOM
-
2026-06-09price $78,900 Active 34 DOM
-
2026-06-08days on market $80,000 Active 34 DOM
-
2026-06-07days on market $80,000 Active 33 DOM
-
2026-06-03days on market $80,000 Active 29 DOM
-
2026-06-02days on market $80,000 Active 28 DOM
-
2026-06-01days on market $80,000 Active 27 DOM
-
2026-05-31days on market $80,000 Active 26 DOM
-
2026-05-30days on market $80,000 Active 25 DOM
-
2026-05-05$80,000 Active 555-char remark
ⓘ Source: listings_history table (triggers on properties + properties_extension) + one-shot
backfill from property_details.listing_events for pre-trigger history.
Tax reassessment forecast AL · Resets to sale price
- Current annual tax
- $615 · $51/mo
- Projected year-2 tax
- $615 · $51/mo
- Expected delta
- $0/yr ($0/mo · 0.0%)
ⓘ Screening estimate from a state-policy table — verify with the county assessor before closing.
Climate risk First Street
- Flood 1/10 Low FEMA zone X (unshaded) · 0% chance over 30 yrs
- Wildfire 2/10 Low
- Heat 7/10 Severe 7 d/yr ≥107°F today · 20 d/yr by 30 yrs out
- Wind 8/10 Severe 80% chance of damaging wind over 30 yrs
- Air quality 3/10 Moderate 4 unhealthy d/yr today · 4 by 30 yrs out
Nearby sold comps map
Loading sold comps map…
Walkable amenities ~0.75 mi
Loading nearby amenities…
Taxation est. · year 1
- Rental income
- $14,263
- − Mortgage interest
- −$4,420
- − Property taxes
- −$615
- − Insurance
- −$394
- − Repairs & maintenance
- −$1,141
- − Management
- −$1,141
- − Depreciation
- −$2,295
- Taxable income
- $4,256
- Est. tax owed @ 24.0%
- −$1,022
- After-tax cash flow
- $4,272/yr
For passive investors: Depreciation is non-cash, so a rental often shows a tax loss while cash-flowing — sheltering income. Rental losses are passive: they offset passive income freely, and up to $25,000/yr can offset ordinary (W-2) income if you actively participate and your MAGI is under $100k (phasing out to $0 by $150k); unused losses carry forward. On sale, claimed depreciation is recaptured at up to 25%, and gains may owe capital-gains tax (a 1031 exchange can defer both). Figures are a year-1 estimate at your 24.0% rate — not tax advice; consult a CPA.
Schools (NCES district)
- District
- Montgomery County
- NCES district ID
- 0102430
- Math proficiency
- 9% ▼ -21.00%
- Reading proficiency
- 31% ▼ -1.00%
- Median HH income
- $43,902
- Composite
- 17.24/100
- National rank
- #9093
- State rank
- #106 of 129 in AL
Livability — Montgomery
- Score
- 65/100
- State rank
- #138
- US rank
- #13416
Category grades
Schools grade is shown separately in the Schools card above.
Census & demographics
- Census place
- Montgomery, AL
- County
- Montgomery County · 190,016 people
- City population
- 175,913
- Metro
- Montgomery, AL
- Population (ZIP)
- 14,065
- Household income
- $69,087
- Rent vs Own
- Severe rent burden
- 876.0
Population outlook (Montgomery County) Hauer SSP2
- Today (2025)
- 224,008 people
- By 2030
- 221,460 · -1.1%
- By 2040
- 214,179 · -4.4%
- By 2050
- 204,912 · -8.5%
- By 2075
- 177,821 · -20.6%
- By 2100
- 145,134 · -35.2%
Race, ethnicity, and origin ACS 2023
- Neighborhood character
- Diverse neighborhood (Simpson 0.58)
- Race & ethnicity
- White 47% Black 43% Hispanic / Latino 5% Two or more races 4% Asian 1%
- Hispanic origin (detail)
- Mexican 3%
- Common ancestry
- Serbian 2% Slovak 2% Italian 1%
- Foreign-born
- 4% · Canada, China, South Korea
- Languages at home
- 94% English-only · Spanish 3%
Political lean MEDSL · Montgomery
- 2024 margin
- Solid D (+30.7) · D 64.8% · R 34.1% · Other 1.1%
- 2008→2024 swing
- +11.5pp toward D · 2008: 19.2pp · 2024: 30.7pp
- All cycles
- 2024: D+30.7 2020: D+31.5 2016: D+26.2 2012: D+24.3 2008: D+19.2
Not yet ingested
- Civics
- —
Market trends
- HPI YoY
- ▼ -22.82%
- Current HPI
- 151.1822
- Rent YoY
- ▲ 6.29%
- Metro
- Montgomery, AL
- State GDP YoY
- ▲ 2.94%
- F500 in state
- 4
Industry mix (Fortune 500 HQ in AL)
| Industry | F500 HQs | Revenue |
|---|---|---|
| Financial Services | 1 | $8B |
|
||
| Healthcare | 1 | $5B |
|
||
Price history
-1.4% since first listed2 events — show timeline
- 2026-06-08 Price Changed $78,900 MAAR
- 2026-05-05 Listed $80,000 MAAR
Property tax history
+3.1%/yrLatest (2025): $615 · -8.9% YoY. Source: county tax records.
Cash-flow waterfall
monthlySold comps — $/sqft
last 12 mo · ≤1 miLoading sold comps…