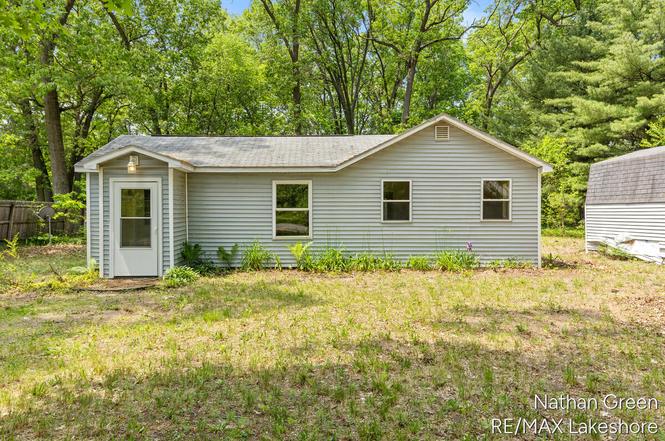
1267 Chatterson Rd · Wolf Lake, MI
Flood risk 1/10 · Minimal
- FEMA flood zone
- X (unshaded)
- Chance of flooding over 30 yrs
- 0.0%
- Est. flood insurance / yr
- $507 – $1,088
Fire risk 3/10 · Minor
- Est. fire insurance / yr
- $784 – $1,456
Heat risk 2/10 · Minimal
- Hot days now (above 94°F)
- 7 days/yr
- Hot days in 30 yrs
- 15 days/yr
Wind risk 1/10 · Minimal
- Chance of severe wind over 30 yrs
- —
Air-quality risk 3/10 · Minor
- Unhealthy air days now
- 3 days/yr
- Unhealthy air days in 30 yrs
- 5 days/yr
Risk factors via First Street. Map © Google.
Why this score? — see what drove the D grade
The composite is a weighted blend of 9 inputs, each scored 0–100. Each bar is that input's sub-score; the figure is the points it added to the 100-point composite (weight × sub-score).
- Cash flow +14.7/30.0
- ARV discount +7.5/15.0
- Rent growth +4.6/5.0
- DSCR +4.5/10.0
- 1% rule +3.5/10.0
- Livability +3.0/5.0
- Condition / age +2.5/5.0
- Schools +2.4/10.0
- Appreciation +0.0/10.0
$137,500
🖨 Deal sheet (PDF) 📄 Offer letter ✓ Due diligence
Listing remarks MLS
Don't miss this cozy, move-in ready, 2-bedroom, 1-bathroom home located in a quiet Muskegon neighborhood sitting on a large wooded lot. This property offers a layout perfect for first-time homebuyers, downsizers, savvy investors, or anyone looking for the perfect place to call home. Minutes away from local Muskegon parks, schools, and shopping centers with easy access to major roads for a quick commute around town. With rent prices skyrocketing, this could be what you're looking for. Call today!
Key facts
- 0.9 acre lot
- Built 1972
- Listed 3 days
Property features AI
Exterior
- Utilities: Well water; Natural gas water heater
- Home design: Single-family residence; Residential property
- Construction: Built in 1972; Vinyl siding; Composition roof
- Exterior features: Wooded lot; Shed(s) on the property
Interior
- Bathrooms: One full bathroom
- Heating & cooling: Forced air heating; Has heating
- Interior features: Six total rooms; Slab basement
Neighborhood map
What this means for you Summary
Snapshot
- This is a 2-bed/1.0-bath single-family listed at $138k.
Deal economics
- At list price, monthly cash flow is $35 ($424/yr) — positive.
- The deal already cash-flows at list — no discount required.
- To meet the 1% rule (rent ≥ 1% of price), the offer needs to be $118k (14.5% below list).
- Recommended offer: $118k (14.5% below list) — sets the bar for 1% rule.
- Cap rate 6.6% vs local median 3.8% in Wolf Lake — top-decile yield for the area; either an underpriced asset or a hidden risk that comps aren't pricing in. Stress-test before assuming the spread holds.
Location & tenants
- Location reads 60/100 on livability (#594 in MI) — a middle-class / working-renter tenant base. Strengths: cost of living A+, housing A+, crime B+; Watch: amenities F, commute F, employment F.
- Oakridge Public Schools (suburban): math 17% / reading 40% proficiency, ranked #389 of 540 in MI (top 72%) — low school quality limits family demand, transient renter base, plan for 1-2y turnover.
- Zoned schools: Oakridge Lower Elementary School (math 32% / reading 42%, grade F, #685 of 1,397 statewide, top 51%, 557 students, 76% FRL); Oakridge Upper Elementary School (math 13% / reading 35%, grade F, #1,030 of 1,397 statewide, top 74%, 421 students, 69% FRL); Oakridge High School (math 22% / reading 47%, grade F, #372 of 713 statewide, top 56%, 561 students, 63% FRL) — zoned schools average 69% FRL vs 54% district-wide (15 pts higher); higher-poverty schools than district average — tighter screening recommended.
- Market conditions: Rents rising fast (+8.2%/yr); 291 active listings in the ZIP; 438 units permitted in Muskegon County in 2024 (115 in 5+ unit buildings).
Forward outlook
- Local home prices are declining (-3.0%/yr); year-one equity from $951 of loan paydown is wiped out by about $4k of value loss. Plan a longer hold.
- Muskegon County population projected to shrink 8% by 2050 — rents likely to lag national; underwrite the cash flow, not the appreciation.
Negotiation context
- Only 3 days on market — expect competitive offers; lowballing is unlikely to land.
- 8 sale attempts since 9y ago with the ask held roughly flat each time — persistent listings suggest the price (not the market) is what's stuck; bring a comps-based counter.
- Current owner paid $74k; list at $138k implies a 86% gain — meaningful room to come down on a strong offer.
Questions for the listing agent
- Built in 1972 — when were the roof, HVAC, electrical panel, plumbing, and water heater last replaced?
- Is there a deadline driving the sale (1031 exchange, divorce, estate, relocation)? That informs how much negotiation room exists.
- Schools are F-rated, which usually means shorter tenancies and higher turnover. Who's the typical renter profile here, and what's been the actual vacancy rate?
- The area grade is low — what's the realistic commute time and amenity access for the typical tenant pool here? Any planned neighborhood developments (good or bad) we should know about?
- What's the average days-on-market for RENTAL listings here right now (not sales)? A rising rental-DOM trend means longer vacancies and softer asking-rent achievability than the comps imply.
- What's the recent tenant-quality profile in this submarket — average credit score on applications, eviction rate, late-payment / NSF rate, and stable-employment percentage? A property-management company in the area should have these aggregated.
- How much new for-sale + rental construction is in the pipeline within 1–3 miles? Heavy new supply typically softens prices + rents 12–24 months out; constrained supply supports both.
Investment metrics
- 1% rule
- 0.85% ✗
- Cap rate
- 6.60%
- Cash-on-cash
- 1.10%
- DSCR
- 1.05
- GRM
- 9.8
CMA / ARV
No comps found within radius.
Projected returns pro-forma
-3.0% appreciation · 8.0% rent growth · sell at horizon
- IRR
- -9.4%
- Equity multiple
- 0.64×
- Total profit
- $-13,837
- Equity at exit
- $20,502
- IRR
- 5.5%
- Equity multiple
- 1.49×
- Total profit
- $19,044
- Equity at exit
- $11,888
Cash invested: $38,500 (down + closing). Projections, not guarantees.
Landlord ↔ Tenant lean methodology
- Overall (STATE)
- 62 Landlord-Friendly
- State Michigan
- 62 Landlord-Friendly · EVEN
- County
- — inherits STATE
- City
- — inherits STATE
ZIP-level market 49442
- Rents YoY
- 8.2%
- Active inventory
- 291
- Price-to-rent
- 9.8×
Monthly cashflow live
- Estimated rent
- $1,175 medium interval (Pro) →
- Mortgage (P&I)
- −$721
- Tax from tax record
- −$115 /mo · $1,376/yr
- Insurance
- −$57
- HOA
- −$0
- Vacancy / Maint / Mgmt
- −$247
- Net cashflow
- $35
Break-even live
Sensitivity live
| Price | -10% $113 | -5% $74 | +0% $35 | +5% $-4 | +10% $-42 |
|---|---|---|---|---|---|
| Rent | -10% $-57 | -5% $-11 | +0% $35 | +5% $82 | +10% $128 |
| Rate | -1.0pp $105 | -0.5pp $70 | base $35 | +0.5pp $0 | +1.0pp $-37 |
UW: 25.0% down · 7.5% · 30yr · 1.5% tax · 5.0% vac · 8.0% maint · 8.0% mgmt
Financing live
Cash to close
- Down payment
- $34,375
- Closing costs
- $4,125
- Reserves months
- —
- Total cash needed
- —
Loan-product check · same deal, 3 products live
Conventional
25% down · 7.5% · 30yr
- Down + closing
- —
- Monthly P&I
- —
- Monthly cashflow
- —
- DSCR
- —
- Eligible?
- —
Personal DTI + credit; lowest rate.
DSCR
20% down · 8.5% · 30yr
- Down + closing
- —
- Monthly P&I
- —
- Monthly cashflow
- —
- DSCR
- —
- Eligible?
- —
No personal income docs; deal must DSCR.
Hard money
10% down · 12.0% · 12mo
- Down + closing
- —
- Monthly P&I
- —
- Monthly cashflow
- —
- DSCR
- —
- Eligible?
- —
Short-term bridge; refi at stabilization.
Listing history 5 events
-
2026-06-18status $137,500 Pending 3 DOM
-
2026-06-18days on market $137,500 Active 3 DOM
-
2026-06-17days on market $137,500 Active 2 DOM
-
2026-06-15remarks 500-char remark
Show marketing remark (500 chars)
Don't miss this cozy, move-in ready, 2-bedroom, 1-bathroom home located in a quiet Muskegon neighborhood sitting on a large wooded lot. This property offers a layout perfect for first-time homebuyers, downsizers, savvy investors, or anyone looking for the perfect place to call home. Minutes away from local Muskegon parks, schools, and shopping centers with easy access to major roads for a quick commute around town. With rent prices skyrocketing, this could be what you're looking for. Call today!
-
2026-06-15$137,500 Active 1 DOM
Show marketing remark (500 chars)
Don't miss this cozy, move-in ready, 2-bedroom, 1-bathroom home located in a quiet Muskegon neighborhood sitting on a large wooded lot. This property offers a layout perfect for first-time homebuyers, downsizers, savvy investors, or anyone looking for the perfect place to call home. Minutes away from local Muskegon parks, schools, and shopping centers with easy access to major roads for a quick commute around town. With rent prices skyrocketing, this could be what you're looking for. Call today!
ⓘ Source: listings_history table (triggers on properties + properties_extension) + one-shot
backfill from property_details.listing_events for pre-trigger history.
Tax reassessment forecast MI · Partial reset (capped growth)
- Current annual tax
- $1,376 · $115/mo
- Projected year-2 tax
- $1,747 · $146/mo
- Expected delta
- +$371/yr (+$31/mo · 26.9%)
ⓘ Screening estimate from a state-policy table — verify with the county assessor before closing.
Climate risk First Street
- Flood 1/10 Low FEMA zone X (unshaded) · 0% chance over 30 yrs
- Wildfire 3/10 Moderate
- Heat 2/10 Low 7 d/yr ≥94°F today · 15 d/yr by 30 yrs out
- Wind 1/10 Low
- Air quality 3/10 Moderate 3 unhealthy d/yr today · 5 by 30 yrs out
Nearby sold comps map
Loading sold comps map…
Walkable amenities ~0.75 mi
Loading nearby amenities…
Taxation est. · year 1
- Rental income
- $14,102
- − Mortgage interest
- −$7,702
- − Property taxes
- −$1,376
- − Insurance
- −$688
- − Repairs & maintenance
- −$1,128
- − Management
- −$1,128
- − Depreciation
- −$4,000
- Taxable loss
- −$1,920
- Est. tax savings @ 24.0%
- +$461
- After-tax cash flow
- $885/yr
For passive investors: Depreciation is non-cash, so a rental often shows a tax loss while cash-flowing — sheltering income. Rental losses are passive: they offset passive income freely, and up to $25,000/yr can offset ordinary (W-2) income if you actively participate and your MAGI is under $100k (phasing out to $0 by $150k); unused losses carry forward. On sale, claimed depreciation is recaptured at up to 25%, and gains may owe capital-gains tax (a 1031 exchange can defer both). Figures are a year-1 estimate at your 24.0% rate — not tax advice; consult a CPA.
Schools (NCES district)
- District
- Oakridge Public Schools
- NCES district ID
- 2626220
- Math proficiency
- 17% ▼ -8.00%
- Reading proficiency
- 40% ▼ -4.00%
- Median HH income
- $41,553
- Composite
- 24.06/100
- National rank
- #7762
- State rank
- #389 of 540 in MI
Livability — Wolf Lake
- Score
- 60/100
- State rank
- #594
- US rank
- #19391
Category grades
Schools grade is shown separately in the Schools card above.
Census & demographics
- Census place
- Wolf Lake, MI
- County
- Muskegon County · 107,917 people
- Metro
- Muskegon, MI
- Population (ZIP)
- 44,766
- Household income
- $48,563
- Rent vs Own
- Severe rent burden
- 1598.0
Population outlook (Muskegon County) Hauer SSP2
- Today (2025)
- 174,032 people
- By 2030
- 173,365 · -0.4%
- By 2040
- 168,877 · -3.0%
- By 2050
- 160,306 · -7.9%
- By 2075
- 134,426 · -22.8%
- By 2100
- 98,836 · -43.2%
Race, ethnicity, and origin ACS 2023
- Neighborhood character
- Diverse neighborhood (Simpson 0.56)
- Race & ethnicity
- White 63% Black 22% Two or more races 10% Hispanic / Latino 8%
- Hispanic origin (detail)
- Mexican 7%
- Common ancestry
- Iranian 5% Romanian 4% Lithuanian 3%
- Foreign-born
- 3% · Canada, South Korea
- Languages at home
- 95% English-only · Spanish 3%
Political lean MEDSL · Muskegon
- 2024 margin
- Toss-up / Even · D 48.4% · R 50.2% · Other 1.5%
- 2008→2024 swing
- -31.1pp toward R · 2008: 29.3pp · 2024: -1.8pp
- All cycles
- 2024: R+1.8 2020: D+0.6 2016: D+0.9 2012: D+17.8 2008: D+29.3
Not yet ingested
- Civics
- —
Market trends
- HPI YoY
- ▼ -174.87%
- Current HPI
- 287.0558
- Rent YoY
- ▲ 8.21%
- Metro
- Muskegon, MI
- State GDP YoY
- ▲ 1.37%
- F500 in state
- 28
Industry mix (Fortune 500 HQ in MI)
| Industry | F500 HQs | Revenue |
|---|---|---|
| Automotive Parts | 3 | $48B |
|
||
| Automotive | 2 | $372B |
|
||
| Chemicals | 1 | $45B |
|
||
| Automotive Retail | 1 | $29B |
|
||
| Healthcare / Medical Devices | 1 | $23B |
|
||
| Automotive Technology | 1 | $20B |
|
||
Price history
+111.5% since first listed17 events — show timeline
- 2026-06-15 Listed $137,500 REALCOMP
- 2026-06-15 Listed $137,500 SW Michigan MLS
- 2026-06-15 Listed $137,500 MiRealSource-MiMLS
- 2019-09-18 Sold (Public Records) $74,000 Public Records
- 2019-09-13 Sold (MLS) $74,000 SW Michigan MLS
- 2019-09-13 Sold (MLS) $74,000 REALCOMP
- 2019-07-24 Pending — SW Michigan MLS
- 2019-07-13 Listed $73,999 MiRealSource-MiMLS
- 2019-07-13 Listed $73,999 SW Michigan MLS
- 2019-07-13 Listed $73,999 REALCOMP
- 2017-06-22 Sold (Public Records) $60,000 Public Records
- 2017-06-14 Sold (MLS) $60,000 SW Michigan MLS
- 2017-06-14 Sold (MLS) $60,000 REALCOMP
- 2017-04-27 Pending — SW Michigan MLS
- 2017-03-09 Listed $60,000 SW Michigan MLS
- 2017-03-06 Listed $60,000 REALCOMP
- 2008-01-08 Sold (Public Records) $65,000 Public Records
Property tax history
+7.1%/yrLatest (2025): $1,376 · +3.0% YoY. Source: county tax records.
Cash-flow waterfall
monthlySold comps — $/sqft
last 12 mo · ≤1 miLoading sold comps…