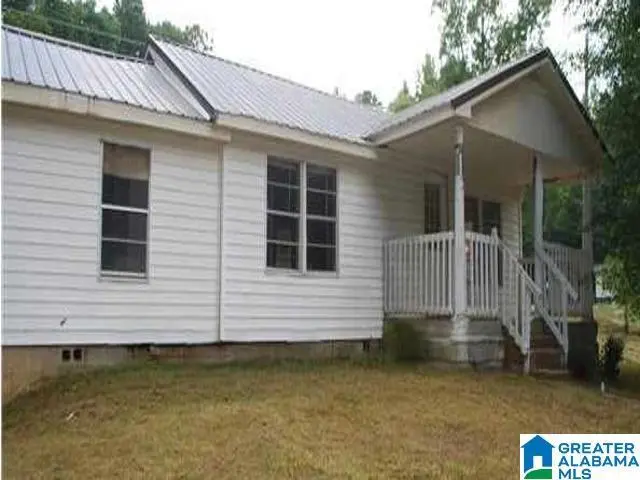
7601 Cedar Ave · Leeds, AL
Flood risk 1/10 · Minimal
- FEMA flood zone
- X (unshaded)
- Chance of flooding over 30 yrs
- 0.0%
- Est. flood insurance / yr
- $507 – $1,088
Fire risk 4/10 · Minor
- Est. fire insurance / yr
- $916 – $1,700
Heat risk 6/10 · Moderate
- Hot days now (above 106°F)
- 7 days/yr
- Hot days in 30 yrs
- 19 days/yr
Wind risk 6/10 · Moderate
- Chance of severe wind over 30 yrs
- 27.0%
Air-quality risk 3/10 · Minor
- Unhealthy air days now
- 3 days/yr
- Unhealthy air days in 30 yrs
- 5 days/yr
Risk factors via First Street. Map © Google.
Why this score? — see what drove the C+ grade
The composite is a weighted blend of 9 inputs, each scored 0–100. Each bar is that input's sub-score; the figure is the points it added to the 100-point composite (weight × sub-score).
- Cash flow +30.0/30.0
- 1% rule +10.0/10.0
- DSCR +10.0/10.0
- Livability +3.0/5.0
- Schools +2.8/10.0
- Rent growth +2.5/5.0
- Condition / age +2.5/5.0
- ARV discount +0.0/15.0
- Appreciation +0.0/10.0
$75,000
🖨 Deal sheet (PDF) 📄 Offer letter ✓ Due diligence
Listing remarks MLS
Nice two bedroom one bath home on a corner lot. Home is just outside the Leeds downtown area. Home has a large flat corner lot, metal roof, updated kitchen and bath. This would make a great home for a first time home buyer.
Key facts
- New pillars
- Tenant occupied
- New facial boards
Tags
Property features AI
Finance
- Other: Parcel ID: 25-00-28-1-005-007.000; Lot size approximately 0.34 acres
- Financial info: Down payment assistance available; Garbage fee charged quarterly ($50)
Exterior
- Parking: Driveway parking; Multi-level parking
- Utilities: Public water; Connected sewer; Electric water heater; Internet service availability unknown
- Home design: Existing property; Siding: vinyl; Crawl space foundation
- Construction: Vinyl siding construction
- Exterior features: Not waterfront; No pool; No patio; No decks; No garden/patio; Lot view: none
Interior
- Kitchen: Laminate countertops; Breakfast bar; Refrigerator; Electric stove
- Bedrooms: Master bedroom on main level; Additional bedroom on main level
- Flooring: Carpet; Hardwood laminate; Vinyl
- Bathrooms: One full bathroom with separate shower
- Heating & cooling: Central heating (electric); Central cooling (electric)
- Interior features: Ceilings: other (see remarks); Living area reported as 912
- Laundry & utility: Laundry room on main level; Washer hookup; Electric dryer hookup; Pull-down attic
Neighborhood map
What this means for you Summary
Snapshot
- This is a 3-bed/1.0-bath single-family listed at $75k.
Deal economics
- At list price, monthly cash flow is $442 ($5k/yr) — positive.
- The deal already cash-flows at list — no discount required.
- Meets the 1% rule at list price ($1k rent vs $75k).
- Recommended offer: $66k (12.0% below list) — sets the bar for market timing.
Location & tenants
- Location reads 60/100 on livability (#286 in AL) — a middle-class / working-renter tenant base. Strengths: cost of living A+, housing A+, employment B+; Watch: crime D+, amenities F, commute F.
- Leeds City (suburban): math 20% / reading 45% proficiency, ranked #51 of 129 in AL (top 40%) — families likely to look elsewhere, expect single-tenant / working-renter base with shorter leases.
- Zoned schools: Leeds Primary School (509 students, 42% FRL); Leeds High School (math 17% / reading 22%, grade F, #169 of 305 statewide, top 59%, 619 students, 52% FRL) — zoned schools at 47% FRL track the district average.
- Zoned-school proficiency averages 20% at this address vs 32% district-wide (-13 pts) — the specific schools serving this property underperform the Leeds City average; the district grade overstates school quality for this exact location.
- Market conditions: 158 active listings in the ZIP; 4 comparable units currently listed for rent nearby; rentals at typical pace (median 20d on market — plan ~3-4 weeks tenant-placement turnaround); 2,114 units permitted in Jefferson County in 2024 (556 in 5+ unit buildings).
Forward outlook
- Local home prices are declining (-3.0%/yr); year-one equity from $519 of loan paydown is wiped out by about $2k of value loss. Plan a longer hold.
- Jefferson County population projected to shrink 4% by 2050 — rents likely to lag national; underwrite the cash flow, not the appreciation.
- At projected returns (-3.0% appreciation + 3.0% rent growth), your $21k cash investment doubles in ~5 years — after that, you're playing with house money.
Negotiation context
- It's been on market 152 days — a 12% lower offer ($66k) is reasonable based on typical stale-listing flexibility.
- 4 sale attempts since 12y ago; this cycle's ask has dropped $18k (19%) from the opening price — seller is motivated, your offer sets the floor, not the list.
- Current owner paid $12k; list at $75k implies a 525% gain — meaningful room to come down on a strong offer.
Risks & watch-outs
- Watch-outs: built in 1940 — expect roof / HVAC / electrical / plumbing capex.
- Climate carrying-cost: major wind risk, 27% chance of damaging wind over 30y; extreme-heat days projected 7→19/yr by 2055 (HVAC capex compounding) — expect insurance premiums to compound above CPI over the hold.
Questions for the listing agent
- It's been on market 152 days. Have you received any prior offers? Is the seller open to a 12% concession, seller financing, or rate buy-down credit?
- Built in 1940 — when were the roof, HVAC, electrical panel, plumbing, and water heater last replaced?
- Why hasn't it sold? Are there any deal-killer items the seller is aware of (foundation, flood, title, zoning, code violations)?
- Is there a deadline driving the sale (1031 exchange, divorce, estate, relocation)? That informs how much negotiation room exists.
- Crime grade is D in this area — have there been break-ins, vandalism, or insurance claims at this property in the last 3 years? What carrier currently insures it and at what premium?
- What's the average days-on-market for RENTAL listings here right now (not sales)? A rising rental-DOM trend means longer vacancies and softer asking-rent achievability than the comps imply.
- What's the recent tenant-quality profile in this submarket — average credit score on applications, eviction rate, late-payment / NSF rate, and stable-employment percentage? A property-management company in the area should have these aggregated.
- How much new for-sale + rental construction is in the pipeline within 1–3 miles? Heavy new supply typically softens prices + rents 12–24 months out; constrained supply supports both.
Investment metrics
- 1% rule
- 1.52% ✓
- Cap rate
- 13.37%
- Cash-on-cash
- 25.28%
- DSCR
- 2.12
- GRM
- 5.5
CMA / ARV
- ARV (on-the-fly)
- $62,928
- Comps found
- 1
Show comp detail 1 sale within ~0.75 mi
| Address | Dist | Beds/Ba | Sqft | Sold | Price | $/sf | Match |
|---|---|---|---|---|---|---|---|
| 519 Oak St | 0.06mi | 3/1.0 | 832 (-9%) | 22mo | $57,000 | $69 | 64 |
Match score weights: distance 35% · size 25% · config 20% · recency 20%. Top-matched comps best support the ARV.
Projected returns pro-forma
-3.0% appreciation · 3.0% rent growth · sell at horizon
- IRR
- 18.8%
- Equity multiple
- 1.76×
- Total profit
- $16,000
- Equity at exit
- $11,183
- IRR
- 27.1%
- Equity multiple
- 3.39×
- Total profit
- $50,134
- Equity at exit
- $6,485
Cash invested: $21,000 (down + closing). Projections, not guarantees.
Landlord ↔ Tenant lean methodology
- Overall (STATE)
- 90 Strongly Landlord-Friendly
- State Alabama
- 90 Strongly Landlord-Friendly · R+15
- County
- — inherits STATE
- City
- — inherits STATE
ZIP-level market 35094
- Home prices YoY
- -9.7%
- Active inventory
- 158
- Price-to-rent
- 5.5×
Monthly cashflow live
- Estimated rent
- $1,143 medium interval (Pro) →
- Mortgage (P&I)
- −$393
- Tax from tax record
- −$36 /mo · $432/yr
- Insurance
- −$31
- HOA
- −$0
- Vacancy / Maint / Mgmt
- −$240
- Net cashflow
- $442
Break-even live
Sensitivity live
| Price | -10% $485 | -5% $464 | +0% $442 | +5% $421 | +10% $400 |
|---|---|---|---|---|---|
| Rent | -10% $352 | -5% $397 | +0% $442 | +5% $487 | +10% $533 |
| Rate | -1.0pp $480 | -0.5pp $461 | base $442 | +0.5pp $423 | +1.0pp $403 |
UW: 25.0% down · 7.5% · 30yr · 1.5% tax · 5.0% vac · 8.0% maint · 8.0% mgmt
Financing live
Cash to close
- Down payment
- $18,750
- Closing costs
- $2,250
- Reserves months
- —
- Total cash needed
- —
Loan-product check · same deal, 3 products live
Conventional
25% down · 7.5% · 30yr
- Down + closing
- —
- Monthly P&I
- —
- Monthly cashflow
- —
- DSCR
- —
- Eligible?
- —
Personal DTI + credit; lowest rate.
DSCR
20% down · 8.5% · 30yr
- Down + closing
- —
- Monthly P&I
- —
- Monthly cashflow
- —
- DSCR
- —
- Eligible?
- —
No personal income docs; deal must DSCR.
Hard money
10% down · 12.0% · 12mo
- Down + closing
- —
- Monthly P&I
- —
- Monthly cashflow
- —
- DSCR
- —
- Eligible?
- —
Short-term bridge; refi at stabilization.
Rent comps 4 comps
| Address | Beds | Baths | Sqft | Rent | $/sqft | DOM | Units | Dist |
|---|---|---|---|---|---|---|---|---|
| 8010 4th Ave Unit 202 Leeds, AL | 2.0 | 1.0 | 1008 | $595 | $0.59 | 4d | 1 | 1.13mi |
| 8010 4th Ave Unit 120 Leeds, AL | 2.0 | 1.0 | 1008 | $615 | $0.61 | 16d | 1 | 1.13mi |
| 8010 4th Ave Apt 114 Leeds, AL | 2.0 | 1.0 | 1008 | $690 | $0.68 | 44d | 1 | 1.14mi |
| 1400 Illinois St Leeds, AL | 3.0 | 1.5 | 995 | $1,200 | $1.21 | 20d | 1 | 1.49mi |
Listing history 5 events
-
2026-06-18days on market $75,000 Active 152 DOM
-
2026-06-17days on market $75,000 Active 151 DOM
-
2026-06-16days on market $75,000 Active 150 DOM
-
2026-06-15remarks 533-char remark
-
2026-06-15$75,000 Active 149 DOM
ⓘ Source: listings_history table (triggers on properties + properties_extension) + one-shot
backfill from property_details.listing_events for pre-trigger history.
Tax reassessment forecast AL · Resets to sale price
- Current annual tax
- $432 · $36/mo
- Projected year-2 tax
- $432 · $36/mo
- Expected delta
- $0/yr ($0/mo · 0.0%)
ⓘ Screening estimate from a state-policy table — verify with the county assessor before closing.
Climate risk First Street
- Flood 1/10 Low FEMA zone X (unshaded) · 0% chance over 30 yrs
- Wildfire 4/10 Moderate
- Heat 6/10 Major 7 d/yr ≥106°F today · 19 d/yr by 30 yrs out
- Wind 6/10 Major 27% chance of damaging wind over 30 yrs
- Air quality 3/10 Moderate 3 unhealthy d/yr today · 5 by 30 yrs out
Nearby sold comps map
Loading sold comps map…
Walkable amenities ~0.75 mi
Loading nearby amenities…
Taxation est. · year 1
- Rental income
- $13,714
- − Mortgage interest
- −$4,201
- − Property taxes
- −$432
- − Insurance
- −$375
- − Repairs & maintenance
- −$1,097
- − Management
- −$1,097
- − Depreciation
- −$2,182
- Taxable income
- $4,330
- Est. tax owed @ 24.0%
- −$1,039
- After-tax cash flow
- $4,269/yr
For passive investors: Depreciation is non-cash, so a rental often shows a tax loss while cash-flowing — sheltering income. Rental losses are passive: they offset passive income freely, and up to $25,000/yr can offset ordinary (W-2) income if you actively participate and your MAGI is under $100k (phasing out to $0 by $150k); unused losses carry forward. On sale, claimed depreciation is recaptured at up to 25%, and gains may owe capital-gains tax (a 1031 exchange can defer both). Figures are a year-1 estimate at your 24.0% rate — not tax advice; consult a CPA.
Schools (NCES district)
- District
- Leeds City
- NCES district ID
- 0100011
- Math proficiency
- 20% ▼ -25.00%
- Reading proficiency
- 45% ▲ 3.00%
- Median HH income
- $50,367
- Composite
- 28.21/100
- National rank
- #6803
- State rank
- #51 of 129 in AL
Livability — Leeds
- Score
- 60/100
- State rank
- #286
- US rank
- #18674
Category grades
Schools grade is shown separately in the Schools card above.
Census & demographics
- Census place
- Leeds, AL
- County
- Jefferson County · 527,445 people
- City population
- 14,854
- Metro
- Birmingham-Hoover, AL
- Population (ZIP)
- 14,854
- Household income
- $74,625
- Rent vs Own
- Severe rent burden
- 248.0
Population outlook (Jefferson County) Hauer SSP2
- Today (2025)
- 669,185 people
- By 2030
- 669,694 · +0.1%
- By 2040
- 661,388 · -1.2%
- By 2050
- 643,086 · -3.9%
- By 2075
- 577,267 · -13.7%
- By 2100
- 474,758 · -29.1%
Race, ethnicity, and origin ACS 2023
- Neighborhood character
- Predominantly White (77%)
- Race & ethnicity
- White 77% Black 12% Hispanic / Latino 9% Two or more races 7%
- Hispanic origin (detail)
- Mexican 5% Puerto Rican 2%
- Common ancestry
- Slovak 3% Serbian 2% Italian 1%
- Foreign-born
- 3% · Canada
- Languages at home
- 92% English-only · Spanish 8%
Political lean MEDSL · Jefferson
- 2024 margin
- D (+10.4) · D 54.6% · R 44.2% · Other 1.2%
- 2008→2024 swing
- +5.4pp toward D · 2008: 5.1pp · 2024: 10.4pp
- All cycles
- 2024: D+10.4 2020: D+13.2 2016: D+7.2 2012: D+6.0 2008: D+5.1
Not yet ingested
- Civics
- —
Market trends
- HPI YoY
- ▼ -23.99%
- Current HPI
- 223.9527
- Rent YoY
- —
- Metro
- Birmingham-Hoover, AL
- State GDP YoY
- ▲ 2.94%
- F500 in state
- 4
Industry mix (Fortune 500 HQ in AL)
| Industry | F500 HQs | Revenue |
|---|---|---|
| Financial Services | 1 | $8B |
|
||
| Healthcare | 1 | $5B |
|
||
Price history
+581.8% since first listed10 events — show timeline
- 2026-06-13 Relisted — Greater Alabama MLS
- 2026-02-20 Delisted — Greater Alabama MLS
- 2025-12-12 Price Changed $75,000 Greater Alabama MLS
- 2025-12-11 Relisted — Greater Alabama MLS
- 2025-09-01 Delisted — Greater Alabama MLS
- 2025-07-29 Contingent — Greater Alabama MLS
- 2025-06-16 Listed $92,500 Greater Alabama MLS
- 2014-11-05 Sold (MLS) $12,000 Greater Alabama MLS
- 2014-08-07 Listed $16,900 Greater Alabama MLS
- 1988-09-09 Sold (Public Records) $11,000 Public Records
Property tax history
+10.0%/yrLatest (2025): $432 · +0.0% YoY. Source: county tax records.
Cash-flow waterfall
monthlySold comps — $/sqft
last 12 mo · ≤1 miLoading sold comps…