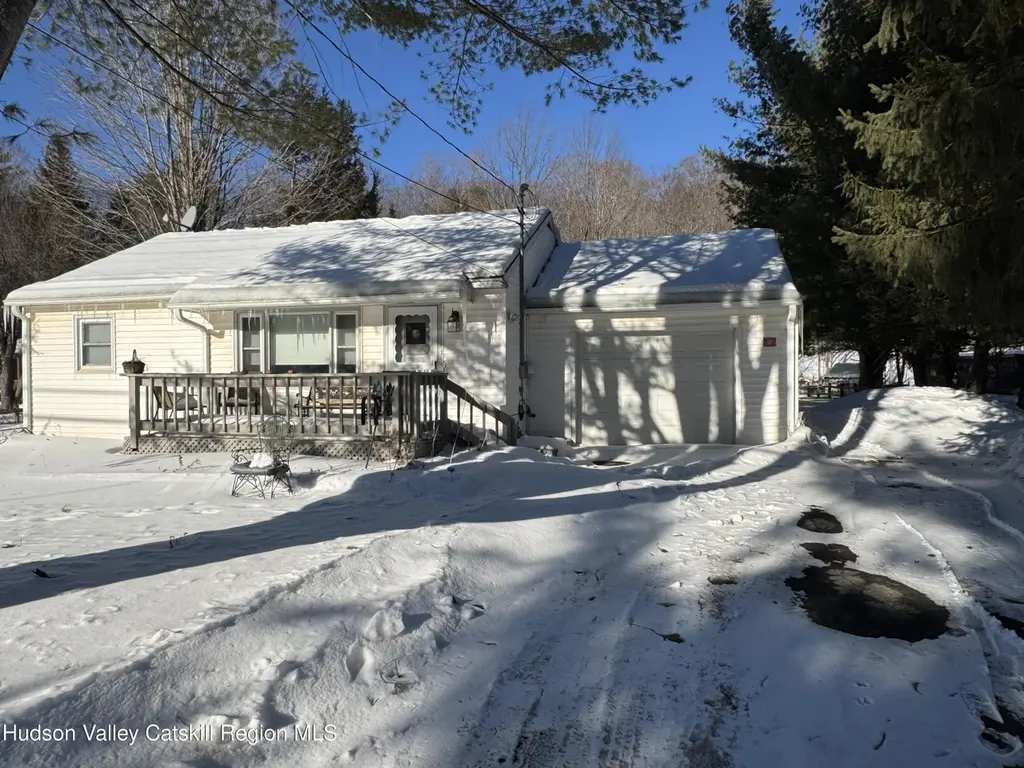
107 Route 40 Rd · Windham, NY
Flood risk 1/10 · Minimal
- FEMA flood zone
- X (unshaded)
- Chance of flooding over 30 yrs
- 0.0%
- Est. flood insurance / yr
- $507 – $1,088
Fire risk 2/10 · Minimal
- Est. fire insurance / yr
- $691 – $1,283
Heat risk 1/10 · Minimal
- Hot days now (above 87°F)
- 6 days/yr
- Hot days in 30 yrs
- 12 days/yr
Wind risk 2/10 · Minimal
- Chance of severe wind over 30 yrs
- 2.0%
Air-quality risk 2/10 · Minimal
- Unhealthy air days now
- 0 days/yr
- Unhealthy air days in 30 yrs
- 1 days/yr
Risk factors via First Street. Map © Google.
Why this score? — see what drove the D grade
The composite is a weighted blend of 9 inputs, each scored 0–100. Each bar is that input's sub-score; the figure is the points it added to the 100-point composite (weight × sub-score).
- Cash flow +11.0/30.0
- Appreciation +7.5/10.0
- Schools +4.3/10.0
- ARV discount +3.3/15.0
- 1% rule +3.2/10.0
- DSCR +3.2/10.0
- Livability +3.0/5.0
- Rent growth +2.5/5.0
- Condition / age +2.2/5.0
$279,990
🖨 Deal sheet (PDF) 📄 Offer letter ✓ Due diligence
Listing remarks MLS
Charming 2 bed home near Windham Mountain. Close to 3 additional ski hills within 35 min. Endless outdoor adverntures await. Welcome to this beautiful 2 bd 1 ba home tucked away in the small hamlet of Hensonville NY. Located minutes from local restaurants and activities. This inviting property offers the ideal blend of comfort and location. Wheather you are looking for a full time residence, weekend retreat, or an income producing getaway. .. this home delivers it all. Beatutiful property with outdoor space to relax and entertain plus a huge outdoor deck from the home to the back lawn. Close to CD Lane Park which is a hidden jewel, that offers multiple summer activities. The area also offers Hiking, biking, fishing, snowmobiling, off roading and exsploration of the beautiful Catskill Mountains. This is your chance to own a home at a reasonable price in one of the areas most desirable destinations.
Key facts
- Close to ski hills
- Huge outdoor deck
- 0.46 acre lot
Tags
Neighborhood map
What this means for you Summary
Snapshot
- This is a 2-bed/1.0-bath single-family listed at $280k. Condition is rated fair.
Deal economics
- At list price, monthly cash flow is $-116 ($-1k/yr) — negative.
- To cash-flow at today's rent, offer at most $263k (6.0% below list).
- To meet the 1% rule (rent ≥ 1% of price), the offer needs to be $230k (17.8% below list).
- Recommended offer: $230k (17.8% below list) — sets the bar for 1% rule.
- Cap rate 5.8% vs local median 3.4% in Windham — top-decile yield for the area; either an underpriced asset or a hidden risk that comps aren't pricing in. Stress-test before assuming the spread holds.
Location & tenants
- Location reads 60/100 on livability (#964 in NY) — a middle-class / working-renter tenant base. Strengths: housing A+, employment B+; Watch: schools C-, crime D+, cost of living D+.
- Windham-Ashland-Jewett Central School District (rural): math 55% / reading 40% proficiency, ranked #517 of 755 in NY (top 68%) — families likely to look elsewhere, expect single-tenant / working-renter base with shorter leases.
- Market conditions: 145 active listings in the ZIP; 97 units permitted in Greene County in 2024 (0 in 5+ unit buildings).
Forward outlook
- In year one you build about $16k of equity ($2k loan paydown + $14k appreciation (5.1% local appreciation)).
- Greene County population projected at -22% by 2050 — secular population decline; favor cash flow + early exit over multi-decade hold.
- By year 3, paydown + projected appreciation supports a ~$40k cash-out refi (75% LTV) — recoverable capital for the next deal without selling this one.
Negotiation context
- It's been on market 119 days — a 9% lower offer ($255k) is reasonable based on typical stale-listing flexibility.
Risks & watch-outs
- Watch-outs: built in 1957 — expect roof / HVAC / electrical / plumbing capex.
Questions for the listing agent
- What do current leases actually rent for vs. the listed asking? Can we see a recent rent roll and the last 12 months of T-12 income?
- It's been on market 119 days. Have you received any prior offers? Is the seller open to a 18% concession, seller financing, or rate buy-down credit?
- Have any recent inspections been done? Can we get a copy of the seller's disclosures and any deferred-maintenance estimates?
- Built in 1957 — when were the roof, HVAC, electrical panel, plumbing, and water heater last replaced?
- Why hasn't it sold? Are there any deal-killer items the seller is aware of (foundation, flood, title, zoning, code violations)?
- Is there a deadline driving the sale (1031 exchange, divorce, estate, relocation)? That informs how much negotiation room exists.
- Crime grade is D in this area — have there been break-ins, vandalism, or insurance claims at this property in the last 3 years? What carrier currently insures it and at what premium?
- The area grade is low — what's the realistic commute time and amenity access for the typical tenant pool here? Any planned neighborhood developments (good or bad) we should know about?
- What's the average days-on-market for RENTAL listings here right now (not sales)? A rising rental-DOM trend means longer vacancies and softer asking-rent achievability than the comps imply.
- What's the recent tenant-quality profile in this submarket — average credit score on applications, eviction rate, late-payment / NSF rate, and stable-employment percentage? A property-management company in the area should have these aggregated.
- How much new for-sale + rental construction is in the pipeline within 1–3 miles? Heavy new supply typically softens prices + rents 12–24 months out; constrained supply supports both.
Investment metrics
- 1% rule
- 0.82% ✗
- Cap rate
- 5.80%
- Cash-on-cash
- -1.78%
- DSCR
- 0.92
- GRM
- 10.1
CMA / ARV
- ARV (median comp)
- $255,991
- List price
- $279,990
- Delta
- 9.37%
- Verdict
- FAIR
- Comps
- 2 within 2.0 mi
Projected returns pro-forma
5.06% appreciation · 3.0% rent growth · sell at horizon
- IRR
- 11.5%
- Equity multiple
- 1.74×
- Total profit
- $58,072
- Equity at exit
- $159,621
- IRR
- 12.7%
- Equity multiple
- 3.32×
- Total profit
- $181,650
- Equity at exit
- $276,276
Cash invested: $78,397 (down + closing). Projections, not guarantees.
Landlord ↔ Tenant lean methodology
- Overall (STATE)
- 15 Strongly Tenant-Friendly
- State New York
- 15 Strongly Tenant-Friendly · D+10
- County
- — inherits STATE
- City
- — inherits STATE
ZIP-level market 12496
- Home prices YoY
- 1.2%
- Active inventory
- 145
- Price-to-rent
- 10.1×
Monthly cashflow live
- Estimated rent
- $2,302 medium interval (Pro) →
- Mortgage (P&I)
- −$1,468
- Tax est. 1.5%
- −$350 /mo · $4,200/yr
- Insurance
- −$117
- HOA
- −$0
- Vacancy / Maint / Mgmt
- −$483
- Net cashflow
- $-116
Break-even live
Sensitivity live
| Price | -10% $77 | -5% $-19 | +0% $-116 | +5% $-213 | +10% $-310 |
|---|---|---|---|---|---|
| Rent | -10% $-298 | -5% $-207 | +0% $-116 | +5% $-25 | +10% $66 |
| Rate | -1.0pp $25 | -0.5pp $-45 | base $-116 | +0.5pp $-189 | +1.0pp $-262 |
UW: 25.0% down · 7.5% · 30yr · 1.5% tax · 5.0% vac · 8.0% maint · 8.0% mgmt
Financing live
Cash to close
- Down payment
- $69,998
- Closing costs
- $8,400
- Reserves months
- —
- Total cash needed
- —
Loan-product check · same deal, 3 products live
Conventional
25% down · 7.5% · 30yr
- Down + closing
- —
- Monthly P&I
- —
- Monthly cashflow
- —
- DSCR
- —
- Eligible?
- —
Personal DTI + credit; lowest rate.
DSCR
20% down · 8.5% · 30yr
- Down + closing
- —
- Monthly P&I
- —
- Monthly cashflow
- —
- DSCR
- —
- Eligible?
- —
No personal income docs; deal must DSCR.
Hard money
10% down · 12.0% · 12mo
- Down + closing
- —
- Monthly P&I
- —
- Monthly cashflow
- —
- DSCR
- —
- Eligible?
- —
Short-term bridge; refi at stabilization.
Listing history 16 events
-
2026-06-21days on market $279,990 Active 119 DOM
-
2026-06-18days on market $279,990 Active 117 DOM
-
2026-06-17days on market $279,990 Active 116 DOM
-
2026-06-16days on market $279,990 Active 115 DOM
-
2026-06-15days on market $279,990 Active 114 DOM
-
2026-06-13days on market $279,990 Active 112 DOM
-
2026-06-12days on market $279,990 Active 111 DOM
-
2026-06-09days on market $279,990 Active 108 DOM
-
2026-06-08days on market $279,990 Active 107 DOM
-
2026-06-07days on market $279,990 Active 106 DOM
-
2026-06-07days on market $279,990 Active 105 DOM
-
2026-06-04days on market $279,990 Active 102 DOM
-
2026-06-02days on market $279,990 Active 101 DOM
-
2026-06-01days on market $279,990 Active 100 DOM
-
2026-05-31days on market $279,990 Active 99 DOM
-
2026-02-21$289,900 Active 910-char remark
Show marketing remark (910 chars)
Charming 2 bed home near Windham Mountain. Close to 3 additional ski hills within 35 min. Endless outdoor adverntures await. Welcome to this beautiful 2 bd 1 ba home tucked away in the small hamlet of Hensonville NY. Located minutes from local restaurants and activities. This inviting property offers the ideal blend of comfort and location. Wheather you are looking for a full time residence, weekend retreat, or an income producing getaway. .. this home delivers it all. Beatutiful property with outdoor space to relax and entertain plus a huge outdoor deck from the home to the back lawn. Close to CD Lane Park which is a hidden jewel, that offers multiple summer activities. The area also offers Hiking, biking, fishing, snowmobiling, off roading and exsploration of the beautiful Catskill Mountains. This is your chance to own a home at a reasonable price in one of the areas most desirable destinations.
ⓘ Source: listings_history table (triggers on properties + properties_extension) + one-shot
backfill from property_details.listing_events for pre-trigger history.
Climate risk First Street
- Flood 1/10 Low FEMA zone X (unshaded) · 0% chance over 30 yrs
- Wildfire 2/10 Low
- Heat 1/10 Low 6 d/yr ≥87°F today · 12 d/yr by 30 yrs out
- Wind 2/10 Low 2% chance of damaging wind over 30 yrs
- Air quality 2/10 Low 0 unhealthy d/yr today · 1 by 30 yrs out
Nearby sold comps map
Loading sold comps map…
Walkable amenities ~0.75 mi
Loading nearby amenities…
Taxation est. · year 1
- Rental income
- $27,628
- − Mortgage interest
- −$15,684
- − Property taxes
- −$4,200
- − Insurance
- −$1,400
- − Repairs & maintenance
- −$2,210
- − Management
- −$2,210
- − Depreciation
- −$8,145
- Taxable loss
- −$6,221
- Est. tax savings @ 24.0%
- +$1,493
- After-tax cash flow
- $100/yr
For passive investors: Depreciation is non-cash, so a rental often shows a tax loss while cash-flowing — sheltering income. Rental losses are passive: they offset passive income freely, and up to $25,000/yr can offset ordinary (W-2) income if you actively participate and your MAGI is under $100k (phasing out to $0 by $150k); unused losses carry forward. On sale, claimed depreciation is recaptured at up to 25%, and gains may owe capital-gains tax (a 1031 exchange can defer both). Figures are a year-1 estimate at your 24.0% rate — not tax advice; consult a CPA.
Condition & rehab AI · 13 photos
The home requires significant repairs to the roof and exterior, but the interior appears to be in good condition. Addressing these issues will significantly increase its value for resale or rental.
Repairs flagged
- Major roof — The independent image shows visible damage and potential leaks.
- Major exterior — Significant snow accumulation suggests potential water damage and lack of maintenance.
Value-add opportunities
- Resale Roof repair — A repaired roof will significantly increase the home's resale value by addressing a major issue.
- Rental Exterior cleaning and maintenance — A clean and maintained exterior will attract tenants and increase rental value.
Renovation cost estimate screening
| Repair item | Severity | Est. cost |
|---|---|---|
| roof · The independent image shows visible damage and potential leaks. | Major | $15,000–50,000 |
| exterior · Significant snow accumulation suggests potential water damage and lack of maintenance. | Major | $15,000–50,000 |
| Total estimated repair cost · 2 items | $30,000–100,000 |
Value-add ROI direction
- Resale Roof repair — A repaired roof will significantly increase the home's resale value by addressing a major issue. ↑
- Rental Exterior cleaning and maintenance — A clean and maintained exterior will attract tenants and increase rental value. ↑
ⓘ Cost ranges are severity-bucket heuristics (US national rule-of-thumb). Get contractor quotes + a written scope before underwriting a rehab budget.
Schools (NCES district)
- District
- Windham-Ashland-Jewett Central School District
- NCES district ID
- 3631590
- Math proficiency
- 55% ▲ 5.00%
- Reading proficiency
- 40% ▼ -10.00%
- Median HH income
- $46,942
- Composite
- 42.57/100
- National rank
- #6842
- State rank
- #517 of 755 in NY
Livability — Windham
- Score
- 60/100
- State rank
- #964
- US rank
- #18888
Category grades
Schools grade is shown separately in the Schools card above.
Census & demographics
- Population (ZIP)
- 1,241
Population outlook (Greene County) Hauer SSP2
- Today (2025)
- 44,963 people
- By 2030
- 43,126 · -4.1%
- By 2040
- 38,756 · -13.8%
- By 2050
- 34,913 · -22.4%
- By 2075
- 28,156 · -37.4%
- By 2100
- 22,296 · -50.4%
Race, ethnicity, and origin ACS 2023
- Neighborhood character
- Predominantly White (84%)
- Race & ethnicity
- White 84% Two or more races 5% Black 5% Hispanic / Latino 3% Asian 2%
- Common ancestry
- Romanian 5% Hispanic 4% Lithuanian 3%
- Foreign-born
- 18% · Canada
- Languages at home
- 75% English-only · Russian/Polish/Slavic 10% French/Haitian/Cajun 7% Other Indo-European 4%
Political lean MEDSL · Greene
- 2024 margin
- R (+17.0) · D 41.5% · R 58.5%
- 2008→2024 swing
- -7.1pp toward R · 2008: -9.9pp · 2024: -17.0pp
- All cycles
- 2024: R+17.0 2020: R+15.6 2016: R+27.4 2012: R+11.1 2008: R+9.9
Not yet ingested
- Civics
- —
Market trends
- HPI YoY
- ▲ 5.06%
- Current HPI
- 425.2138
- Rent YoY
- —
- Metro
- —
- State GDP YoY
- ▲ 2.60%
- F500 in state
- 92
Industry mix (Fortune 500 HQ in NY)
| Industry | F500 HQs | Revenue |
|---|---|---|
| Financial Services | 10 | $950B |
|
||
| Consumer Goods | 9 | $162B |
|
||
| Insurance | 4 | $225B |
|
||
| Telecommunications | 2 | $144B |
|
||
| Pharmaceuticals | 2 | $112B |
|
||
| Media / Entertainment | 2 | $69B |
|
||
Price history
1 event — show timeline
- 2026-02-21 Listed $289,900 HVCRMLS
Cash-flow waterfall
monthlySold comps — $/sqft
last 12 mo · ≤1 miLoading sold comps…