 🏗️ New Construction
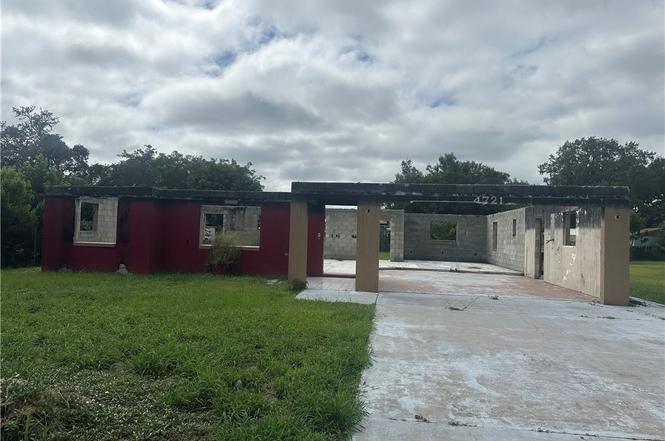
4721 Coco Palm Dr · Sebring, FL
Flood risk 1/10 · Minimal
- FEMA flood zone
- X (unshaded)
- Chance of flooding over 30 yrs
- 0.0%
- Est. flood insurance / yr
- $507 – $1,088
Fire risk 5/10 · Moderate
- Est. fire insurance / yr
- $947 – $1,759
Heat risk 9/10 · Severe
- Hot days now (above 108°F)
- 7 days/yr
- Hot days in 30 yrs
- 25 days/yr
Wind risk 10/10 · Severe
- Chance of severe wind over 30 yrs
- 99.0%
Air-quality risk 2/10 · Minimal
- Unhealthy air days now
- 1 days/yr
- Unhealthy air days in 30 yrs
- 1 days/yr
Risk factors via First Street. Map © Google.
Why this score? — see what drove the D- grade
The composite is a weighted blend of 9 inputs, each scored 0–100. Each bar is that input's sub-score; the figure is the points it added to the 100-point composite (weight × sub-score).
- Cash flow +11.9/30.0
- ARV discount +7.5/15.0
- Schools +3.6/10.0
- DSCR +3.5/10.0
- Livability +3.3/5.0
- Condition / age +2.5/5.0
- Rent growth +2.4/5.0
- 1% rule +2.2/10.0
- Appreciation +0.0/10.0
$65,000
🖨 Deal sheet 📄 Offer letter ✓ Due diligence
Listing remarks MLS
Newer style home, centrally located close to parks, lakes and commerce. This home features a split floor plan, with comfortable size living room, and kitchen, attached two car garage and rear screened in porch. Additional features include fenced in yard three bedrooms and two bathrooms.
Key facts
- Fenced in yard
- 0.26 acre lot
- Garage
Tags
Property features AI
Exterior
- Parking: Assigned parking; Detached parking
- Utilities: Public water; Sewer not available; No sewer (other)
- Home design: Residential single-family home; Under construction; Zoned R1; 75 ft frontage; Paved road access
- Construction: Construction materials: see remarks
- Exterior features: No patio or porch; No pool
Interior
- Flooring: Other
- Bathrooms: 2 full bathrooms
- Heating & cooling: No heating
- Interior features: Under construction; Other flooring; Total of 2 rooms
Neighborhood map
What this means for you Summary
Snapshot
- This is a 3-bed/2.0-bath single-family listed at $65k.
Deal economics
- At list price, monthly cash flow is $-54 ($-648/yr) — negative.
- The deal already cash-flows at list — no discount required.
- Meets the 1% rule at list price ($2k rent vs $65k).
- Recommended offer: $57k (12.0% below list) — sets the bar for market timing.
- Cap rate 6.0% vs local median 4.3% in Sebring — top-decile yield for the area; either an underpriced asset or a hidden risk that comps aren't pricing in. Stress-test before assuming the spread holds.
Location & tenants
- Location reads 66/100 on livability (#618 in FL) — a middle-class / working-renter tenant base. Strengths: cost of living A+, housing A+, health & safety A; Watch: schools D, amenities F, commute F.
- Highlands (other): math 45% / reading 43% proficiency, ranked #54 of 73 in FL (top 74%) — families likely to look elsewhere, expect single-tenant / working-renter base with shorter leases; 68% free/reduced lunch — lower-income household profile, screen leases tightly.
- Market conditions: Rents soft (-0.3%/yr); 475 active listings in the ZIP; 1 comparable units currently listed for rent nearby; 980 units permitted in Highlands County in 2024 (80 in 5+ unit buildings).
- This rent runs 37% of the median local income ($50k/yr) — at the standard rent-burdened threshold; future hikes will face affordability resistance.
Forward outlook
- Local home prices are declining (-3.0%/yr); year-one equity from $1k of loan paydown is wiped out by about $6k of value loss. Plan a longer hold.
Negotiation context
- It's been on market 262 days — a 12% lower offer ($57k) is reasonable based on typical stale-listing flexibility.
- 3 sale attempts since 8y ago; this cycle's ask has dropped $34k (35%) from the opening price — seller is motivated, your offer sets the floor, not the list.
Risks & watch-outs
- Climate carrying-cost: severe wind risk, 99% chance of damaging wind over 30y; moderate wildfire risk; extreme-heat days projected 7→25/yr by 2055 (HVAC capex compounding) — expect insurance premiums to compound above CPI over the hold.
Questions for the listing agent
- What do current leases actually rent for vs. the listed asking? Can we see a recent rent roll and the last 12 months of T-12 income?
- It's been on market 262 days. Have you received any prior offers? Is the seller open to a 12% concession, seller financing, or rate buy-down credit?
- Why hasn't it sold? Are there any deal-killer items the seller is aware of (foundation, flood, title, zoning, code violations)?
- Is there a deadline driving the sale (1031 exchange, divorce, estate, relocation)? That informs how much negotiation room exists.
- Schools are D-rated, which usually means shorter tenancies and higher turnover. Who's the typical renter profile here, and what's been the actual vacancy rate?
- The area grade is low — what's the realistic commute time and amenity access for the typical tenant pool here? Any planned neighborhood developments (good or bad) we should know about?
- What's the average days-on-market for RENTAL listings here right now (not sales)? A rising rental-DOM trend means longer vacancies and softer asking-rent achievability than the comps imply.
- What's the recent tenant-quality profile in this submarket — average credit score on applications, eviction rate, late-payment / NSF rate, and stable-employment percentage? A property-management company in the area should have these aggregated.
- How much new for-sale + rental construction is in the pipeline within 1–3 miles? Heavy new supply typically softens prices + rents 12–24 months out; constrained supply supports both.
Investment metrics
- 1% rule
- 0.72% ✗
- Cap rate
- 5.99%
- Cash-on-cash
- -1.08%
- DSCR
- 0.95
- GRM
- 11.5
CMA / ARV
- ARV (on-the-fly)
- $213,486
- Comps found
- 12
Show comp detail 12 sales within ~0.75 mi
| Address | Dist | Beds/Ba | Sqft | Sold | Price | $/sf | Match |
|---|---|---|---|---|---|---|---|
| 2003 Roseland Ave | 0.56mi | 3/2.0 | 1,344 (+1%) | 8mo | $170,000 | $126 | 65 |
| 1301 Ebro Ct | 0.63mi | 3/2.0 | 1,266 (-4%) | 5mo | $205,000 | $162 | 59 |
| 1480 Las Villas Blvd | 0.70mi | 3/2.0 | 1,330 (+0%) | 12mo | $219,000 | $165 | 57 |
| 1514 Las Villas Blvd | 0.57mi | 3/2.0 | 1,330 (+0%) | 21mo | $219,000 | $165 | 56 |
| 1478 Las Villas Blvd | 0.71mi | 3/2.0 | 1,330 (+0%) | 14mo | $219,000 | $165 | 55 |
| 1476 Las Villas Blvd | 0.71mi | 3/2.0 | 1,330 (+0%) | 14mo | $219,000 | $165 | 54 |
| 1518 Las Villas Blvd | 0.56mi | 3/2.0 | 1,200 (-10%) | 10mo | $180,000 | $150 | 50 |
| 1494 Las Villas Blvd | 0.63mi | 3/2.0 | 1,300 (-2%) | 21mo | $209,000 | $161 | 50 |
| 1729 Warfield Pl | 0.69mi | 2/2.0 (-1) | 1,440 (+9%) | 4mo | $155,000 | $108 | 45 |
| 1916 Melady Ave | 0.74mi | 3/2.0 | 1,200 (-10%) | 10mo | $180,000 | $150 | 42 |
| 1470 Las Villas Blvd | 0.73mi | 3/2.0 | 1,205 (-9%) | 16mo | $189,000 | $157 | 37 |
| 1816 Steiner Ave | 0.69mi | 2/1.5 (-1) | 1,134 (-14%) | 10mo | $130,000 | $115 | 29 |
Match score weights: distance 35% · size 25% · config 20% · recency 20%. Top-matched comps best support the ARV.
Projected returns pro-forma
-3.0% appreciation · 0.0% rent growth · sell at horizon
- IRR
- -21.1%
- Equity multiple
- 0.29×
- Total profit
- $-42,665
- Equity at exit
- $31,831
- IRR
- -22.0%
- Equity multiple
- 0.00×
- Total profit
- $-59,500
- Equity at exit
- $18,458
Cash invested: $59,776 (down + closing). Projections, not guarantees.
Landlord ↔ Tenant lean methodology
- Overall (STATE)
- 87 Strongly Landlord-Friendly
- State Florida
- 87 Strongly Landlord-Friendly · R+3
- County
- — inherits STATE
- City
- — inherits STATE
ZIP-level market 33870
- Home prices YoY
- -20.0%
- Rents YoY
- -0.3%
- Active inventory
- 475
- Price-to-rent
- 3.5×
Monthly cashflow live
- Estimated rent
- $1,547 medium interval (Pro) →
- Mortgage (P&I)
- −$1,120
- Tax from tax record
- −$67 /mo · $808/yr
- Insurance
- −$89
- HOA
- −$0
- Vacancy / Maint / Mgmt
- −$325
- Net cashflow
- $-54
Break-even live
UW: 25.0% down · 7.5% · 30yr · 1.5% tax · 5.0% vac · 8.0% maint · 8.0% mgmt
Financing live
Cash to close
- Down payment
- $53,372
- Closing costs
- $6,405
- Reserves months
- —
- Total cash needed
- —
Loan-product check · same deal, 3 products live
Conventional
25% down · 7.5% · 30yr
- Down + closing
- —
- Monthly P&I
- —
- Monthly cashflow
- —
- DSCR
- —
- Eligible?
- —
Personal DTI + credit; lowest rate.
DSCR
20% down · 8.5% · 30yr
- Down + closing
- —
- Monthly P&I
- —
- Monthly cashflow
- —
- DSCR
- —
- Eligible?
- —
No personal income docs; deal must DSCR.
Hard money
10% down · 12.0% · 12mo
- Down + closing
- —
- Monthly P&I
- —
- Monthly cashflow
- —
- DSCR
- —
- Eligible?
- —
Short-term bridge; refi at stabilization.
Rent comps 1 comps
| Address | Beds | Baths | Sqft | Rent | $/sqft | DOM | Units | Dist |
|---|---|---|---|---|---|---|---|---|
| 8761 Watersound Cir Sebring, FL | 2.0–3.0 | 2.0 | 1090 | $1,600 | $1.47 | 21d | 1 | 1.40mi |
Listing history 21 events
-
2026-06-19pricedays on market $65,000 Active 262 DOM
-
2026-06-18days on market $85,000 Active 261 DOM
-
2026-06-17days on market $85,000 Active 260 DOM
-
2026-06-16days on market $85,000 Active 259 DOM
-
2026-06-15days on market $85,000 Active 258 DOM
-
2026-06-14days on market $85,000 Active 256 DOM
-
2026-06-10days on market $85,000 Active 253 DOM
-
2026-06-09days on market $85,000 Active 252 DOM
-
2026-06-08days on market $85,000 Active 251 DOM
-
2026-06-07days on market $85,000 Active 250 DOM
-
2026-06-02days on market $85,000 Active 245 DOM
-
2026-06-01days on market $85,000 Active 244 DOM
-
2026-05-31days on market $85,000 Active 243 DOM
-
2026-05-30days on market $85,000 Active 242 DOM
-
2026-01-16price $85,000
-
2025-09-30$99,500 Active
-
2025-01-08soldstatus $60,000
-
2025-01-07historical
-
2024-12-07$65,000 Active
-
2018-06-15soldstatus $100,000 287-char remark
Show marketing remark (287 chars)
Newer style home, centrally located close to parks, lakes and commerce. This home features a split floor plan, with comfortable size living room, and kitchen, attached two car garage and rear screened in porch. Additional features include fenced in yard three bedrooms and two bathrooms.
-
2018-05-04$100,000 287-char remark
Show marketing remark (287 chars)
Newer style home, centrally located close to parks, lakes and commerce. This home features a split floor plan, with comfortable size living room, and kitchen, attached two car garage and rear screened in porch. Additional features include fenced in yard three bedrooms and two bathrooms.
ⓘ Source: listings_history table (triggers on properties + properties_extension) + one-shot
backfill from property_details.listing_events for pre-trigger history.
Tax reassessment forecast FL · Resets to sale price
- Current annual tax
- $808 · $67/mo
- Projected year-2 tax
- $808 · $67/mo
- Expected delta
- $0/yr ($0/mo · 0.0%)
ⓘ Screening estimate from a state-policy table — verify with the county assessor before closing.
Climate risk First Street
- Flood 1/10 Low FEMA zone X (unshaded) · 0% chance over 30 yrs
- Wildfire 5/10 Major
- Heat 9/10 Extreme 7 d/yr ≥108°F today · 25 d/yr by 30 yrs out
- Wind 10/10 Extreme 99% chance of damaging wind over 30 yrs
- Air quality 2/10 Low 1 unhealthy d/yr today · 1 by 30 yrs out
Nearby sold comps map
Loading sold comps map…
Walkable amenities ~0.75 mi
Loading nearby amenities…
Taxation est. · year 1
- Rental income
- $18,560
- − Mortgage interest
- −$11,959
- − Property taxes
- −$808
- − Insurance
- −$1,067
- − Repairs & maintenance
- −$1,485
- − Management
- −$1,485
- − Depreciation
- −$6,211
- Taxable loss
- −$4,454
- Est. tax savings @ 24.0%
- +$1,069
- After-tax cash flow
- $421/yr
For passive investors: Depreciation is non-cash, so a rental often shows a tax loss while cash-flowing — sheltering income. Rental losses are passive: they offset passive income freely, and up to $25,000/yr can offset ordinary (W-2) income if you actively participate and your MAGI is under $100k (phasing out to $0 by $150k); unused losses carry forward. On sale, claimed depreciation is recaptured at up to 25%, and gains may owe capital-gains tax (a 1031 exchange can defer both). Figures are a year-1 estimate at your 24.0% rate — not tax advice; consult a CPA.
Schools (NCES district)
- District
- Highlands
- NCES district ID
- 1200840
- Math proficiency
- 45% ▼ -7.00%
- Reading proficiency
- 43% ▼ -3.00%
- Median HH income
- $35,276
- Composite
- 36.42/100
- National rank
- #4672
- State rank
- #54 of 73 in FL
Livability — Sebring
- Score
- 66/100
- State rank
- #618
- US rank
- #11992
Category grades
Schools grade is shown separately in the Schools card above.
Census & demographics
- County
- Highlands County · 98,898 people
- City population
- 50,797
- Metro
- Sebring-Avon Park, FL
- Population (ZIP)
- 25,195
- Household income
- $49,942
- Rent vs Own
- Severe rent burden
- 994.0
Population outlook (Highlands County) Hauer SSP2
- Today (2025)
- 99,674 people
- By 2030
- 99,615 · -0.1%
- By 2040
- 99,342 · -0.3%
- By 2050
- 98,242 · -1.4%
- By 2075
- 93,291 · -6.4%
- By 2100
- 79,894 · -19.8%
Race, ethnicity, and origin ACS 2023
- Neighborhood character
- Diverse neighborhood (Simpson 0.57)
- Race & ethnicity
- White 60% Hispanic / Latino 22% Black 13% Two or more races 10% Asian 1%
- Hispanic origin (detail)
- Mexican 8% Puerto Rican 7% Cuban 5%
- Common ancestry
- Slovak 2% Romanian 1% Lithuanian 1%
- Foreign-born
- 10% · Canada, Jamaica, China
- Languages at home
- 80% English-only · Spanish 16% Other Indo-European 1% French/Haitian/Cajun 1%
Political lean MEDSL · Highlands
- 2024 margin
- Solid R (+40.8) · D 29.3% · R 70.1%
- 2008→2024 swing
- -22.7pp toward R · 2008: -18.1pp · 2024: -40.8pp
- All cycles
- 2024: R+40.8 2020: R+34.4 2016: R+32.0 2012: R+23.0 2008: R+18.1
Not yet ingested
- Civics
- —
Market trends
- HPI YoY
- ▼ -68.68%
- Current HPI
- 273.9861
- Rent YoY
- ▼ -0.29%
- Metro
- Sebring-Avon Park, FL
- State GDP YoY
- ▲ 3.28%
- F500 in state
- 36
Industry mix (Fortune 500 HQ in FL)
| Industry | F500 HQs | Revenue |
|---|---|---|
| Industrial Technology | 2 | $29B |
|
||
| Insurance | 2 | $17B |
|
||
| Retail | 1 | $60B |
|
||
| Technology Distribution | 1 | $58B |
|
||
| Homebuilding | 1 | $35B |
|
||
| Technology Manufacturing | 1 | $35B |
|
||
Price history
-15.0% since first listed7 events — show timeline
- 2026-01-16 Price Changed $85,000 HAOR as distributed by MLS GRID
- 2025-09-30 Listed $99,500 HAOR as distributed by MLS GRID
- 2025-01-08 Sold (Public Records) $60,000 Public Records
- 2025-01-07 Listing Removed — Stellar MLS as Distributed by MLS Grid
- 2024-12-07 Listed $65,000 Stellar MLS as Distributed by MLS Grid
- 2018-06-15 Sold (MLS) $100,000 HAOR as distributed by MLS GRID
- 2018-05-04 Listed $100,000 HAOR as distributed by MLS GRID
Property tax history
+4.9%/yrLatest (2025): $808 · +124.2% YoY. Source: county tax records.
Cash-flow waterfall
monthlySold comps — $/sqft
last 12 mo · ≤1 miLoading sold comps…