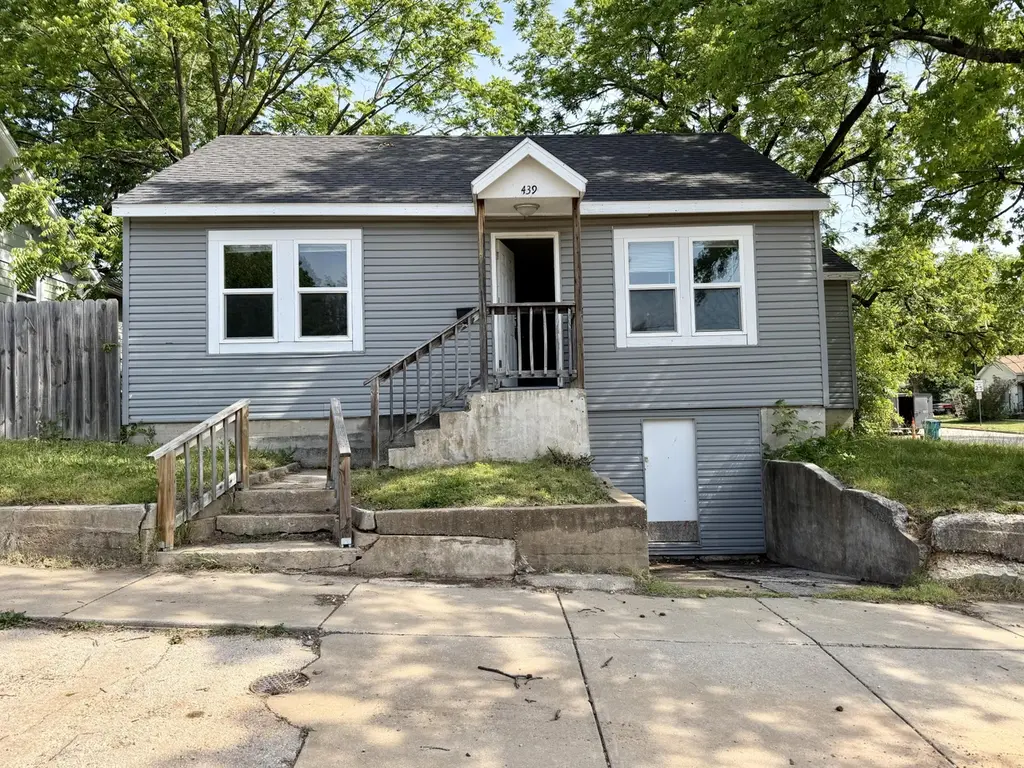
439 E High St · Springfield, MO
Flood risk 1/10 · Minimal
- FEMA flood zone
- X (unshaded)
- Chance of flooding over 30 yrs
- 0.0%
- Est. flood insurance / yr
- $473 – $860
Fire risk 1/10 · Minimal
- Est. fire insurance / yr
- $1,054 – $1,958
Heat risk 5/10 · Moderate
- Hot days now (above 105°F)
- 7 days/yr
- Hot days in 30 yrs
- 18 days/yr
Wind risk 2/10 · Minimal
- Chance of severe wind over 30 yrs
- 0.0%
Air-quality risk 2/10 · Minimal
- Unhealthy air days now
- 1 days/yr
- Unhealthy air days in 30 yrs
- 2 days/yr
Risk factors via First Street. Map © Google.
Why this score? — see what drove the D grade
The composite is a weighted blend of 9 inputs, each scored 0–100. Each bar is that input's sub-score; the figure is the points it added to the 100-point composite (weight × sub-score).
- Cash flow +14.3/30.0
- ARV discount +8.5/15.0
- DSCR +4.3/10.0
- Livability +3.8/5.0
- Rent growth +3.6/5.0
- Schools +3.2/10.0
- 1% rule +2.8/10.0
- Condition / age +2.5/5.0
- Appreciation +0.0/10.0
$125,000
🖨 Deal sheet (PDF) 📄 Offer letter ✓ Due diligence
Listing remarks
Charming, updated, and full of curb appeal, home is the perfect opportunity for first-time buyers or savvy investors alike! From the moment you arrive, you'll appreciate the inviting exterior, fresh updates, and welcoming feel throughout. Whether you're looking for a wonderful place to call home or a solid rental investment, this property offers affordability, charm, and endless potential in one package.
Key facts
- 4,792 sq ft lot
- Built 1932
- Listed 38 days
Property features AI
Finance
- Other: $466.83 annual tax amount
- Financial info: No investor or income/expense details provided
- HOA & community: No HOA details provided
Exterior
- Parking: No parking details provided
- Security: No security details provided
- Utilities: Public water; Public sewer
- Home design: Single-family residence; Residential property; One story
- Construction: Built area 785 (above grade); Lot about 0.11 acre
- Exterior features: Lot in Ozark Land Co subdivision
Interior
- Kitchen: No kitchen appliance details provided
- Bedrooms: Not specified
- Flooring: No flooring details provided
- Bathrooms: 1 full bathroom
- Heating & cooling: No heating; No cooling
- Interior features: One-level layout
- Laundry & utility: No laundry details provided
Neighborhood map
What this means for you Summary
Snapshot
- This is a 2-bed/1.0-bath single-family listed at $125k.
Deal economics
- At list price, monthly cash flow is $22 ($270/yr) — positive.
- The deal already cash-flows at list — no discount required.
- To meet the 1% rule (rent ≥ 1% of price), the offer needs to be $97k (22.1% below list).
- Recommended offer: $97k (22.1% below list) — sets the bar for 1% rule.
- Cap rate 6.5% vs local median 4.6% in Springfield — top-decile yield for the area; either an underpriced asset or a hidden risk that comps aren't pricing in. Stress-test before assuming the spread holds.
Location & tenants
- Location reads 75/100 on livability (#57 in MO, #4,121 nationally) — a middle-class / working-renter tenant base. Strengths: commute A+, cost of living A+, housing A+; Watch: crime F, employment F.
- Springfield R-XII (urban): math 32% / reading 46% proficiency, ranked #174 of 324 in MO (top 54%) — families likely to look elsewhere, expect single-tenant / working-renter base with shorter leases.
- Zoned schools: Bowerman Elem. (math 17% / reading 27%, grade F, #910 of 1,115 statewide, top 83%, 243 students, 90% FRL); Reed Middle (math 33% / reading 44%, grade F, #202 of 391 statewide, top 54%, 512 students, 70% FRL); Hillcrest High (math 9% / reading 35%, grade F, #462 of 521 statewide, top 90%, 1,017 students, 64% FRL) — zoned schools average 74% FRL vs 46% district-wide (28 pts higher); higher-poverty schools than district average — tighter screening recommended.
- Market conditions: Rents rising fast (+4.2%/yr); 401 active listings in the ZIP; 34 comparable units currently listed for rent nearby; rentals at typical pace (median 25d on market — plan ~3-4 weeks tenant-placement turnaround); 41% of comp listings sitting > 30 days — soft ceiling on asking rent; 1,302 units permitted in Greene County in 2024 (250 in 5+ unit buildings).
Forward outlook
- Local home prices are declining (-3.0%/yr); year-one equity from $864 of loan paydown is wiped out by about $4k of value loss. Plan a longer hold.
- Greene County population projected at +25% by 2050 — long-run rental-demand tailwind backs the buy-and-hold thesis.
Negotiation context
- It's been on market 38 days — a 3% lower offer ($121k) is reasonable based on typical stale-listing flexibility.
- 4 sale attempts since 18y ago with the ask held roughly flat each time — persistent listings suggest the price (not the market) is what's stuck; bring a comps-based counter.
Risks & watch-outs
- Watch-outs: built in 1932 — expect roof / HVAC / electrical / plumbing capex.
- Climate carrying-cost: extreme-heat days projected 7→18/yr by 2055 (HVAC capex compounding) — expect insurance premiums to compound above CPI over the hold.
Questions for the listing agent
- It's been on market 38 days. Have you received any prior offers? Is the seller open to a 22% concession, seller financing, or rate buy-down credit?
- Built in 1932 — when were the roof, HVAC, electrical panel, plumbing, and water heater last replaced?
- Is there a deadline driving the sale (1031 exchange, divorce, estate, relocation)? That informs how much negotiation room exists.
- Crime grade is F in this area — have there been break-ins, vandalism, or insurance claims at this property in the last 3 years? What carrier currently insures it and at what premium?
- The area grade is low — what's the realistic commute time and amenity access for the typical tenant pool here? Any planned neighborhood developments (good or bad) we should know about?
- What's the average days-on-market for RENTAL listings here right now (not sales)? A rising rental-DOM trend means longer vacancies and softer asking-rent achievability than the comps imply.
- What's the recent tenant-quality profile in this submarket — average credit score on applications, eviction rate, late-payment / NSF rate, and stable-employment percentage? A property-management company in the area should have these aggregated.
- How much new for-sale + rental construction is in the pipeline within 1–3 miles? Heavy new supply typically softens prices + rents 12–24 months out; constrained supply supports both.
Investment metrics
- 1% rule
- 0.78% ✗
- Cap rate
- 6.51%
- Cash-on-cash
- 0.77%
- DSCR
- 1.03
- GRM
- 10.7
CMA / ARV
- ARV (median comp)
- $127,793
- List price
- $125,000
- Delta
- -2.19%
- Verdict
- FAIR
- Comps
- 20 within 1.0 mi
Show comp detail 12 sales within ~0.75 mi
| Address | Dist | Beds/Ba | Sqft | Sold | Price | $/sf | Match |
|---|---|---|---|---|---|---|---|
| 2138 N Boonville Ave | 0.24mi | 2/1.0 | 864 (+10%) | 4mo | $90,000 | $104 | 69 |
| 2214 N Kellett Ave | 0.37mi | 2/1.0 | 840 (+7%) | 3mo | $149,900 | $178 | 69 |
| 2342 N Lyon Ave | 0.42mi | 2/1.0 | 850 (+8%) | 3mo | $143,900 | $169 | 64 |
| 2212 N Kellett Ave | 0.37mi | 2/2.0 | 720 (-8%) | 6mo | $124,900 | $173 | 60 |
| 800 W Della St | 0.72mi | 2/1.0 | 808 (+3%) | 2mo | $114,900 | $142 | 60 |
| 2447 N Kellett Ave | 0.49mi | 2/1.0 | 720 (-8%) | 8mo | $99,900 | $139 | 57 |
| 2214 N Concord Ave | 0.52mi | 2/1.0 | 864 (+10%) | 3mo | $89,500 | $104 | 56 |
| 2251 N Main Ave | 0.47mi | 2/1.0 | 865 (+10%) | 7mo | $140,000 | $162 | 56 |
| 2340 N Kellett Ave | 0.42mi | 1/1.0 (-1) | 700 (-11%) | 2mo | $115,000 | $164 | 56 |
| 509 W High St | 0.41mi | 2/2.0 | 891 (+14%) | 4mo | $170,000 | $191 | 52 |
| 2310 N East Ave | 0.47mi | 2/1.0 | 896 (+14%) | 7mo | $69,900 | $78 | 48 |
| 2543 N Campbell Ave | 0.56mi | 1/1.0 (-1) | 680 (-13%) | 8mo | $50,000 | $74 | 40 |
Match score weights: distance 35% · size 25% · config 20% · recency 20%. Top-matched comps best support the ARV.
Projected returns pro-forma
-3.0% appreciation · 4.24% rent growth · sell at horizon
- IRR
- -13.9%
- Equity multiple
- 0.50×
- Total profit
- $-17,652
- Equity at exit
- $18,638
- IRR
- -3.5%
- Equity multiple
- 0.75×
- Total profit
- $-8,587
- Equity at exit
- $10,808
Cash invested: $35,000 (down + closing). Projections, not guarantees.
Landlord ↔ Tenant lean methodology
- Overall (STATE)
- 81 Strongly Landlord-Friendly
- State Missouri
- 81 Strongly Landlord-Friendly · R+10
- County
- — inherits STATE
- City
- — inherits STATE
ZIP-level market 65803
- Home prices YoY
- -29.8%
- Rents YoY
- 4.2%
- Active inventory
- 401
- Price-to-rent
- 10.7×
Monthly cashflow live
- Estimated rent
- $973 high interval (Pro) →
- Mortgage (P&I)
- −$656
- Tax from tax record
- −$39 /mo · $467/yr
- Insurance
- −$52
- HOA
- −$0
- Vacancy / Maint / Mgmt
- −$204
- Net cashflow
- $22
Break-even live
Sensitivity live
| Price | -10% $93 | -5% $58 | +0% $22 | +5% $-13 | +10% $-48 |
|---|---|---|---|---|---|
| Rent | -10% $-54 | -5% $-16 | +0% $22 | +5% $61 | +10% $99 |
| Rate | -1.0pp $85 | -0.5pp $54 | base $22 | +0.5pp $-10 | +1.0pp $-43 |
UW: 25.0% down · 7.5% · 30yr · 1.5% tax · 5.0% vac · 8.0% maint · 8.0% mgmt
Financing live
Cash to close
- Down payment
- $31,250
- Closing costs
- $3,750
- Reserves months
- —
- Total cash needed
- —
Loan-product check · same deal, 3 products live
Conventional
25% down · 7.5% · 30yr
- Down + closing
- —
- Monthly P&I
- —
- Monthly cashflow
- —
- DSCR
- —
- Eligible?
- —
Personal DTI + credit; lowest rate.
DSCR
20% down · 8.5% · 30yr
- Down + closing
- —
- Monthly P&I
- —
- Monthly cashflow
- —
- DSCR
- —
- Eligible?
- —
No personal income docs; deal must DSCR.
Hard money
10% down · 12.0% · 12mo
- Down + closing
- —
- Monthly P&I
- —
- Monthly cashflow
- —
- DSCR
- —
- Eligible?
- —
Short-term bridge; refi at stabilization.
Rent comps 34 comps
| Address | Beds | Baths | Sqft | Rent | $/sqft | DOM | Units | Dist |
|---|---|---|---|---|---|---|---|---|
| 407 E Dale St Apt B Springfield, MO | 2.0 | 1.0 | 720 | $795 | $1.10 | 15d | 1 | 0.14mi |
| 2034 N Washington Ave Springfield, MO | 2.0 | 1.0 | 800 | $875 | $1.09 | 45d | 1 | 0.21mi |
| 805 E Garfield St Springfield, MO | 2.0 | 1.0 | 950 | $950 | $1.00 | 15d | 1 | 0.33mi |
| 2230 N Campbell Ave Springfield, MO | 2.0 | 1.0 | 1084 | $1,095 | $1.01 | 45d | 1 | 0.33mi |
| 317 E Chase St Springfield, MO | 2.0 | 2.0 | 915 | $1,100 | $1.20 | 45d | 1 | 0.41mi |
| 2346 N Kellett Ave Apt B Springfield, MO | 1.0 | 1.0 | 550 | $825 | $1.50 | 45d | 1 | 0.41mi |
| 2234 N Travis Ave Springfield, MO | 1.0 | 1.0 | 890 | $750 | $0.84 | 45d | 1 | 0.50mi |
| 203 W Commercial St Unit 2F Springfield, MO | 2.0 | 1.0 | 1000 | $1,150 | $1.15 | 23d | 1 | 0.58mi |
| 1623 N Jefferson Ave Unit B Springfield, MO | 1.0 | 1.0 | 750 | $950 | $1.27 | 45d | 1 | 0.63mi |
| 1530 N Robberson Ave Springfield, MO | 3.0 | 2.0 | 1122 | $1,425 | $1.27 | 45d | 1 | 0.71mi |
| 716 E Locust St Unit A Springfield, MO | 2.0 | 1.0 | 915 | $850 | $0.93 | 25d | 1 | 0.71mi |
| 2337 N Ramsey Ave Springfield, MO | 2.0 | 1.0 | 882 | $875 | $0.99 | 15d | 1 | 0.75mi |
| 2345 N Prospect Ave Springfield, MO | 2.0 | 1.0 | 792 | $850 | $1.07 | 15d | 1 | 0.82mi |
| 2313 N Rogers Ave Unit 1 Springfield, MO | 2.0 | 2.0 | 882 | $950 | $1.08 | 15d | 1 | 0.87mi |
| 2054 N Rogers Ave Springfield, MO | 2.0 | 1.0 | 888 | $925 | $1.04 | 15d | 1 | 0.89mi |
| 1409 N Washington Ave Springfield, MO | 2.0 | 1.0 | 839 | $1,405 | $1.67 | 15d | 2 | 0.89mi |
| 1636 N National Ave Springfield, MO | 3.0 | 1.5 | 1000 | $995 | $0.99 | 45d | 1 | 0.89mi |
| 1112 E Locust St Springfield, MO | 2.0 | 1.0 | 840 | $945 | $1.12 | 25d | 1 | 0.90mi |
| 2850 N Campbell Ave Apt S Springfield, MO | 1.0 | 1.0 | 727 | $750 | $1.03 | 45d | 1 | 0.90mi |
| 603 W Division St Springfield, MO | 2.0 | 1.0 | 816 | $995 | $1.22 | 15d | 1 | 0.91mi |
| 2120 N Johnston Ave Springfield, MO | 2.0 | 1.0 | 880 | $925 | $1.05 | 45d | 1 | 0.99mi |
| 1447 E Oakwood Ln Springfield, MO | 2.0 | 2.0 | 982 | $1,395 | $1.42 | 45d | 1 | 1.03mi |
| 2940 N East Ave Springfield, MO | 2.0 | 2.0 | 915 | $700 | $0.77 | 15d | 1 | 1.07mi |
| 1306 N Frisco Ave Apt A Springfield, MO | 2.0 | 1.5–2.0 | 970 | $995 | $1.03 | 15d | 19 | 1.11mi |
| 2337 N Delaware Ave Springfield, MO | 2.0 | 1.0 | 876 | $1,195 | $1.36 | 45d | 1 | 1.14mi |
| 1501 E Blaine St Springfield, MO | 2.0 | 1.0 | 958 | $695 | $0.73 | 25d | 1 | 1.18mi |
| 1034 E McCanse St Springfield, MO | 3.0 | 1.0 | 910 | $1,150 | $1.26 | 25d | 1 | 1.23mi |
| 1529 N Weller Ave Springfield, MO | 2.0 | 1.0 | 870 | $995 | $1.14 | 25d | 1 | 1.25mi |
| 1246 E Norton Rd Springfield, MO | 1.0 | 1.0 | 650 | $595 | $0.92 | 45d | 1 | 1.25mi |
| 3000 N Kentwood Ave Springfield, MO | 1.0 | 1.0 | 650 | $650 | $1.00 | 15d | 1 | 1.41mi |
| 1710 E Commercial St Unit B Springfield, MO | 2.0 | 1.0 | 950 | $775 | $0.82 | 45d | 1 | 1.42mi |
| 1126 W Hamilton St Springfield, MO | 2.0 | 1.0 | 648 | $895 | $1.38 | 25d | 1 | 1.43mi |
| 647 W Central St Springfield, MO | 3.0 | 1.0 | 882 | $1,050 | $1.19 | 25d | 1 | 1.47mi |
| 2126 N Lexington Ave Springfield, MO | 2.0 | 1.0 | 990 | $895 | $0.90 | 15d | 1 | 1.48mi |
Listing history 21 events
-
2026-06-22days on market $125,000 Active 38 DOM
-
2026-06-18days on market $125,000 Active 35 DOM
-
2026-06-17days on market $125,000 Active 34 DOM
-
2026-06-16days on market $125,000 Active 33 DOM
-
2026-06-15days on market $125,000 Active 32 DOM
-
2026-06-14days on market $125,000 Active 30 DOM
-
2026-06-10days on market $125,000 Active 27 DOM
-
2026-06-09days on market $125,000 Active 26 DOM
-
2026-06-08days on market $125,000 Active 25 DOM
-
2026-06-07days on market $125,000 Active 24 DOM
-
2026-06-03days on market $125,000 Active 20 DOM
-
2026-06-02days on market $125,000 Active 19 DOM
-
2026-06-01days on market $125,000 Active 18 DOM
-
2026-05-31days on market $125,000 Active 17 DOM
-
2026-05-30days on market $125,000 Active 16 DOM
-
2026-05-14$125,000 Active 407-char remark
-
2025-01-25historical $995
-
2024-12-14$995
-
2017-07-08$24,500
-
2008-08-28$31,000
-
2003-09-15soldstatus
ⓘ Source: listings_history table (triggers on properties + properties_extension) + one-shot
backfill from property_details.listing_events for pre-trigger history.
Tax reassessment forecast MO · Resets to sale price
- Current annual tax
- $467 · $39/mo
- Projected year-2 tax
- $1,212 · $101/mo
- Expected delta
- +$746/yr (+$62/mo · 159.7%)
ⓘ Screening estimate from a state-policy table — verify with the county assessor before closing.
Climate risk First Street
- Flood 1/10 Low FEMA zone X (unshaded) · 0% chance over 30 yrs
- Wildfire 1/10 Low
- Heat 5/10 Major 7 d/yr ≥105°F today · 18 d/yr by 30 yrs out
- Wind 2/10 Low 0% chance of damaging wind over 30 yrs
- Air quality 2/10 Low 1 unhealthy d/yr today · 2 by 30 yrs out
Nearby sold comps map
Loading sold comps map…
Walkable amenities ~0.75 mi
Loading nearby amenities…
Taxation est. · year 1
- Rental income
- $11,681
- − Mortgage interest
- −$7,002
- − Property taxes
- −$467
- − Insurance
- −$625
- − Repairs & maintenance
- −$934
- − Management
- −$934
- − Depreciation
- −$3,636
- Taxable loss
- −$1,918
- Est. tax savings @ 24.0%
- +$460
- After-tax cash flow
- $730/yr
For passive investors: Depreciation is non-cash, so a rental often shows a tax loss while cash-flowing — sheltering income. Rental losses are passive: they offset passive income freely, and up to $25,000/yr can offset ordinary (W-2) income if you actively participate and your MAGI is under $100k (phasing out to $0 by $150k); unused losses carry forward. On sale, claimed depreciation is recaptured at up to 25%, and gains may owe capital-gains tax (a 1031 exchange can defer both). Figures are a year-1 estimate at your 24.0% rate — not tax advice; consult a CPA.
Schools (NCES district)
- District
- Springfield R-XII
- NCES district ID
- 2928860
- Math proficiency
- 32% ▼ -2.00%
- Reading proficiency
- 46% ▼ -3.00%
- Median HH income
- $37,886
- Composite
- 32.45/100
- National rank
- #5717
- State rank
- #174 of 324 in MO
Livability — Springfield
- Score
- 75/100
- State rank
- #57
- US rank
- #4121
Category grades
Schools grade is shown separately in the Schools card above.
Census & demographics
- Census place
- Springfield, MO
- County
- Greene County · 244,327 people
- City population
- 223,044
- Metro
- Springfield, MO
- Population (ZIP)
- 42,882
- Household income
- $50,572
- Rent vs Own
- Severe rent burden
- 1305.0
Population outlook (Greene County) Hauer SSP2
- Today (2025)
- 319,054 people
- By 2030
- 335,135 · +5.0%
- By 2040
- 366,186 · +14.8%
- By 2050
- 397,431 · +24.6%
- By 2075
- 477,035 · +49.5%
- By 2100
- 520,828 · +63.2%
Race, ethnicity, and origin ACS 2023
- Neighborhood character
- Predominantly White (82%)
- Race & ethnicity
- White 82% Two or more races 9% Hispanic / Latino 6% Black 4%
- Hispanic origin (detail)
- Mexican 2% Puerto Rican 2%
- Common ancestry
- Lithuanian 2% Italian 2% Iranian 2%
- Foreign-born
- 3% · Canada
- Languages at home
- 95% English-only · Spanish 3%
Political lean MEDSL · Greene
- 2024 margin
- Strong R (+20.8) · D 38.9% · R 59.7% · Other 1.4%
- 2008→2024 swing
- -5.0pp toward R · 2008: -15.8pp · 2024: -20.8pp
- All cycles
- 2024: R+20.8 2020: R+20.1 2016: R+27.4 2012: R+24.4 2008: R+15.8
Not yet ingested
- Civics
- —
Market trends
- HPI YoY
- ▼ -87.08%
- Current HPI
- 205.0439
- Rent YoY
- ▲ 4.24%
- Metro
- Springfield, MO
- State GDP YoY
- ▲ 1.84%
- F500 in state
- 20
Industry mix (Fortune 500 HQ in MO)
| Industry | F500 HQs | Revenue |
|---|---|---|
| Healthcare | 1 | $163B |
|
||
| Insurance | 1 | $21B |
|
||
| Industrial Technology | 1 | $17B |
|
||
| Retail | 1 | $16B |
|
||
| Industrial Distribution | 1 | $10B |
|
||
| Utilities | 1 | $9B |
|
||
Price history
+303.2% since first listed6 events — show timeline
- 2026-05-14 Listed $125,000 SOMO
- 2025-01-25 Rental Removed $995 APPFOLIO
- 2024-12-14 Listed for Rent $995 APPFOLIO
- 2017-07-08 Listed $24,500 SOMO
- 2008-08-28 Listed $31,000 SOMO
- 2003-09-15 Sold (Public Records) — Public Records
Property tax history
+3.3%/yrLatest (2025): $467 · +32.2% YoY. Source: county tax records.
Cash-flow waterfall
monthlySold comps — $/sqft
last 12 mo · ≤1 miLoading sold comps…