 🏷️ Likely Rental
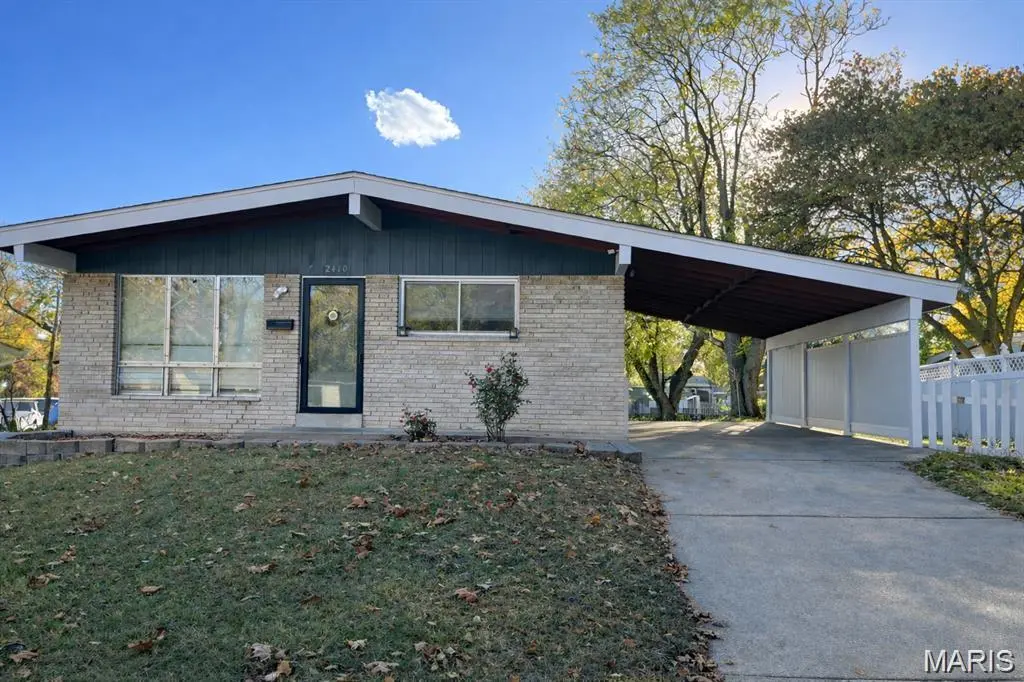
2410 Mockingbird Ln · Florissant, MO
Flood risk 1/10 · Minimal
- FEMA flood zone
- X (unshaded)
- Chance of flooding over 30 yrs
- 0.0%
- Est. flood insurance / yr
- $473 – $860
Fire risk 1/10 · Minimal
- Est. fire insurance / yr
- $1,054 – $1,958
Heat risk 5/10 · Moderate
- Hot days now (above 106°F)
- 7 days/yr
- Hot days in 30 yrs
- 21 days/yr
Wind risk 2/10 · Minimal
- Chance of severe wind over 30 yrs
- 1.0%
Air-quality risk 3/10 · Minor
- Unhealthy air days now
- 3 days/yr
- Unhealthy air days in 30 yrs
- 5 days/yr
Risk factors via First Street. Map © Google.
Why this score? — see what drove the B grade
The composite is a weighted blend of 9 inputs, each scored 0–100. Each bar is that input's sub-score; the figure is the points it added to the 100-point composite (weight × sub-score).
- Cash flow +27.3/30.0
- ARV discount +15.0/15.0
- DSCR +9.5/10.0
- 1% rule +7.4/10.0
- Livability +3.7/5.0
- Rent growth +3.6/5.0
- Condition / age +2.5/5.0
- Schools +1.7/10.0
- Appreciation +0.0/10.0
$135,000
🖨 Deal sheet 📄 Offer letter ✓ Due diligence
Listing remarks
Projected rental potential of $1,495/month makes this an excellent candidate for long-term hold or Section 8 placement. Ideal for investors looking to build equity through light to moderate renovations while securing steady income in a high-demand rental market. Property is being conveyed as-is and the seller reserves the right to accept an offer at any time. The buyer will be responsible for verifying all property details and condition.
Key facts
- 7,705 sq ft lot
- 2 parking spots
- Built 1960
Neighborhood map
What this means for you Summary
Snapshot
- This is a 3-bed/1.5-bath single-family listed at $135k.
Deal economics
- At list price, monthly cash flow is $389 ($5k/yr) — positive.
- The deal already cash-flows at list — no discount required.
- Meets the 1% rule at list price ($2k rent vs $135k).
- Recommended offer: $133k (1.5% below list) — sets the bar for market timing.
- Cap rate 9.7% vs local median 6.3% in Florissant — top-decile yield for the area; either an underpriced asset or a hidden risk that comps aren't pricing in. Stress-test before assuming the spread holds.
Location & tenants
- Location reads 73/100 on livability (#82 in MO) — a middle-class / working-renter tenant base. Strengths: cost of living A+, housing A+, health & safety B+; Watch: crime C-, amenities D+, commute F.
- Hazelwood (suburban): math 11% / reading 26% proficiency, ranked #306 of 324 in MO (top 94%) — low school quality limits family demand, transient renter base, plan for 1-2y turnover.
- Zoned schools: Lusher Elem. (math 12% / reading 22%, grade F, #967 of 1,115 statewide, top 88%, 379 students, 64% FRL); Hazelwood West High (math 16% / reading 42%, grade F, #407 of 521 statewide, top 78%, 2,042 students, 54% FRL).
- Market conditions: Rents rising fast (+4.3%/yr); 271 active listings in the ZIP; 21 comparable units currently listed for rent nearby; rentals leasing fast (median 8d on market — plan ~1-2 weeks tenant-placement turnaround); 920 units permitted in St. Louis County in 2024 (250 in 5+ unit buildings).
Forward outlook
- Local home prices are declining (-3.0%/yr); year-one equity from $933 of loan paydown is wiped out by about $4k of value loss. Plan a longer hold.
- At projected returns (-3.0% appreciation + 4.3% rent growth), your $38k cash investment doubles in ~9 years — after that, you're playing with house money.
Negotiation context
- It's been on market 16 days — a 2% lower offer ($133k) is reasonable based on typical stale-listing flexibility.
- 2 sale attempts with the ask held roughly flat each time — persistent listings suggest the price (not the market) is what's stuck; bring a comps-based counter.
- Current owner paid $50k; list at $135k implies a 170% gain — meaningful room to come down on a strong offer.
Risks & watch-outs
- Climate carrying-cost: extreme-heat days projected 7→21/yr by 2055 (HVAC capex compounding) — expect insurance premiums to compound above CPI over the hold.
Questions for the listing agent
- Built in 1960 — when were the roof, HVAC, electrical panel, plumbing, and water heater last replaced?
- Is there a deadline driving the sale (1031 exchange, divorce, estate, relocation)? That informs how much negotiation room exists.
- Schools are D-rated, which usually means shorter tenancies and higher turnover. Who's the typical renter profile here, and what's been the actual vacancy rate?
- What's the average days-on-market for RENTAL listings here right now (not sales)? A rising rental-DOM trend means longer vacancies and softer asking-rent achievability than the comps imply.
- What's the recent tenant-quality profile in this submarket — average credit score on applications, eviction rate, late-payment / NSF rate, and stable-employment percentage? A property-management company in the area should have these aggregated.
- How much new for-sale + rental construction is in the pipeline within 1–3 miles? Heavy new supply typically softens prices + rents 12–24 months out; constrained supply supports both.
Investment metrics
- 1% rule
- 1.24% ✓
- Cap rate
- 9.75%
- Cash-on-cash
- 12.34%
- DSCR
- 1.55
- GRM
- 6.7
CMA / ARV
- ARV (on-the-fly)
- $179,088
- Comps found
- 12
Show comp detail 12 sales within ~0.75 mi
| Address | Dist | Beds/Ba | Sqft | Sold | Price | $/sf | Match |
|---|---|---|---|---|---|---|---|
| 2216 Foggy Bottom Dr | 0.18mi | 3/2.0 | 1,189 (+9%) | 2mo | $130,000 | $109 | 73 |
| 1910 Flamingo Dr | 0.30mi | 3/1.0 | 1,025 (-6%) | 1mo | $199,500 | $195 | 73 |
| 2377 Farflung Dr | 0.47mi | 3/2.5 | 1,100 (+1%) | 2mo | $204,900 | $186 | 71 |
| 2171 Farthing Ct | 0.22mi | 3/2.0 | 1,189 (+9%) | 3mo | $195,000 | $164 | 71 |
| 2397 Millvalley Dr | 0.49mi | 4/2.0 (+1) | 1,100 (+1%) | 1mo | $169,900 | $154 | 68 |
| 290 Francisca Dr | 0.73mi | 3/1.5 | 1,092 (0%) | 1mo | $145,000 | $133 | 65 |
| 2490 Mullanphy Ln | 0.30mi | 3/1.0 | 952 (-13%) | 2mo | $167,500 | $176 | 61 |
| 2370 Hawthorne Manor Dr | 0.33mi | 3/1.0 | 952 (-13%) | 1mo | $175,900 | $185 | 61 |
| 2328 Urbandale Dr | 0.67mi | 3/2.0 | 1,025 (-6%) | 1mo | $140,400 | $137 | 56 |
| 2425 Lindsay Ln | 0.48mi | 3/1.0 | 960 (-12%) | 1mo | $205,000 | $214 | 54 |
| 2334 White Ash Ct | 0.65mi | 3/2.0 | 1,189 (+9%) | 2mo | $189,900 | $160 | 51 |
| 2572 Auburnhill Ct | 0.55mi | 4/3.0 (+1) | 1,189 (+9%) | 2mo | $185,000 | $156 | 46 |
Match score weights: distance 35% · size 25% · config 20% · recency 20%. Top-matched comps best support the ARV.
Projected returns pro-forma
-3.0% appreciation · 4.27% rent growth · sell at horizon
- IRR
- 3.4%
- Equity multiple
- 1.13×
- Total profit
- $5,062
- Equity at exit
- $20,129
- IRR
- 14.1%
- Equity multiple
- 2.20×
- Total profit
- $45,487
- Equity at exit
- $11,672
Cash invested: $37,800 (down + closing). Projections, not guarantees.
Landlord ↔ Tenant lean methodology
- Overall (STATE)
- 81 Strongly Landlord-Friendly
- State Missouri
- 81 Strongly Landlord-Friendly · R+10
- County
- — inherits STATE
- City
- — inherits STATE
ZIP-level market 63031
- Rents YoY
- 4.3%
- Active inventory
- 271
- Price-to-rent
- 6.7×
Monthly cashflow live
- Estimated rent
- $1,672 high interval (Pro) →
- Mortgage (P&I)
- −$708
- Tax from tax record
- −$168 /mo · $2,017/yr
- Insurance
- −$56
- HOA
- −$0
- Vacancy / Maint / Mgmt
- −$351
- Net cashflow
- $389
Break-even live
UW: 25.0% down · 7.5% · 30yr · 1.5% tax · 5.0% vac · 8.0% maint · 8.0% mgmt
Financing live
Cash to close
- Down payment
- $33,750
- Closing costs
- $4,050
- Reserves months
- —
- Total cash needed
- —
Loan-product check · same deal, 3 products live
Conventional
25% down · 7.5% · 30yr
- Down + closing
- —
- Monthly P&I
- —
- Monthly cashflow
- —
- DSCR
- —
- Eligible?
- —
Personal DTI + credit; lowest rate.
DSCR
20% down · 8.5% · 30yr
- Down + closing
- —
- Monthly P&I
- —
- Monthly cashflow
- —
- DSCR
- —
- Eligible?
- —
No personal income docs; deal must DSCR.
Hard money
10% down · 12.0% · 12mo
- Down + closing
- —
- Monthly P&I
- —
- Monthly cashflow
- —
- DSCR
- —
- Eligible?
- —
Short-term bridge; refi at stabilization.
Rent comps 21 comps
| Address | Beds | Baths | Sqft | Rent | $/sqft | DOM | Units | Dist |
|---|---|---|---|---|---|---|---|---|
| 1545 Swan Dr Florissant, MO | 3.0 | 1.0 | 1064 | $1,590 | $1.49 | 8d | 1 | 0.03mi |
| 1315 Bobolink Dr Florissant, MO | 3.0 | 2.0 | 1025 | $1,700 | $1.66 | 12d | 1 | 0.26mi |
| 2400 Teakwood Manor Dr Florissant, MO | 3.0 | 2.0 | 1380 | $1,725 | $1.25 | 44d | 1 | 0.39mi |
| 2316 Millvalley Dr Florissant, MO | 3.0 | 3.0 | 1189 | $1,696 | $1.43 | 15d | 1 | 0.39mi |
| 1095 Cedar Pl Florissant, MO | 3.0 | 1.5 | 1107 | $1,710 | $1.54 | 2d | 1 | 0.40mi |
| 2245 Lindsay Ln Florissant, MO | 4.0 | 2.0 | 1466 | $1,800 | $1.23 | 16d | 1 | 0.48mi |
| 2160 Splendor Dr Florissant, MO | 3.0 | 2.0 | 1100 | $1,800 | $1.64 | 3d | 1 | 0.59mi |
| 1540 Aspen Dr Florissant, MO | 3.0 | 2.0 | 912 | $1,395 | $1.53 | 8d | 1 | 0.68mi |
| 2485 Jenkee Dr Florissant, MO | 3.0 | 1.0 | 960 | $1,376 | $1.43 | 2d | 1 | 0.76mi |
| 1395 Bluebird Dr Florissant, MO | 3.0 | 2.0 | 1168 | $1,599 | $1.37 | 16d | 1 | 0.76mi |
| 1095 Humes Ln Florissant, MO | 3.0 | 1.5 | 1100 | $1,650 | $1.50 | 4d | 1 | 0.94mi |
| 1145 Swallow Ln Florissant, MO | 3.0 | 2.0 | 1288 | $1,645 | $1.28 | 3d | 1 | 0.96mi |
| 1015 Lindsay Ln Florissant, MO | 3.0 | 2.0 | 988 | $1,600 | $1.62 | 24d | 1 | 1.05mi |
| 9 Charlotte Dr Florissant, MO | 3.0 | 1.5 | 1404 | $1,641 | $1.17 | 4d | 1 | 1.10mi |
| 855 Daniel Boone Dr Florissant, MO | 3.0 | 1.0 | 964 | $1,400 | $1.45 | 44d | 1 | 1.22mi |
| 2280 Keeven Ln Florissant, MO | 1.0–3.0 | 1.0–1.5 | 805 | $1,290 | $1.60 | 2d | 14 | 1.22mi |
| 3015 Matlock Dr Florissant, MO | 3.0 | 1.0 | 950 | $1,475 | $1.55 | 44d | 1 | 1.31mi |
| 765 Babler Dr Florissant, MO | 3.0 | 2.0 | 888 | $1,700 | $1.91 | 8d | 1 | 1.31mi |
| 2857 Dawnview Dr Florissant, MO | 3.0 | 1.0 | 890 | $1,325 | $1.49 | 8d | 1 | 1.37mi |
| 840 Dawnview Ct Florissant, MO | 3.0 | 1.5 | 750 | $900 | $1.20 | 24d | 1 | 1.42mi |
| 775 Sherwood Dr Florissant, MO | 3.0 | 1.0 | 1023 | $1,690 | $1.65 | 44d | 1 | 1.46mi |
Listing history 12 events
-
2026-06-18days on market $135,000 Active 16 DOM
-
2026-06-17days on market $135,000 Active 15 DOM
-
2026-06-16days on market $135,000 Active 14 DOM
-
2026-06-15days on market $135,000 Active 13 DOM
-
2026-06-13days on market $135,000 Active 11 DOM
-
2026-06-13statusdays on market $135,000 Active 10 DOM
-
2026-03-27status Pending
-
2026-03-17$135,000 Active
-
2026-01-01$2,000,000 Active
-
2015-03-18soldstatus $50,000
-
2015-03-17soldstatus $47,000
-
2015-03-10soldstatus $28,765
ⓘ Source: listings_history table (triggers on properties + properties_extension) + one-shot
backfill from property_details.listing_events for pre-trigger history.
Tax reassessment forecast MO · Resets to sale price
- Current annual tax
- $2,017 · $168/mo
- Projected year-2 tax
- $2,017 · $168/mo
- Expected delta
- $0/yr ($0/mo · 0.0%)
ⓘ Screening estimate from a state-policy table — verify with the county assessor before closing.
Climate risk First Street
- Flood 1/10 Low FEMA zone X (unshaded) · 0% chance over 30 yrs
- Wildfire 1/10 Low
- Heat 5/10 Major 7 d/yr ≥106°F today · 21 d/yr by 30 yrs out
- Wind 2/10 Low 100% chance of damaging wind over 30 yrs
- Air quality 3/10 Moderate 3 unhealthy d/yr today · 5 by 30 yrs out
Nearby sold comps map
Loading sold comps map…
Walkable amenities ~0.75 mi
Loading nearby amenities…
Taxation est. · year 1
- Rental income
- $20,063
- − Mortgage interest
- −$7,562
- − Property taxes
- −$2,017
- − Insurance
- −$675
- − Repairs & maintenance
- −$1,605
- − Management
- −$1,605
- − Depreciation
- −$3,927
- Taxable income
- $2,672
- Est. tax owed @ 24.0%
- −$641
- After-tax cash flow
- $4,022/yr
For passive investors: Depreciation is non-cash, so a rental often shows a tax loss while cash-flowing — sheltering income. Rental losses are passive: they offset passive income freely, and up to $25,000/yr can offset ordinary (W-2) income if you actively participate and your MAGI is under $100k (phasing out to $0 by $150k); unused losses carry forward. On sale, claimed depreciation is recaptured at up to 25%, and gains may owe capital-gains tax (a 1031 exchange can defer both). Figures are a year-1 estimate at your 24.0% rate — not tax advice; consult a CPA.
Schools (NCES district)
- District
- Hazelwood
- NCES district ID
- 2913830
- Math proficiency
- 11% ▼ -13.00%
- Reading proficiency
- 26% ▼ -6.00%
- Median HH income
- $51,621
- Composite
- 16.77/100
- National rank
- #9156
- State rank
- #306 of 324 in MO
Livability — Florissant
- Score
- 73/100
- State rank
- #82
- US rank
- #5406
Category grades
Schools grade is shown separately in the Schools card above.
Census & demographics
- Census place
- Florissant, MO
- County
- Saint Louis County · 888,823 people
- City population
- 69,104
- Metro
- St. Louis, MO-IL
- Population (ZIP)
- 50,196
- Household income
- $70,811
- Rent vs Own
- Severe rent burden
- 1279.0
Population outlook (St. Louis County) Hauer SSP2
- Today (2025)
- 1,025,227 people
- By 2030
- 1,028,023 · +0.3%
- By 2040
- 1,020,940 · -0.4%
- By 2050
- 1,007,280 · -1.8%
- By 2075
- 987,277 · -3.7%
- By 2100
- 921,984 · -10.1%
Race, ethnicity, and origin ACS 2023
- Neighborhood character
- Diverse neighborhood (Simpson 0.58)
- Race & ethnicity
- White 49% Black 41% Two or more races 7% Hispanic / Latino 2%
- Common ancestry
- Romanian 3% Lithuanian 3% Swedish 1%
- Foreign-born
- 5% · Canada, Jamaica
- Languages at home
- 94% English-only · Spanish 2% Arabic 1%
Political lean MEDSL · St. Louis
- 2024 margin
- Strong D (+23.4) · D 60.8% · R 37.4% · Other 1.7%
- 2008→2024 swing
- +3.5pp toward D · 2008: 19.9pp · 2024: 23.4pp
- All cycles
- 2024: D+23.4 2020: D+24.0 2016: D+16.2 2012: D+13.7 2008: D+19.9
Not yet ingested
- Civics
- —
Market trends
- HPI YoY
- ▼ -223.57%
- Current HPI
- 202.7192
- Rent YoY
- ▲ 4.27%
- Metro
- St. Louis, MO-IL
- State GDP YoY
- ▲ 1.84%
- F500 in state
- 20
Industry mix (Fortune 500 HQ in MO)
| Industry | F500 HQs | Revenue |
|---|---|---|
| Healthcare | 1 | $163B |
|
||
| Insurance | 1 | $21B |
|
||
| Industrial Technology | 1 | $17B |
|
||
| Retail | 1 | $16B |
|
||
| Industrial Distribution | 1 | $10B |
|
||
| Utilities | 1 | $9B |
|
||
Price history
+369.3% since first listed6 events — show timeline
- 2026-03-27 Pending — MARIS as Distributed by MLS Grid
- 2026-03-17 Listed $135,000 MARIS as Distributed by MLS Grid
- 2026-01-01 Listed $2,000,000 MARIS as Distributed by MLS Grid
- 2015-03-18 Sold (Public Records) $50,000 Public Records
- 2015-03-17 Sold (Public Records) $47,000 Public Records
- 2015-03-10 Sold (Public Records) $28,765 Public Records
Property tax history
+2.5%/yrLatest (2022): $2,017 · +2.7% YoY. Source: county tax records.
Cash-flow waterfall
monthlySold comps — $/sqft
last 12 mo · ≤1 miLoading sold comps…