 Fourplex
11115 N 13th Ln · McAllen, TX
Flood risk No data
- FEMA flood zone
- —
- Chance of flooding over 30 yrs
- —
- Est. flood insurance / yr
- —
Fire risk No data
- Est. fire insurance / yr
- —
Heat risk No data
- Hot days now (above threshold)
- —
- Hot days in 30 yrs
- —
Wind risk No data
- Chance of severe wind over 30 yrs
- —
Air-quality risk No data
- Unhealthy air days now
- —
- Unhealthy air days in 30 yrs
- —
Risk factors via First Street. Map © Google.
Why this score? — see what drove the C grade
The composite is a weighted blend of 9 inputs, each scored 0–100. Each bar is that input's sub-score; the figure is the points it added to the 100-point composite (weight × sub-score).
- Cash flow +25.4/30.0
- DSCR +8.4/10.0
- 1% rule +6.8/10.0
- Condition / age +5.0/5.0
- Livability +3.8/5.0
- Rent growth +3.1/5.0
- Schools +2.2/10.0
- ARV discount +0.8/15.0
- Appreciation +0.0/10.0
$520,000
🖨 Deal sheet (PDF) 📄 Offer letter ✓ Due diligence
Multi-family units
County records classify this as Multi-Family (2-4 Unit). Listing-text estimate: 4 units. confirmed
Listing remarks
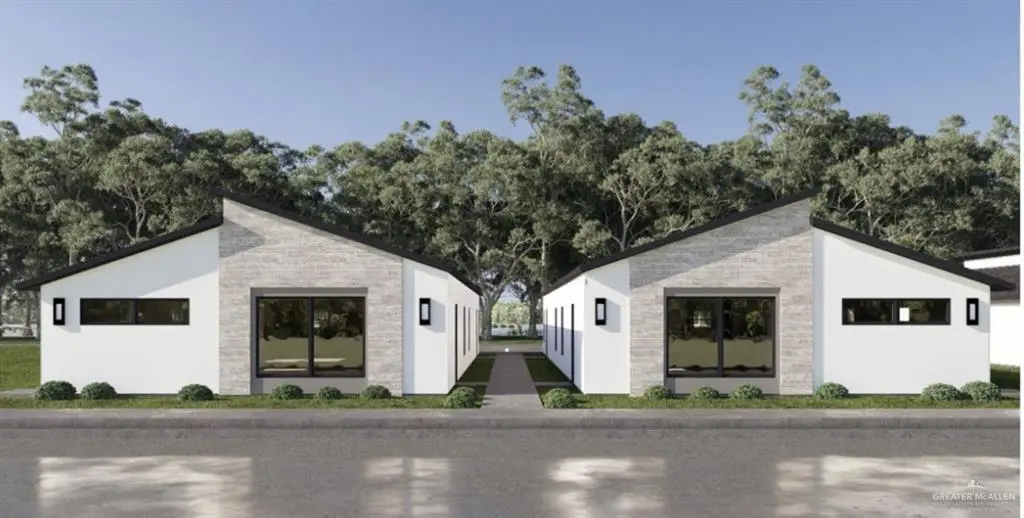
Take advantage of this pre-sale investment opportunity in the growing McAllen area! This planned new construction 4-plex will feature two 3-bedroom, 2-bath units and two 2-bedroom, 2-bath units, all with appliances included. Secure the property before construction begins and benefit from pre-sale pricing. The development will be conveniently located near FM 107 (University Drive), Bicentennial Blvd, and N. 10th Street, providing easy access to UTRGV, shopping centers, restaurants, fitness facilities, H-E-B, Lowe’s, and other everyday amenities. Surrounded by established and expanding residential communities, this future income-producing property offers excellent rental potential and l
Key facts
- Easy access to utrgv
- Conveniently located
- 9,141 sq ft lot
Tags
Property features AI
Finance
- Other: Lot dimensions about 52 x 116 (0.2099 acres)
- HOA & community: Villages at Park West HOA; HOA fee $800 annually; POA mandatory with $250 transfer fee; Community of 4 units
Exterior
- Parking: 8 covered parking spaces; 8 carport spaces; No garage
- Utilities: City sewer; 5 separate water meters; Electric service
- Home design: Not new construction; Living area per blueprints
- Construction: Stone and stucco construction; Shingle roof; Slab foundation; Built area approximately 4,002
- Exterior features: Patio; Public water; Paved road access; Sidewalks; Outbuilding (none)
Interior
- Kitchen: Microwave; Refrigerator; Electric smooth-top range
- Flooring: Tile
- Heating & cooling: Central heating (electric); Central air conditioning (electric); Thermostat
- Interior features: Built-in features; Ceiling fans; Decorative/high ceilings; Microwave; 1-year warranty (equipment)
- Laundry & utility: Laundry closet; Washer/dryer connections; Washer; Dryer; Electric water heater
Neighborhood map
What this means for you Summary
Snapshot
- This is a 2×3bd/2ba + 2×2bd/2ba units multifamily listed at $520k. Condition is rated excellent.
Deal economics
- At list price, monthly cash flow is $1k ($14k/yr) — positive. Per door: $299/mo.
- The deal already cash-flows at list — no discount required.
- Meets the 1% rule at list price ($6k rent vs $520k).
- Recommended offer: $512k (1.5% below list) — sets the bar for market timing.
- Cap rate 9.1% vs local median 3.7% in McAllen — top-decile yield for the area; either an underpriced asset or a hidden risk that comps aren't pricing in. Stress-test before assuming the spread holds.
Location & tenants
- Location reads 76/100 on livability (#119 in TX, #3,771 nationally) — a middle-class / working-renter tenant base. Strengths: cost of living A+, housing A+, health & safety A+; Watch: employment D, amenities F, commute F.
- Edinburg CISD (urban): math 20% / reading 34% proficiency, ranked #699 of 826 in TX (top 85%) — low school quality limits family demand, transient renter base, plan for 1-2y turnover; 62% free/reduced lunch — lower-income household profile, screen leases tightly.
- Zoned schools: Cavazos El (math 37% / reading 42%, grade F, #1,545 of 4,322 statewide, top 38%, 409 students, 83% FRL); Elias Longoria Sr Middle (math 16% / reading 35%, grade F, #1,236 of 1,662 statewide, top 76%, 804 students, 82% FRL); Robert R Vela H S (math 27% / reading 48%, grade F, #888 of 1,632 statewide, top 55%, 2,189 students, 62% FRL).
- Market conditions: Rents rising (+2.6%/yr); 898 active listings in the ZIP; 7 comparable units currently listed for rent nearby; rentals lingering (median 46d on market — plan ~5-8 weeks vacancy on turnover, expect pricing pressure); 86% of comp listings sitting > 30 days — soft ceiling on asking rent; solid renter incomes; 7,378 units permitted in Hidalgo County in 2024 (641 in 5+ unit buildings).
- At $6,146/mo this rent would consume 90% of the median local household income ($82k/yr) (locally 1468% of renters already pay >50% of income on rent) — very limited rent-growth headroom before tenants either downsize or default.
Forward outlook
- Local home prices are declining (-3.0%/yr); year-one equity from $4k of loan paydown is wiped out by about $16k of value loss. Plan a longer hold.
- Hidalgo County population projected at +28% by 2050 — long-run rental-demand tailwind backs the buy-and-hold thesis.
Negotiation context
- It's been on market 19 days — a 2% lower offer ($512k) is reasonable based on typical stale-listing flexibility.
Questions for the listing agent
- Can we see the unit-by-unit rent roll, current vacancy, and any below-market leases? What's the average tenancy length?
- What capital expenditures (roof, boiler, parking lot, exteriors) have been made in the last 5 years, and what's planned in the next 2?
- What does the HOA fee cover, when was the last increase, and are there any pending special assessments or reserve-fund shortfalls?
- Is there a deadline driving the sale (1031 exchange, divorce, estate, relocation)? That informs how much negotiation room exists.
- Schools are B-rated — typically a magnet for longer-tenancy family renters. What's the average tenant stay here, and is there a school-zone premium baked into asking?
- What's the average days-on-market for RENTAL listings here right now (not sales)? A rising rental-DOM trend means longer vacancies and softer asking-rent achievability than the comps imply.
- What's the recent tenant-quality profile in this submarket — average credit score on applications, eviction rate, late-payment / NSF rate, and stable-employment percentage? A property-management company in the area should have these aggregated.
- How much new apartment / multifamily construction is in the pipeline within 1–3 miles? Heavy new supply (>2% of stock underway) typically softens rents 12–24 months out; light construction supports rent growth.
Investment metrics
- 1% rule
- 1.18% ✓
- Cap rate
- 9.05%
- Cash-on-cash
- 9.85%
- DSCR
- 1.44
- GRM
- 7.1
CMA / ARV
- ARV (on-the-fly)
- $452,226
- Comps found
- 1
Show comp detail 1 sale within ~0.75 mi
| Address | Dist | Beds/Ba | Sqft | Sold | Price | $/sf | Match |
|---|---|---|---|---|---|---|---|
| 4000 Whitewing Ave | 0.65mi | —/— | 4,080 (+2%) | 10mo | $459,900 | $113 | 58 |
Match score weights: distance 35% · size 25% · config 20% · recency 20%. Top-matched comps best support the ARV.
Projected returns pro-forma
-3.0% appreciation · 2.57% rent growth · sell at horizon
- IRR
- -2.0%
- Equity multiple
- 0.93×
- Total profit
- $-10,683
- Equity at exit
- $77,534
- IRR
- 7.3%
- Equity multiple
- 1.54×
- Total profit
- $78,453
- Equity at exit
- $44,960
Cash invested: $145,600 (down + closing). Projections, not guarantees.
Landlord ↔ Tenant lean methodology
- Overall (STATE)
- 87 Strongly Landlord-Friendly
- State Texas
- 87 Strongly Landlord-Friendly · R+5
- County
- — inherits STATE
- City
- — inherits STATE
ZIP-level market 78504
- Home prices YoY
- -29.4%
- Rents YoY
- 2.6%
- Active inventory
- 898
- Price-to-rent
- 27.5×
Monthly cashflow live
- Estimated rent
- $6,146 high interval (Pro) →
- Mortgage (P&I)
- −$2,727
- Tax est. 1.5%
- −$650 /mo · $7,800/yr
- Insurance
- −$217
- HOA
- −$67
- Vacancy / Maint / Mgmt
- −$1,291
- Net cashflow
- $1,195
Break-even live
Sensitivity live
| Price | -10% $1,554 | -5% $1,374 | +0% $1,195 | +5% $1,015 | +10% $835 |
|---|---|---|---|---|---|
| Rent | -10% $709 | -5% $952 | +0% $1,195 | +5% $1,438 | +10% $1,680 |
| Rate | -1.0pp $1,457 | -0.5pp $1,327 | base $1,195 | +0.5pp $1,060 | +1.0pp $923 |
4-unit breakdown (identical units grouped — click to expand)
| Units | Beds | Baths | Est. rent |
|---|---|---|---|
| 2× units | 3 | 2 | $3,148 |
| #1 | 3 | 2 | $1,574 |
| #2 | 3 | 2 | $1,574 |
| 2× units | 2 | 2 | $2,998 |
| #3 | 2 | 2 | $1,499 |
| #4 | 2 | 2 | $1,499 |
| Total (4 units) | $6,146 | ||
UW: 25.0% down · 7.5% · 30yr · 1.5% tax · 5.0% vac · 8.0% maint · 8.0% mgmt
Financing live
Cash to close
- Down payment
- $130,000
- Closing costs
- $15,600
- Reserves months
- —
- Total cash needed
- —
Loan-product check · same deal, 3 products live
Conventional
25% down · 7.5% · 30yr
- Down + closing
- —
- Monthly P&I
- —
- Monthly cashflow
- —
- DSCR
- —
- Eligible?
- —
Personal DTI + credit; lowest rate.
DSCR
20% down · 8.5% · 30yr
- Down + closing
- —
- Monthly P&I
- —
- Monthly cashflow
- —
- DSCR
- —
- Eligible?
- —
No personal income docs; deal must DSCR.
Hard money
10% down · 12.0% · 12mo
- Down + closing
- —
- Monthly P&I
- —
- Monthly cashflow
- —
- DSCR
- —
- Eligible?
- —
Short-term bridge; refi at stabilization.
Rent comps 7 comps
| Address | Beds | Baths | Sqft | Rent | $/sqft | DOM | Units | Dist |
|---|---|---|---|---|---|---|---|---|
| 702 S Logan Dr Unit 3 Edinburg, TX | 2.0 | 2.5 | 4488 | $950 | $0.21 | 45d | 1 | 0.57mi |
| 11401 N 25th St Unit 2 McAllen, TX | 3.0 | 2.0 | 4004 | $1,350 | $0.34 | 45d | 1 | 0.91mi |
| 2501 Indian Creek Ave Unit 1 McAllen, TX | 2.0 | 2.0 | 4100 | $1,175 | $0.29 | 25d | 1 | 1.10mi |
| 2714 S Ringold Cir Unit 4 Edinburg, TX | 2.0 | 2.0 | 3360 | $850 | $0.25 | 45d | 1 | 1.42mi |
| 901 N Woodson Ave Unit 3 Edinburg, TX | 3.0 | 2.0 | 4200 | $1,095 | $0.26 | 45d | 1 | 1.44mi |
| 822 N Blair Ave Unit 1 Edinburg, TX | 2.0 | 2.0 | 4084 | $1,075 | $0.26 | 45d | 1 | 1.45mi |
| 1000 N Blair Ave Unit 4 Edinburg, TX | 2.0 | 2.0 | 4020 | $1,075 | $0.27 | 45d | 1 | 1.50mi |
HOA detail
- Monthly dues
- $67 · $804/yr
Listing history 13 events
-
2026-06-21days on market $520,000 Active 19 DOM
-
2026-06-18days on market $520,000 Active 16 DOM
-
2026-06-17days on market $520,000 Active 15 DOM
-
2026-06-16days on market $520,000 Active 14 DOM
-
2026-06-15days on market $520,000 Active 13 DOM
-
2026-06-14days on market $520,000 Active 11 DOM
-
2026-06-13days on market $520,000 Active 10 DOM
-
2026-06-10days on market $520,000 Active 8 DOM
-
2026-06-09days on market $520,000 Active 7 DOM
-
2026-06-08days on market $520,000 Active 6 DOM
-
2026-06-07days on market $520,000 Active 5 DOM
-
2026-06-03remarks 693-char remark
-
2026-06-03$520,000 Active 1 DOM
ⓘ Source: listings_history table (triggers on properties + properties_extension) + one-shot
backfill from property_details.listing_events for pre-trigger history.
Nearby sold comps map
Loading sold comps map…
Walkable amenities ~0.75 mi
Loading nearby amenities…
Taxation est. · year 1
- Rental income
- $73,752
- − Mortgage interest
- −$29,128
- − Property taxes
- −$7,800
- − Insurance
- −$2,600
- − Repairs & maintenance
- −$5,900
- − Management
- −$5,900
- − HOA
- −$804
- − Depreciation
- −$15,127
- Taxable income
- $6,492
- Est. tax owed @ 24.0%
- −$1,558
- After-tax cash flow
- $12,779/yr
For passive investors: Depreciation is non-cash, so a rental often shows a tax loss while cash-flowing — sheltering income. Rental losses are passive: they offset passive income freely, and up to $25,000/yr can offset ordinary (W-2) income if you actively participate and your MAGI is under $100k (phasing out to $0 by $150k); unused losses carry forward. On sale, claimed depreciation is recaptured at up to 25%, and gains may owe capital-gains tax (a 1031 exchange can defer both). Figures are a year-1 estimate at your 24.0% rate — not tax advice; consult a CPA.
Condition & rehab AI · 2 photos
This new construction 4-plex is in excellent condition with no visible repairs or maintenance needed. It offers excellent rental potential and can be further enhanced with landscaping and interior upgrades.
Value-add opportunities
- Both Landscaping and curb appeal improvements — Enhancing the landscaping and curb appeal can increase both the resale and rental value
- Both Interior finishes and fixtures — Upgrading the interior finishes and fixtures can significantly increase the property's value
- Both Appliances and furniture — Including appliances and furniture in the rental units can attract tenants and increase rental income
Renovation cost estimate screening
Value-add ROI direction
- Both Landscaping and curb appeal improvements — Enhancing the landscaping and curb appeal can increase both the resale and rental value ↑
- Both Interior finishes and fixtures — Upgrading the interior finishes and fixtures can significantly increase the property's value ↑
- Both Appliances and furniture — Including appliances and furniture in the rental units can attract tenants and increase rental income ↑
ⓘ Cost ranges are severity-bucket heuristics (US national rule-of-thumb). Get contractor quotes + a written scope before underwriting a rehab budget.
Schools (NCES district)
- District
- Edinburg CISD
- NCES district ID
- 4818180
- Math proficiency
- 20% ▼ -34.00%
- Reading proficiency
- 34% ▼ -11.00%
- Median HH income
- $36,985
- Composite
- 22.42/100
- National rank
- #8114
- State rank
- #699 of 826 in TX
Livability — McAllen
- Score
- 76/100
- State rank
- #119
- US rank
- #3771
Category grades
Schools grade is shown separately in the Schools card above.
Census & demographics
- Census place
- McAllen, TX
- County
- Hidalgo County · 623,128 people
- City population
- 144,650
- Metro
- McAllen-Edinburg-Mission, TX
- Population (ZIP)
- 63,094
- Household income
- $81,905
- Rent vs Own
- Severe rent burden
- 1468.0
Population outlook (Hidalgo County) Hauer SSP2
- Today (2025)
- 955,232 people
- By 2030
- 1,009,774 · +5.7%
- By 2040
- 1,120,332 · +17.3%
- By 2050
- 1,225,036 · +28.2%
- By 2075
- 1,439,189 · +50.7%
- By 2100
- 1,533,429 · +60.5%
Race, ethnicity, and origin ACS 2023
- Neighborhood character
- Predominantly Hispanic (82%)
- Race & ethnicity
- Hispanic / Latino 82% Two or more races 39% White 11% Asian 5%
- Hispanic origin (detail)
- Mexican 75%
- Common ancestry
- Lithuanian 1% Italian 1%
- Foreign-born
- 24% · Canada, South Korea, Vietnam
- Languages at home
- 34% English-only · Spanish 62% Other Asian/Pacific 1% Tagalog/Filipino 1%
Political lean MEDSL · Hidalgo
- 2024 margin
- Toss-up / Even · D 48.1% · R 51.0%
- 2008→2024 swing
- -41.6pp toward R · 2008: 38.7pp · 2024: -2.9pp
- All cycles
- 2024: R+2.9 2020: D+17.1 2016: D+40.5 2012: D+41.8 2008: D+38.7
Not yet ingested
- Civics
- —
Market trends
- HPI YoY
- ▼ -80.87%
- Current HPI
- 194.1764
- Rent YoY
- ▲ 2.57%
- Metro
- McAllen-Edinburg-Mission, TX
- State GDP YoY
- ▲ 3.95%
- F500 in state
- 110
Industry mix (Fortune 500 HQ in TX)
| Industry | F500 HQs | Revenue |
|---|---|---|
| Energy | 16 | $1,198B |
|
||
| Technology | 5 | $198B |
|
||
| Engineering / Construction | 4 | $72B |
|
||
| Energy Services | 3 | $60B |
|
||
| Utilities | 3 | $41B |
|
||
| Healthcare | 2 | $330B |
|
||
Price history
1 event — show timeline
- 2026-06-02 Listed $520,000 MCALLENMLS
Cash-flow waterfall
monthlySold comps — $/sqft
last 12 mo · ≤1 miLoading sold comps…