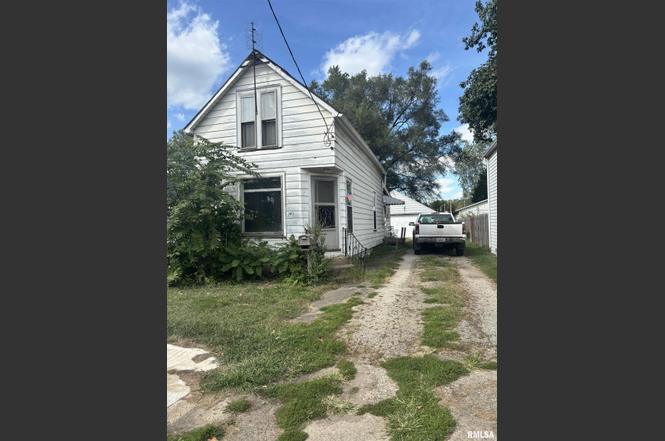
2813 W Marquette St · Peoria, IL
Flood risk 6/10 · Moderate
- FEMA flood zone
- X
- Chance of flooding over 30 yrs
- 0.75%
- Est. flood insurance / yr
- $473 – $860
Fire risk 1/10 · Minimal
- Est. fire insurance / yr
- $804 – $1,492
Heat risk 3/10 · Minor
- Hot days now (above 105°F)
- 7 days/yr
- Hot days in 30 yrs
- 18 days/yr
Wind risk 2/10 · Minimal
- Chance of severe wind over 30 yrs
- 1.0%
Air-quality risk 3/10 · Minor
- Unhealthy air days now
- 1 days/yr
- Unhealthy air days in 30 yrs
- 3 days/yr
Risk factors via First Street. Map © Google.
Why this score? — see what drove the C grade
The composite is a weighted blend of 9 inputs, each scored 0–100. Each bar is that input's sub-score; the figure is the points it added to the 100-point composite (weight × sub-score).
- Cash flow +15.0/30.0
- ARV discount +15.0/15.0
- Appreciation +5.3/10.0
- 1% rule +5.0/10.0
- DSCR +5.0/10.0
- Livability +3.7/5.0
- Rent growth +2.5/5.0
- Condition / age +2.5/5.0
- Schools +1.1/10.0
$22,500
🖨 Deal sheet (PDF) 📄 Offer letter ✓ Due diligence
Listing remarks
Charming 1 bedroom with a spacious den offering the flexibility for a home office, guest space, or hobby room! This property features a rare 2-stall garage, providing ample storage and parking. Functional layout, comfortable living spaces, and extra room to fit your lifestyle needs!
Key facts
- Rare 2-stall garage
- Spacious den
- 3,870 sq ft lot
Tags
Neighborhood map
What this means for you Summary
Snapshot
- This is a 1-bed/1.0-bath single-family listed at $22k.
Deal economics
- At list price, monthly cash flow is $579 ($7k/yr) — positive.
- The deal already cash-flows at list — no discount required.
- Meets the 1% rule at list price ($956 rent vs $22k).
- Recommended offer: $22k (3.0% below list) — sets the bar for market timing.
- Cap rate 37.2% vs local median 5.6% in Peoria — top-decile yield for the area; either an underpriced asset or a hidden risk that comps aren't pricing in. Stress-test before assuming the spread holds.
Location & tenants
- Location reads 73/100 on livability (#270 in IL) — a middle-class / working-renter tenant base. Strengths: commute A+, cost of living A+, housing A+; Watch: employment D+, crime F.
- Peoria SD 150 (urban): math 11% / reading 14% proficiency, ranked #554 of 620 in IL (top 89%) — low school quality limits family demand, transient renter base, plan for 1-2y turnover; 70% free/reduced lunch — lower-income household profile, screen leases tightly.
- Zoned schools: Manual High School (math 2% / reading 2%, grade F, #659 of 693 statewide, top 100%, 656 students, 0% FRL) — zoned schools average 0% FRL vs 70% district-wide (70 pts lower); this property's tenant base skews higher-income than the district average.
- Market conditions: 42 active listings in the ZIP; 16 comparable units currently listed for rent nearby; rentals at typical pace (median 22d on market — plan ~3-4 weeks tenant-placement turnaround); lower-income renter base — watch delinquency; 73 units permitted in Peoria County in 2024 (0 in 5+ unit buildings).
- This rent runs 43% of the median local income ($26k/yr) — at the standard rent-burdened threshold; future hikes will face affordability resistance.
Forward outlook
- In year one you build about $298 of equity ($156 loan paydown + $142 appreciation (0.6% local appreciation)).
- Peoria County population projected at -11% by 2050 — secular population decline; favor cash flow + early exit over multi-decade hold.
- At projected returns (0.6% appreciation + 3.0% rent growth), your $6k cash investment doubles in ~1 year — after that, you're playing with house money.
Negotiation context
- It's been on market 46 days — a 3% lower offer ($22k) is reasonable based on typical stale-listing flexibility.
- 2 sale attempts with the ask held roughly flat each time — persistent listings suggest the price (not the market) is what's stuck; bring a comps-based counter.
Risks & watch-outs
- Watch-outs: property tax is 2.6% of price; built in 1910 — expect roof / HVAC / electrical / plumbing capex.
- Climate carrying-cost: major flood risk — expect insurance premiums to compound above CPI over the hold.
Questions for the listing agent
- It's been on market 46 days. Have you received any prior offers? Is the seller open to a 3% concession, seller financing, or rate buy-down credit?
- Built in 1910 — when were the roof, HVAC, electrical panel, plumbing, and water heater last replaced?
- Property tax is high relative to price — has the assessment been appealed recently, and will the sale trigger a re-assessment?
- Is there a deadline driving the sale (1031 exchange, divorce, estate, relocation)? That informs how much negotiation room exists.
- Schools are F-rated, which usually means shorter tenancies and higher turnover. Who's the typical renter profile here, and what's been the actual vacancy rate?
- Crime grade is F in this area — have there been break-ins, vandalism, or insurance claims at this property in the last 3 years? What carrier currently insures it and at what premium?
- What's the average days-on-market for RENTAL listings here right now (not sales)? A rising rental-DOM trend means longer vacancies and softer asking-rent achievability than the comps imply.
- What's the recent tenant-quality profile in this submarket — average credit score on applications, eviction rate, late-payment / NSF rate, and stable-employment percentage? A property-management company in the area should have these aggregated.
- How much new for-sale + rental construction is in the pipeline within 1–3 miles? Heavy new supply typically softens prices + rents 12–24 months out; constrained supply supports both.
Investment metrics
- 1% rule
- 4.25% ✓
- Cap rate
- 37.20%
- Cash-on-cash
- 110.38%
- DSCR
- 5.91
- GRM
- 2.0
CMA / ARV
- ARV (on-the-fly)
- $39,200
- Comps found
- 12
Show comp detail 12 sales within ~0.75 mi
| Address | Dist | Beds/Ba | Sqft | Sold | Price | $/sf | Match |
|---|---|---|---|---|---|---|---|
| 3021 W Malone St | 0.23mi | 2/1.0 (+1) | 1,000 (+2%) | 1mo | $17,000 | $17 | 80 |
| 2813 W Marquette St | 0.00mi | 1/1.0 | 850 (-13%) | 1mo | $20,000 | $24 | 77 |
| 2600 W Fremont St | 0.44mi | 2/1.0 (+1) | 968 (-1%) | 8mo | $39,000 | $40 | 66 |
| 2123 W Antoinette St | 0.53mi | 2/1.0 (+1) | 1,036 (+6%) | 1mo | $22,000 | $21 | 60 |
| 2126 W Proctor St | 0.52mi | 2/1.0 (+1) | 1,006 (+3%) | 10mo | $9,000 | $9 | 58 |
| 2507 W Latrobe St | 0.33mi | 2/1.0 (+1) | 900 (-8%) | 10mo | $41,000 | $46 | 58 |
| 2320 W Garden St | 0.40mi | 2/1.0 (+1) | 1,096 (+12%) | 3mo | $20,000 | $18 | 54 |
| 1023 S Tonti Cir | 0.40mi | 2/1.0 (+1) | 896 (-9%) | 10mo | $70,000 | $78 | 54 |
| 611 S Ligonier St | 0.37mi | 2/— (+1) | 1,064 (+9%) | 12mo | $18,000 | $17 | 53 |
| 2000 W Antoinette St | 0.67mi | 2/1.0 (+1) | 924 (-6%) | 2mo | $57,500 | $62 | 52 |
| 1707 S East Ln | 0.71mi | 2/1.0 (+1) | 992 (+1%) | 13mo | $95,000 | $96 | 49 |
| 1400 S Griswold St | 0.38mi | 2/1.0 (+1) | 864 (-12%) | 16mo | $44,000 | $51 | 45 |
Match score weights: distance 35% · size 25% · config 20% · recency 20%. Top-matched comps best support the ARV.
Projected returns pro-forma
0.63% appreciation · 3.0% rent growth · sell at horizon
- IRR
- —
- Equity multiple
- 6.87×
- Total profit
- $36,954
- Equity at exit
- $7,254
- IRR
- —
- Equity multiple
- 14.26×
- Total profit
- $83,552
- Equity at exit
- $9,318
Cash invested: $6,300 (down + closing). Projections, not guarantees.
Landlord ↔ Tenant lean methodology
- Overall (STATE)
- 43 Moderately Tenant-Leaning
- State Illinois
- 43 Moderately Tenant-Leaning · D+7
- County
- — inherits STATE
- City
- — inherits STATE
ZIP-level market 61605
- Home prices YoY
- 0.4%
- Active inventory
- 42
- Price-to-rent
- 2.0×
Monthly cashflow live
- Estimated rent
- $956 high interval (Pro) →
- Mortgage (P&I)
- −$118
- Tax from tax record
- −$49 /mo · $583/yr
- Insurance
- −$9
- HOA
- −$0
- Vacancy / Maint / Mgmt
- −$201
- Net cashflow
- $579
Break-even live
Sensitivity live
| Price | -10% $592 | -5% $586 | +0% $579 | +5% $573 | +10% $567 |
|---|---|---|---|---|---|
| Rent | -10% $504 | -5% $542 | +0% $579 | +5% $617 | +10% $655 |
| Rate | -1.0pp $591 | -0.5pp $585 | base $579 | +0.5pp $574 | +1.0pp $568 |
UW: 25.0% down · 7.5% · 30yr · 1.5% tax · 5.0% vac · 8.0% maint · 8.0% mgmt
Financing live
Cash to close
- Down payment
- $5,625
- Closing costs
- $675
- Reserves months
- —
- Total cash needed
- —
Loan-product check · same deal, 3 products live
Conventional
25% down · 7.5% · 30yr
- Down + closing
- —
- Monthly P&I
- —
- Monthly cashflow
- —
- DSCR
- —
- Eligible?
- —
Personal DTI + credit; lowest rate.
DSCR
20% down · 8.5% · 30yr
- Down + closing
- —
- Monthly P&I
- —
- Monthly cashflow
- —
- DSCR
- —
- Eligible?
- —
No personal income docs; deal must DSCR.
Hard money
10% down · 12.0% · 12mo
- Down + closing
- —
- Monthly P&I
- —
- Monthly cashflow
- —
- DSCR
- —
- Eligible?
- —
Short-term bridge; refi at stabilization.
Rent comps 16 comps
| Address | Beds | Baths | Sqft | Rent | $/sqft | DOM | Units | Dist |
|---|---|---|---|---|---|---|---|---|
| 2822 W Antoinette St Peoria, IL | 2.0 | 1.0 | 720 | $1,149 | $1.60 | 22d | 1 | 0.06mi |
| 3001 W Wiswall St Peoria, IL | 2.0 | 1.0 | 1000 | $1,100 | $1.10 | 14d | 1 | 0.30mi |
| 906 S Tonti Cir Peoria, IL | 2.0 | 1.0 | 780 | $950 | $1.22 | 14d | 1 | 0.33mi |
| 3031 W Wiswall St Peoria, IL | 2.0 | 1.0 | 1100 | $1,100 | $1.00 | 14d | 1 | 0.35mi |
| 2320 W Garden St Peoria, IL | 2.0 | 1.0 | 1096 | $1,000 | $0.91 | 44d | 1 | 0.38mi |
| 2116 W Proctor St Peoria, IL | 2.0 | 1.0 | 912 | $879 | $0.96 | 14d | 1 | 0.53mi |
| 1507 S Livingston St Peoria, IL | 2.0 | 1.0 | 842 | $946 | $1.12 | 44d | 1 | 0.58mi |
| 2317 W Martin Luther King Junior Dr Unit 2-214 Peoria, IL | 2.0 | 1.0 | 807 | $800 | $0.99 | 44d | 1 | 0.67mi |
| 2317 W Martin Luther King Junior Dr Peoria, IL | 1.0–2.0 | 1.0 | 697 | $775 | $1.11 | 14d | 3 | 0.68mi |
| 2317 W Martin Luther King Junior Dr Unit 1-106 Peoria, IL | 1.0 | 1.0 | 588 | $775 | $1.32 | 44d | 1 | 0.68mi |
| 1825 S Kneer Ave Peoria, IL | 2.0 | 1.0 | 858 | $858 | $1.00 | 14d | 1 | 0.70mi |
| 2916 W Meidroth St Peoria, IL | 2.0 | 1.0 | 1125 | $1,049 | $0.93 | 22d | 1 | 0.85mi |
| 928 S Matthew St Peoria, IL | 2.0 | 1.0 | 1080 | $748 | $0.69 | 14d | 1 | 0.93mi |
| 945 S Shelley St Peoria, IL | 1.0–3.0 | 1.0–2.0 | 929 | $795 | $0.86 | 14d | 1 | 1.04mi |
| 2807 W Nevada St Peoria, IL | 1.0 | 1.0 | 540 | $629 | $1.16 | 22d | 1 | 1.06mi |
| 1401 W Adrian G Hinton Ave Peoria, IL | 2.0 | 1.0 | 1100 | $775 | $0.70 | 44d | 1 | 1.45mi |
Listing history 5 events
-
2026-03-18status Pending
-
2026-01-31historical
-
2026-01-30$22,500 Active
-
2025-11-14price
-
2025-09-05Active
ⓘ Source: listings_history table (triggers on properties + properties_extension) + one-shot
backfill from property_details.listing_events for pre-trigger history.
Tax reassessment forecast IL · Partial reset (capped growth)
- Current annual tax
- $583 · $49/mo
- Projected year-2 tax
- $583 · $49/mo
- Expected delta
- $0/yr ($0/mo · 0.0%)
ⓘ Screening estimate from a state-policy table — verify with the county assessor before closing.
Climate risk First Street
- Flood 6/10 Major FEMA zone X · 75% chance over 30 yrs
- Wildfire 1/10 Low
- Heat 3/10 Moderate 7 d/yr ≥105°F today · 18 d/yr by 30 yrs out
- Wind 2/10 Low 100% chance of damaging wind over 30 yrs
- Air quality 3/10 Moderate 1 unhealthy d/yr today · 3 by 30 yrs out
Nearby sold comps map
Loading sold comps map…
Walkable amenities ~0.75 mi
Loading nearby amenities…
Taxation est. · year 1
- Rental income
- $11,474
- − Mortgage interest
- −$1,260
- − Property taxes
- −$583
- − Insurance
- −$112
- − Repairs & maintenance
- −$918
- − Management
- −$918
- − Depreciation
- −$655
- Taxable income
- $7,029
- Est. tax owed @ 24.0%
- −$1,687
- After-tax cash flow
- $5,267/yr
For passive investors: Depreciation is non-cash, so a rental often shows a tax loss while cash-flowing — sheltering income. Rental losses are passive: they offset passive income freely, and up to $25,000/yr can offset ordinary (W-2) income if you actively participate and your MAGI is under $100k (phasing out to $0 by $150k); unused losses carry forward. On sale, claimed depreciation is recaptured at up to 25%, and gains may owe capital-gains tax (a 1031 exchange can defer both). Figures are a year-1 estimate at your 24.0% rate — not tax advice; consult a CPA.
Schools (NCES district)
- District
- Peoria SD 150
- NCES district ID
- 1731230
- Math proficiency
- 11% ▼ -5.00%
- Reading proficiency
- 14% ▼ -4.00%
- Median HH income
- $41,951
- Composite
- 10.92/100
- National rank
- #9751
- State rank
- #554 of 620 in IL
Livability — Peoria
- Score
- 73/100
- State rank
- #270
- US rank
- #5096
Category grades
Schools grade is shown separately in the Schools card above.
Census & demographics
- Census place
- Peoria, IL
- County
- Peoria County · 120,495 people
- City population
- 114,670
- Metro
- Peoria, IL
- Population (ZIP)
- 13,424
- Household income
- $26,392
- Rent vs Own
- Severe rent burden
- 1385.0
Population outlook (Peoria County) Hauer SSP2
- Today (2025)
- 183,007 people
- By 2030
- 179,643 · -1.8%
- By 2040
- 171,782 · -6.1%
- By 2050
- 163,508 · -10.7%
- By 2075
- 140,178 · -23.4%
- By 2100
- 114,493 · -37.4%
Race, ethnicity, and origin ACS 2023
- Neighborhood character
- Diverse neighborhood (Simpson 0.61)
- Race & ethnicity
- Black 56% White 27% Hispanic / Latino 12% Two or more races 7% Native American 1%
- Hispanic origin (detail)
- Mexican 8%
- Common ancestry
- Lithuanian 1% Iranian 1% Portuguese 1%
- Foreign-born
- 4% · Canada, Vietnam
- Languages at home
- 92% English-only · Spanish 7%
Political lean MEDSL · Peoria
- 2024 margin
- Toss-up / Even · D 51.5% · R 46.9% · Other 1.6%
- 2008→2024 swing
- -9.2pp toward R · 2008: 13.9pp · 2024: 4.7pp
- All cycles
- 2024: D+4.7 2020: D+6.3 2016: D+2.8 2012: D+4.4 2008: D+13.9
Not yet ingested
- Civics
- —
Market trends
- HPI YoY
- ▲ 0.63%
- Current HPI
- 170.5814
- Rent YoY
- —
- Metro
- Peoria, IL
- State GDP YoY
- ▲ 1.59%
- F500 in state
- 60
Industry mix (Fortune 500 HQ in IL)
| Industry | F500 HQs | Revenue |
|---|---|---|
| Insurance | 4 | $201B |
|
||
| Consumer Goods | 4 | $87B |
|
||
| Industrial Machinery | 3 | $64B |
|
||
| Healthcare | 2 | $55B |
|
||
| Retail / Pharmacy | 1 | $148B |
|
||
| Agriculture / Food | 1 | $86B |
|
||
Price history
5 events — show timeline
- 2026-03-18 Pending — RMLSA as Distributed by MLS Grid
- 2026-01-31 Listing Removed — RMLSA as Distributed by MLS Grid
- 2026-01-30 Listed $22,500 RMLSA as Distributed by MLS Grid
- 2025-11-14 Price Changed — RMLSA as Distributed by MLS Grid
- 2025-09-05 Listed — RMLSA as Distributed by MLS Grid
Property tax history
+1.1%/yrLatest (2024): $583 · +4.8% YoY. Source: county tax records.
Cash-flow waterfall
monthlySold comps — $/sqft
last 12 mo · ≤1 miLoading sold comps…