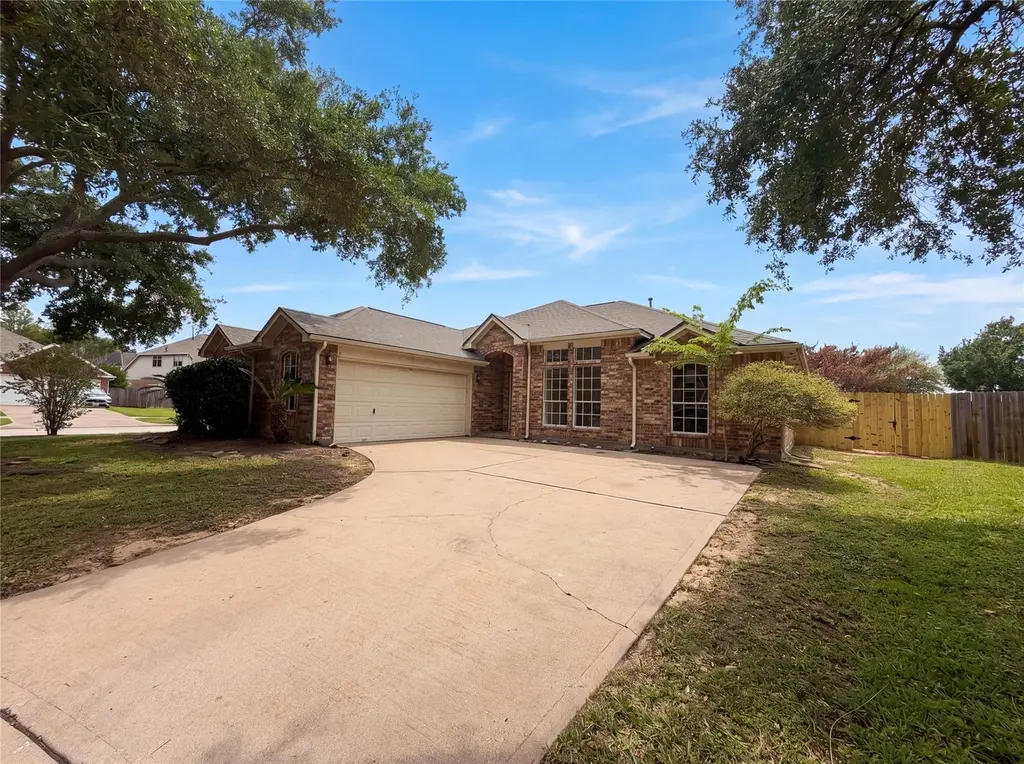
21303 Banks Run Ct · Houston, TX
Flood risk 1/10 · Minimal
- FEMA flood zone
- X (unshaded)
- Chance of flooding over 30 yrs
- 0.0%
- Est. flood insurance / yr
- $507 – $1,088
Fire risk 3/10 · Minor
- Est. fire insurance / yr
- $1,222 – $2,270
Heat risk 9/10 · Severe
- Hot days now (above 110°F)
- 7 days/yr
- Hot days in 30 yrs
- 23 days/yr
Wind risk 8/10 · Major
- Chance of severe wind over 30 yrs
- 99.0%
Air-quality risk 2/10 · Minimal
- Unhealthy air days now
- 2 days/yr
- Unhealthy air days in 30 yrs
- 2 days/yr
Risk factors via First Street. Map © Google.
Why this score? — see what drove the D grade
The composite is a weighted blend of 9 inputs, each scored 0–100. Each bar is that input's sub-score; the figure is the points it added to the 100-point composite (weight × sub-score).
- ARV discount +9.9/15.0
- Cash flow +8.0/30.0
- Schools +5.7/10.0
- Appreciation +4.4/10.0
- 1% rule +3.7/10.0
- Livability +3.7/5.0
- Condition / age +2.5/5.0
- DSCR +2.1/10.0
- Rent growth +1.8/5.0
$265,000
🖨 Deal sheet 📄 Offer letter ✓ Due diligence
Listing remarks
Imagine 21303 Banks Run Ct, recently enhanced with a new roof and a comfortable fireplace. The kitchen is equipped with all stainless steel appliances for streamlined use. The primary bathroom contains double sinks and a separate tub and shower, providing practical amenities. Outside, a covered patio extends to a fenced in backyard, completing the exterior space. This property blends updates and functionality, ready for everyday enjoyment. Included 100-Day Home Warranty with buyer activation
Key facts
- Double sinks
- Covered patio
- New roof
Tags
Neighborhood map
What this means for you Summary
Snapshot
- This is a 4-bed/2.0-bath single-family listed at $265k.
Deal economics
- At list price, monthly cash flow is $-268 ($-3k/yr) — negative.
- To cash-flow at today's rent, offer at most $218k (17.9% below list).
- To meet the 1% rule (rent ≥ 1% of price), the offer needs to be $230k (13.3% below list).
- Recommended offer: $218k (17.9% below list) — sets the bar for cash-flow.
- Cap rate 5.1% vs local median 3.2% in Houston — top-decile yield for the area; either an underpriced asset or a hidden risk that comps aren't pricing in. Stress-test before assuming the spread holds.
Location & tenants
- Location reads 74/100 on livability (#184 in TX, #4,771 nationally) — a middle-class / working-renter tenant base. Strengths: amenities A+, cost of living A+, housing A+; Watch: crime F.
- Katy ISD (suburban): math 61% / reading 63% proficiency, ranked #29 of 826 in TX (top 4%) — acceptable for families but not a draw, mixed tenant base, ~2y average lease.
- Zoned schools: Morton Ranch H S (math 31% / reading 55%, grade F, #713 of 1,632 statewide, top 44%, 2,718 students, 72% FRL) — zoned schools average 72% FRL vs 27% district-wide (45 pts higher); higher-poverty schools than district average — tighter screening recommended.
- Zoned-school proficiency averages 43% at this address vs 62% district-wide (-19 pts) — the specific schools serving this property underperform the Katy ISD average; the district grade overstates school quality for this exact location.
- Market conditions: Rents soft (-2.9%/yr); 744 active listings in the ZIP; 19 comparable units currently listed for rent nearby; rentals at typical pace (median 24d on market — plan ~3-4 weeks tenant-placement turnaround); solid renter incomes; 29,883 units permitted in Harris County in 2024 (8,621 in 5+ unit buildings).
- This rent runs 31% of the median local income ($88k/yr) — at the standard rent-burdened threshold; future hikes will face affordability resistance.
Forward outlook
- Local home prices are declining (-1.3%/yr); year-one equity from $2k of loan paydown is wiped out by about $3k of value loss. Plan a longer hold.
- Harris County population projected at +47% by 2050 — long-run rental-demand tailwind backs the buy-and-hold thesis.
Negotiation context
- Only 10 days on market — expect competitive offers; lowballing is unlikely to land.
- 2 sale attempts since 9y ago with the ask held roughly flat each time — persistent listings suggest the price (not the market) is what's stuck; bring a comps-based counter.
Risks & watch-outs
- Climate carrying-cost: severe wind risk, 99% chance of damaging wind over 30y; extreme-heat days projected 7→23/yr by 2055 (HVAC capex compounding) — expect insurance premiums to compound above CPI over the hold.
Questions for the listing agent
- What do current leases actually rent for vs. the listed asking? Can we see a recent rent roll and the last 12 months of T-12 income?
- What does the HOA fee cover, when was the last increase, and are there any pending special assessments or reserve-fund shortfalls?
- Is there a deadline driving the sale (1031 exchange, divorce, estate, relocation)? That informs how much negotiation room exists.
- Schools are D-rated, which usually means shorter tenancies and higher turnover. Who's the typical renter profile here, and what's been the actual vacancy rate?
- Crime grade is F in this area — have there been break-ins, vandalism, or insurance claims at this property in the last 3 years? What carrier currently insures it and at what premium?
- The area grade is low — what's the realistic commute time and amenity access for the typical tenant pool here? Any planned neighborhood developments (good or bad) we should know about?
- What's the average days-on-market for RENTAL listings here right now (not sales)? A rising rental-DOM trend means longer vacancies and softer asking-rent achievability than the comps imply.
- What's the recent tenant-quality profile in this submarket — average credit score on applications, eviction rate, late-payment / NSF rate, and stable-employment percentage? A property-management company in the area should have these aggregated.
- How much new for-sale + rental construction is in the pipeline within 1–3 miles? Heavy new supply typically softens prices + rents 12–24 months out; constrained supply supports both.
Investment metrics
- 1% rule
- 0.87% ✗
- Cap rate
- 5.08%
- Cash-on-cash
- -4.34%
- DSCR
- 0.81
- GRM
- 9.6
CMA / ARV
- ARV (on-the-fly)
- $280,140
- Comps found
- 12
Show comp detail 12 sales within ~0.75 mi
| Address | Dist | Beds/Ba | Sqft | Sold | Price | $/sf | Match |
|---|---|---|---|---|---|---|---|
| 21303 Banks Run Ct | 0.00mi | 3/2.0 (-1) | 1,920 (-4%) | 1mo | $265,000 | $138 | 88 |
| 21115 Rushing Creek Ln | 0.12mi | 4/2.0 | 1,771 (-12%) | 1mo | $270,000 | $152 | 74 |
| 3930 Brighton Springs Ln | 0.41mi | 4/2.5 | 2,080 (+4%) | 3mo | $235,000 | $113 | 70 |
| 3923 Bridgebay Ln | 0.48mi | 4/2.5 | 1,892 (-5%) | 2mo | $237,000 | $125 | 65 |
| 3638 Bright Moon Ct | 0.29mi | 4/2.5 | 2,225 (+11%) | 3mo | $299,900 | $135 | 64 |
| 21527 Mt Mckinley Way | 0.66mi | 4/2.0 | 1,915 (-4%) | 2mo | $325,000 | $170 | 60 |
| 21363 Bandera Ranch Ln | 0.66mi | 4/2.0 | 1,882 (-6%) | 4mo | $275,000 | $146 | 56 |
| 4006 Mt Everest Way | 0.61mi | 3/2.5 (-1) | 2,100 (+5%) | 4mo | $295,000 | $140 | 53 |
| 20747 Rainmead Dr | 0.67mi | 3/2.0 (-1) | 1,837 (-8%) | 3mo | $259,000 | $141 | 48 |
| 2710 Mustang Hill Ln | 0.72mi | 3/2.0 (-1) | 2,148 (+7%) | 4mo | $295,000 | $137 | 46 |
| 3771 Goldleaf Trail Dr | 0.62mi | 3/2.5 (-1) | 2,247 (+12%) | 2mo | $299,998 | $134 | 42 |
| 3667 Raintree Village Dr | 0.72mi | 3/2.0 (-1) | 1,742 (-13%) | 4mo | $300,000 | $172 | 36 |
Match score weights: distance 35% · size 25% · config 20% · recency 20%. Top-matched comps best support the ARV.
Projected returns pro-forma
-1.27% appreciation · 0.0% rent growth · sell at horizon
- IRR
- -15.5%
- Equity multiple
- 0.37×
- Total profit
- $-46,795
- Equity at exit
- $60,540
- IRR
- -12.2%
- Equity multiple
- 0.06×
- Total profit
- $-69,680
- Equity at exit
- $60,695
Cash invested: $74,200 (down + closing). Projections, not guarantees.
Landlord ↔ Tenant lean methodology
- Overall (STATE)
- 87 Strongly Landlord-Friendly
- State Texas
- 87 Strongly Landlord-Friendly · R+5
- County
- — inherits STATE
- City
- — inherits STATE
ZIP-level market 77449
- Home prices YoY
- -0.5%
- Rents YoY
- -2.9%
- Active inventory
- 744
- Price-to-rent
- 9.6×
Monthly cashflow live
- Estimated rent
- $2,297 high interval (Pro) →
- Mortgage (P&I)
- −$1,390
- Tax from tax record
- −$538 /mo · $6,450/yr
- Insurance
- −$110
- HOA
- −$45
- Vacancy / Maint / Mgmt
- −$482
- Net cashflow
- $-268
Break-even live
UW: 25.0% down · 7.5% · 30yr · 1.5% tax · 5.0% vac · 8.0% maint · 8.0% mgmt
Financing live
Cash to close
- Down payment
- $66,250
- Closing costs
- $7,950
- Reserves months
- —
- Total cash needed
- —
Loan-product check · same deal, 3 products live
Conventional
25% down · 7.5% · 30yr
- Down + closing
- —
- Monthly P&I
- —
- Monthly cashflow
- —
- DSCR
- —
- Eligible?
- —
Personal DTI + credit; lowest rate.
DSCR
20% down · 8.5% · 30yr
- Down + closing
- —
- Monthly P&I
- —
- Monthly cashflow
- —
- DSCR
- —
- Eligible?
- —
No personal income docs; deal must DSCR.
Hard money
10% down · 12.0% · 12mo
- Down + closing
- —
- Monthly P&I
- —
- Monthly cashflow
- —
- DSCR
- —
- Eligible?
- —
Short-term bridge; refi at stabilization.
Rent comps 19 comps
| Address | Beds | Baths | Sqft | Rent | $/sqft | DOM | Units | Dist |
|---|---|---|---|---|---|---|---|---|
| 3507 Banks Run Ln Katy, TX | 3.0 | 2.0 | 1951 | $1,806 | $0.93 | 5d | 1 | 0.18mi |
| 20911 Hazy Bluff Ct Katy, TX | 4.0 | 3.0 | 2940 | $2,450 | $0.83 | 43d | 1 | 0.32mi |
| 20811 Trenton Valley Ln Katy, TX | 4.0 | 3.0 | 2350 | $2,200 | $0.94 | 43d | 1 | 0.48mi |
| 21106 Blackbluff Ct Katy, TX | 4.0 | 2.0 | 1865 | $1,950 | $1.05 | 5d | 1 | 0.53mi |
| 3427 W Rainmill Dr Katy, TX | 3.0 | 2.0 | 1491 | $1,850 | $1.24 | 24d | 1 | 0.67mi |
| 2723 Durham Chase Ln Katy, TX | 4.0 | 2.5 | 2765 | $2,275 | $0.82 | 1d | 1 | 0.68mi |
| 21402 Doral Rose Ln Katy, TX | 3.0 | 2.0 | 1864 | $1,950 | $1.05 | 24d | 1 | 0.74mi |
| 3837 Banks Ridge Ln Katy, TX | 3.0 | 2.0 | 1658 | $2,350 | $1.42 | 43d | 1 | 0.90mi |
| 21622 Stonecross Terrace Ln Katy, TX | 3.0 | 2.0 | 1778 | $2,050 | $1.15 | 24d | 1 | 0.96mi |
| 3130 Birchleaf Dr Katy, TX | 3.0 | 2.0 | 1700 | $1,840 | $1.08 | 43d | 1 | 0.99mi |
| 21919 Clay Rd Unit 3047 Katy, TX | 3.0 | 2.0 | 1608 | $2,235 | $1.39 | 11d | 1 | 1.02mi |
| 21919 Clay Rd Unit 21952 Katy, TX | 3.0 | 2.0 | 1608 | $2,192 | $1.36 | 2d | 1 | 1.04mi |
| 4211 Fair Country Ln Katy, TX | 4.0 | 3.0 | 2342 | $2,275 | $0.97 | 24d | 1 | 1.07mi |
| 20722 Iron Timber Ln Katy, TX | 4.0 | 2.5 | 2785 | $2,600 | $0.93 | 22d | 1 | 1.10mi |
| 21919 Clay Rd Katy, TX | 3.0 | 2.5 | 1658 | $3,574 | $2.16 | 1d | 1 | 1.10mi |
| 4535 Medrano Trl Katy, TX | 4.0 | 3.0 | 2657 | $2,600 | $0.98 | 43d | 1 | 1.23mi |
| 4542 Medrano Trl Katy, TX | 5.0 | 4.0 | 2797 | $3,500 | $1.25 | 43d | 1 | 1.27mi |
| 2919 Amber Cliff Dr Katy, TX | 3.0 | 2.0 | 1526 | $1,900 | $1.25 | 43d | 1 | 1.43mi |
| 20102 Twilight Canyon Rd Katy, TX | 4.0 | 2.5 | 1633 | $3,395 | $2.08 | 2d | 1 | 1.47mi |
HOA detail
- Monthly dues
- $45 · $540/yr
Listing history 6 events
-
2026-04-26status Pending
-
2026-04-16$265,000 Active
-
2026-03-13soldstatus
-
2017-11-19historical
-
2017-07-29$190,000 Active
-
2002-08-09soldstatus
ⓘ Source: listings_history table (triggers on properties + properties_extension) + one-shot
backfill from property_details.listing_events for pre-trigger history.
Tax reassessment forecast TX · Resets to sale price
- Current annual tax
- $6,450 · $538/mo
- Projected year-2 tax
- $6,450 · $538/mo
- Expected delta
- $0/yr ($0/mo · 0.0%)
ⓘ Screening estimate from a state-policy table — verify with the county assessor before closing.
Climate risk First Street
- Flood 1/10 Low FEMA zone X (unshaded) · 0% chance over 30 yrs
- Wildfire 3/10 Moderate
- Heat 9/10 Extreme 7 d/yr ≥110°F today · 23 d/yr by 30 yrs out
- Wind 8/10 Severe 99% chance of damaging wind over 30 yrs
- Air quality 2/10 Low 2 unhealthy d/yr today · 2 by 30 yrs out
Nearby sold comps map
Loading sold comps map…
Walkable amenities ~0.75 mi
Loading nearby amenities…
Taxation est. · year 1
- Rental income
- $27,562
- − Mortgage interest
- −$14,844
- − Property taxes
- −$6,450
- − Insurance
- −$1,325
- − Repairs & maintenance
- −$2,205
- − Management
- −$2,205
- − HOA
- −$540
- − Depreciation
- −$7,709
- Taxable loss
- −$7,716
- Est. tax savings @ 24.0%
- +$1,852
- After-tax cash flow
- $-1,366/yr
For passive investors: Depreciation is non-cash, so a rental often shows a tax loss while cash-flowing — sheltering income. Rental losses are passive: they offset passive income freely, and up to $25,000/yr can offset ordinary (W-2) income if you actively participate and your MAGI is under $100k (phasing out to $0 by $150k); unused losses carry forward. On sale, claimed depreciation is recaptured at up to 25%, and gains may owe capital-gains tax (a 1031 exchange can defer both). Figures are a year-1 estimate at your 24.0% rate — not tax advice; consult a CPA.
Schools (NCES district)
- District
- Katy ISD
- NCES district ID
- 4825170
- Math proficiency
- 61% ▼ -7.00%
- Reading proficiency
- 63% ▼ -3.00%
- Median HH income
- $90,312
- Composite
- 56.59/100
- National rank
- #1146
- State rank
- #29 of 826 in TX
Livability — Houston
- Score
- 74/100
- State rank
- #184
- US rank
- #4771
Category grades
Schools grade is shown separately in the Schools card above.
Census & demographics
- County
- Harris County · 4,702,590 people
- City population
- 3,226,434
- Metro
- Houston-The Woodlands-Sugar Land, TX
- Population (ZIP)
- 130,028
- Household income
- $87,808
- Rent vs Own
- Severe rent burden
- 3088.0
Population outlook (Harris County) Hauer SSP2
- Today (2025)
- 5,571,493 people
- By 2030
- 6,089,821 · +9.3%
- By 2040
- 7,142,806 · +28.2%
- By 2050
- 8,185,864 · +46.9%
- By 2075
- 10,574,329 · +89.8%
- By 2100
- 12,109,958 · +117.4%
Race, ethnicity, and origin ACS 2023
- Neighborhood character
- Diverse neighborhood (Simpson 0.68)
- Race & ethnicity
- Hispanic / Latino 49% Two or more races 22% Black 20% White 19% Asian 6%
- Hispanic origin (detail)
- Mexican 26% Puerto Rican 1% Cuban 4%
- Common ancestry
- Lithuanian 1% Italian 1%
- Foreign-born
- 32% · Canada, Jamaica, Vietnam
- Languages at home
- 48% English-only · Spanish 40% Other Indo-European 3% Vietnamese 1%
Political lean MEDSL · Harris
- 2024 margin
- Lean D (+5.5) · D 52.0% · R 46.4% · Other 1.6%
- 2008→2024 swing
- +3.9pp toward D · 2008: 1.6pp · 2024: 5.5pp
- All cycles
- 2024: D+5.5 2020: D+13.3 2016: D+12.4 2012: D+0.1 2008: D+1.6
Not yet ingested
- Civics
- —
Market trends
- HPI YoY
- ▼ -1.27%
- Current HPI
- 254.6622
- Rent YoY
- ▼ -2.86%
- Metro
- Houston-The Woodlands-Sugar Land, TX
- State GDP YoY
- ▲ 3.95%
- F500 in state
- 110
Industry mix (Fortune 500 HQ in TX)
| Industry | F500 HQs | Revenue |
|---|---|---|
| Energy | 16 | $1,198B |
|
||
| Technology | 5 | $198B |
|
||
| Engineering / Construction | 4 | $72B |
|
||
| Energy Services | 3 | $60B |
|
||
| Utilities | 3 | $41B |
|
||
| Healthcare | 2 | $330B |
|
||
Price history
+39.5% since first listed6 events — show timeline
- 2026-04-26 Pending — HARMLS
- 2026-04-16 Listed $265,000 HARMLS
- 2026-03-13 Sold (Public Records) — Public Records
- 2017-11-19 Listing Removed — HARMLS
- 2017-07-29 Listed $190,000 HARMLS
- 2002-08-09 Sold (Public Records) — Public Records
Property tax history
+7.1%/yrLatest (2025): $6,450 · -4.6% YoY. Source: county tax records.
Cash-flow waterfall
monthlySold comps — $/sqft
last 12 mo · ≤1 miLoading sold comps…