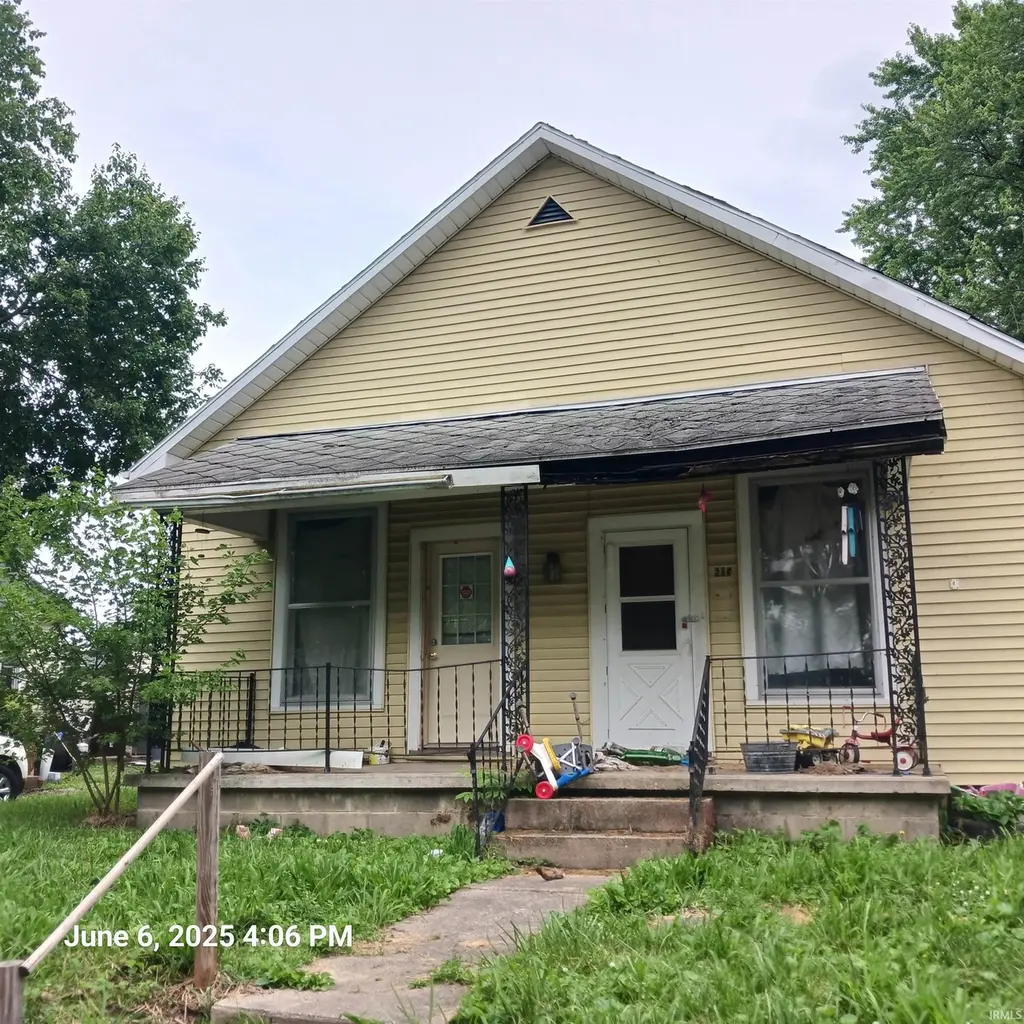
605 N Columbia St · Brazil, IN
Flood risk 1/10 · Minimal
- FEMA flood zone
- X (unshaded)
- Chance of flooding over 30 yrs
- 0.0%
- Est. flood insurance / yr
- $473 – $860
Fire risk 1/10 · Minimal
- Est. fire insurance / yr
- $717 – $1,331
Heat risk 4/10 · Minor
- Hot days now (above 104°F)
- 7 days/yr
- Hot days in 30 yrs
- 18 days/yr
Wind risk 2/10 · Minimal
- Chance of severe wind over 30 yrs
- 1.0%
Air-quality risk 2/10 · Minimal
- Unhealthy air days now
- 1 days/yr
- Unhealthy air days in 30 yrs
- 1 days/yr
Risk factors via First Street. Map © Google.
Why this score? — see what drove the B- grade
The composite is a weighted blend of 9 inputs, each scored 0–100. Each bar is that input's sub-score; the figure is the points it added to the 100-point composite (weight × sub-score).
- Cash flow +30.0/30.0
- 1% rule +10.0/10.0
- DSCR +10.0/10.0
- ARV discount +7.5/15.0
- Schools +4.0/10.0
- Livability +3.3/5.0
- Rent growth +2.5/5.0
- Condition / age +2.5/5.0
- Appreciation +0.0/10.0
$36,500
🖨 Deal sheet (PDF) 📄 Offer letter ✓ Due diligence
Listing remarks MLS
Heat and air conditioning unknown. Land is elevated from the road, then level. For privacy in 2nd bedroom, door needs added to arched entry.
Key facts
- 7,841 sq ft lot
- Garage
- Built 1900
Neighborhood map
What this means for you Summary
Snapshot
- This is a 3-bed/1.0-bath single-family listed at $36k.
Deal economics
- At list price, monthly cash flow is $432 ($5k/yr) — positive.
- The deal already cash-flows at list — no discount required.
- Meets the 1% rule at list price ($890 rent vs $36k).
- Recommended offer: $32k (12.0% below list) — sets the bar for market timing.
- Cap rate 20.5% vs local median 2.6% in Brazil — top-decile yield for the area; either an underpriced asset or a hidden risk that comps aren't pricing in. Stress-test before assuming the spread holds.
Location & tenants
- Location reads 66/100 on livability (#308 in IN) — a middle-class / working-renter tenant base. Strengths: cost of living A+, housing A+, health & safety A+; Watch: crime F, amenities F, commute F.
- Clay Community Schools (rural): math 46% / reading 49% proficiency, ranked #79 of 301 in IN (top 26%) — families likely to look elsewhere, expect single-tenant / working-renter base with shorter leases.
- Zoned schools: Clay City Elementary School (math 58% / reading 54%, grade C+, #183 of 994 statewide, top 19%, 377 students, 51% FRL); North Clay Middle School (math 42% / reading 47%, grade D, #84 of 330 statewide, top 26%, 744 students, 57% FRL); Northview High School (math 43% / reading 66%, grade C-, #79 of 369 statewide, top 26%, 943 students, 46% FRL).
- Market conditions: 95 active listings in the ZIP; 70 units permitted in Clay County in 2024 (0 in 5+ unit buildings).
Forward outlook
- Local home prices are declining (-3.0%/yr); year-one equity from $252 of loan paydown is wiped out by about $1k of value loss. Plan a longer hold.
- Clay County population projected at -16% by 2050 — secular population decline; favor cash flow + early exit over multi-decade hold.
- At projected returns (-3.0% appreciation + 3.0% rent growth), your $10k cash investment doubles in ~3 years — after that, you're playing with house money.
Negotiation context
- It's been on market 189 days — a 12% lower offer ($32k) is reasonable based on typical stale-listing flexibility.
- 6 sale attempts since 23y ago with the ask held roughly flat each time — persistent listings suggest the price (not the market) is what's stuck; bring a comps-based counter.
Risks & watch-outs
- Watch-outs: built in 1900 — expect roof / HVAC / electrical / plumbing capex.
Questions for the listing agent
- It's been on market 189 days. Have you received any prior offers? Is the seller open to a 12% concession, seller financing, or rate buy-down credit?
- Built in 1900 — when were the roof, HVAC, electrical panel, plumbing, and water heater last replaced?
- Why hasn't it sold? Are there any deal-killer items the seller is aware of (foundation, flood, title, zoning, code violations)?
- Is there a deadline driving the sale (1031 exchange, divorce, estate, relocation)? That informs how much negotiation room exists.
- Crime grade is F in this area — have there been break-ins, vandalism, or insurance claims at this property in the last 3 years? What carrier currently insures it and at what premium?
- What's the average days-on-market for RENTAL listings here right now (not sales)? A rising rental-DOM trend means longer vacancies and softer asking-rent achievability than the comps imply.
- What's the recent tenant-quality profile in this submarket — average credit score on applications, eviction rate, late-payment / NSF rate, and stable-employment percentage? A property-management company in the area should have these aggregated.
- How much new for-sale + rental construction is in the pipeline within 1–3 miles? Heavy new supply typically softens prices + rents 12–24 months out; constrained supply supports both.
Investment metrics
- 1% rule
- 2.44% ✓
- Cap rate
- 20.48%
- Cash-on-cash
- 50.67%
- DSCR
- 3.25
- GRM
- 3.4
CMA / ARV
- ARV (median comp)
- $151,687
- List price
- $36,500
- Delta
- -75.94%
- Verdict
- UNDERPRICED
- Comps
- 20 within 1.0 mi
Show comp detail 12 sales within ~0.75 mi
| Address | Dist | Beds/Ba | Sqft | Sold | Price | $/sf | Match |
|---|---|---|---|---|---|---|---|
| 341 E Coal St | 0.30mi | 2/1.0 (-1) | 1,188 (+1%) | 4mo | $124,900 | $105 | 76 |
| 328 E Georgia St | 0.29mi | 3/2.0 | 1,120 (-5%) | 1mo | $97,000 | $87 | 74 |
| 410 E Illinois St | 0.23mi | 2/1.0 (-1) | 1,107 (-6%) | 2mo | $175,000 | $158 | 72 |
| 321 E Coal St | 0.34mi | 3/1.0 | 1,236 (+5%) | 4mo | $69,000 | $56 | 72 |
| 940 N Washington St | 0.52mi | 3/1.5 | 1,153 (-2%) | 2mo | $172,500 | $150 | 69 |
| 817 N Washington St | 0.46mi | 3/1.0 | 1,144 (-3%) | 7mo | $71,500 | $63 | 68 |
| 409 N Columbia St | 0.10mi | 3/2.0 | 1,018 (-13%) | 2mo | $165,000 | $162 | 67 |
| 803 N Forest Ave | 0.34mi | 3/1.0 | 1,060 (-10%) | 3mo | $61,500 | $58 | 66 |
| 723 N Washington St | 0.45mi | 2/1.0 (-1) | 1,144 (-3%) | 5mo | $145,000 | $127 | 65 |
| 205 N Columbia St | 0.25mi | 3/2.0 | 1,292 (+10%) | 5mo | $219,900 | $170 | 63 |
| 105 Willow Ct | 0.73mi | 3/1.0 | 1,164 (-1%) | 2mo | $139,900 | $120 | 63 |
| 135 N Davis St | 0.29mi | 2/1.0 (-1) | 1,032 (-12%) | 7mo | $155,000 | $150 | 55 |
Match score weights: distance 35% · size 25% · config 20% · recency 20%. Top-matched comps best support the ARV.
Projected returns pro-forma
-3.0% appreciation · 3.0% rent growth · sell at horizon
- IRR
- 48.5%
- Equity multiple
- 3.11×
- Total profit
- $21,597
- Equity at exit
- $5,442
- IRR
- 54.1%
- Equity multiple
- 6.31×
- Total profit
- $54,303
- Equity at exit
- $3,156
Cash invested: $10,220 (down + closing). Projections, not guarantees.
Landlord ↔ Tenant lean methodology
- Overall (STATE)
- 90 Strongly Landlord-Friendly
- State Indiana
- 90 Strongly Landlord-Friendly · R+11
- County
- — inherits STATE
- City
- — inherits STATE
ZIP-level market 47834
- Home prices YoY
- -20.8%
- Active inventory
- 95
- Price-to-rent
- 3.4×
Monthly cashflow live
- Estimated rent
- $890 medium interval (Pro) →
- Mortgage (P&I)
- −$191
- Tax from tax record
- −$65 /mo · $783/yr
- Insurance
- −$15
- HOA
- −$0
- Vacancy / Maint / Mgmt
- −$187
- Net cashflow
- $432
Break-even live
Sensitivity live
| Price | -10% $452 | -5% $442 | +0% $432 | +5% $421 | +10% $411 |
|---|---|---|---|---|---|
| Rent | -10% $361 | -5% $396 | +0% $432 | +5% $467 | +10% $502 |
| Rate | -1.0pp $450 | -0.5pp $441 | base $432 | +0.5pp $422 | +1.0pp $412 |
UW: 25.0% down · 7.5% · 30yr · 1.5% tax · 5.0% vac · 8.0% maint · 8.0% mgmt
Financing live
Cash to close
- Down payment
- $9,125
- Closing costs
- $1,095
- Reserves months
- —
- Total cash needed
- —
Loan-product check · same deal, 3 products live
Conventional
25% down · 7.5% · 30yr
- Down + closing
- —
- Monthly P&I
- —
- Monthly cashflow
- —
- DSCR
- —
- Eligible?
- —
Personal DTI + credit; lowest rate.
DSCR
20% down · 8.5% · 30yr
- Down + closing
- —
- Monthly P&I
- —
- Monthly cashflow
- —
- DSCR
- —
- Eligible?
- —
No personal income docs; deal must DSCR.
Hard money
10% down · 12.0% · 12mo
- Down + closing
- —
- Monthly P&I
- —
- Monthly cashflow
- —
- DSCR
- —
- Eligible?
- —
Short-term bridge; refi at stabilization.
Listing history 26 events
-
2026-06-19days on market $36,500 Active 189 DOM
-
2026-06-18days on market $36,500 Active 188 DOM
-
2026-06-17days on market $36,500 Active 187 DOM
-
2026-06-16days on market $36,500 Active 186 DOM
-
2026-06-15days on market $36,500 Active 185 DOM
-
2026-06-14days on market $36,500 Active 183 DOM
-
2026-06-13days on market $36,500 Active 182 DOM
-
2026-06-10days on market $36,500 Active 180 DOM
-
2026-06-09days on market $36,500 Active 179 DOM
-
2026-06-08days on market $36,500 Active 178 DOM
-
2026-06-07days on market $36,500 Active 177 DOM
-
2026-06-05days on market $36,500 Active 174 DOM
-
2026-06-02days on market $36,500 Active 172 DOM
-
2026-06-01days on market $36,500 Active 171 DOM
-
2026-05-31days on market $36,500 Active 170 DOM
-
2026-05-30days on market $36,500 Active 169 DOM
-
2026-01-12status Active 140-char remark
Show marketing remark (140 chars)
Heat and air conditioning unknown. Land is elevated from the road, then level. For privacy in 2nd bedroom, door needs added to arched entry.
-
2025-09-26status Pending 140-char remark
Show marketing remark (140 chars)
Heat and air conditioning unknown. Land is elevated from the road, then level. For privacy in 2nd bedroom, door needs added to arched entry.
-
2025-08-26$36,500 Active 140-char remark
Show marketing remark (140 chars)
Heat and air conditioning unknown. Land is elevated from the road, then level. For privacy in 2nd bedroom, door needs added to arched entry.
-
2010-01-18historical
-
2009-07-18$62,500
-
2009-03-13historical
-
2008-12-13historical
-
2008-06-13$48,000
-
2008-01-10$61,500
-
2003-01-01$57,500
ⓘ Source: listings_history table (triggers on properties + properties_extension) + one-shot
backfill from property_details.listing_events for pre-trigger history.
Tax reassessment forecast IN · Partial reset (capped growth)
- Current annual tax
- $783 · $65/mo
- Projected year-2 tax
- $783 · $65/mo
- Expected delta
- $0/yr ($0/mo · 0.0%)
ⓘ Screening estimate from a state-policy table — verify with the county assessor before closing.
Climate risk First Street
- Flood 1/10 Low FEMA zone X (unshaded) · 0% chance over 30 yrs
- Wildfire 1/10 Low
- Heat 4/10 Moderate 7 d/yr ≥104°F today · 18 d/yr by 30 yrs out
- Wind 2/10 Low 100% chance of damaging wind over 30 yrs
- Air quality 2/10 Low 1 unhealthy d/yr today · 1 by 30 yrs out
Nearby sold comps map
Loading sold comps map…
Walkable amenities ~0.75 mi
Loading nearby amenities…
Taxation est. · year 1
- Rental income
- $10,685
- − Mortgage interest
- −$2,045
- − Property taxes
- −$783
- − Insurance
- −$182
- − Repairs & maintenance
- −$855
- − Management
- −$855
- − Depreciation
- −$1,062
- Taxable income
- $4,904
- Est. tax owed @ 24.0%
- −$1,177
- After-tax cash flow
- $4,002/yr
For passive investors: Depreciation is non-cash, so a rental often shows a tax loss while cash-flowing — sheltering income. Rental losses are passive: they offset passive income freely, and up to $25,000/yr can offset ordinary (W-2) income if you actively participate and your MAGI is under $100k (phasing out to $0 by $150k); unused losses carry forward. On sale, claimed depreciation is recaptured at up to 25%, and gains may owe capital-gains tax (a 1031 exchange can defer both). Figures are a year-1 estimate at your 24.0% rate — not tax advice; consult a CPA.
Schools (NCES district)
- District
- Clay Community Schools
- NCES district ID
- 1800840
- Math proficiency
- 46% ▼ -6.00%
- Reading proficiency
- 49% ▼ -1.00%
- Median HH income
- $46,673
- Composite
- 40.39/100
- National rank
- #3733
- State rank
- #79 of 301 in IN
Livability — Brazil
- Score
- 66/100
- State rank
- #308
- US rank
- #12163
Category grades
Schools grade is shown separately in the Schools card above.
Census & demographics
- Census place
- Brazil, IN
- City population
- 18,773
- Population (ZIP)
- 18,773
Population outlook (Clay County) Hauer SSP2
- Today (2025)
- 25,820 people
- By 2030
- 25,182 · -2.5%
- By 2040
- 23,562 · -8.7%
- By 2050
- 21,829 · -15.5%
- By 2075
- 17,939 · -30.5%
- By 2100
- 14,042 · -45.6%
Race, ethnicity, and origin ACS 2023
- Neighborhood character
- Predominantly White (94%)
- Race & ethnicity
- White 94% Two or more races 4% Hispanic / Latino 2%
- Common ancestry
- Slovak 1% Iranian 1% Italian 1%
- Foreign-born
- 1% · Canada, Jamaica
- Languages at home
- 99% English-only · Spanish 1%
Political lean MEDSL · Clay
- 2024 margin
- Solid R (+56.9) · D 20.7% · R 77.6% · Other 1.7%
- 2008→2024 swing
- -45.4pp toward R · 2008: -11.5pp · 2024: -56.9pp
- All cycles
- 2024: R+56.9 2020: R+56.6 2016: R+55.3 2012: R+31.4 2008: R+11.5
Not yet ingested
- Civics
- —
Market trends
- HPI YoY
- ▼ -58.68%
- Current HPI
- 223.6707
- Rent YoY
- —
- Metro
- —
- State GDP YoY
- ▲ 2.90%
- F500 in state
- 18
Industry mix (Fortune 500 HQ in IN)
| Industry | F500 HQs | Revenue |
|---|---|---|
| Industrial Machinery | 2 | $37B |
|
||
| Healthcare | 1 | $177B |
|
||
| Pharmaceuticals | 1 | $45B |
|
||
| Metals / Steel | 1 | $18B |
|
||
| Agriculture | 1 | $17B |
|
||
| Packaging | 1 | $12B |
|
||
Price history
-36.5% since first listed10 events — show timeline
- 2026-01-12 Relisted — IRMLS
- 2025-09-26 Pending — IRMLS
- 2025-08-26 Listed $36,500 IRMLS
- 2010-01-18 Listing Removed — MIBOR as Distributed by MLS Grid
- 2009-07-18 Listed $62,500 MIBOR as Distributed by MLS Grid
- 2009-03-13 Listing Removed — MIBOR as Distributed by MLS Grid
- 2008-12-13 Listing Removed — MIBOR as Distributed by MLS Grid
- 2008-06-13 Listed $48,000 MIBOR as Distributed by MLS Grid
- 2008-01-10 Listed $61,500 MIBOR as Distributed by MLS Grid
- 2003-01-01 Listed $57,500 MIBOR as Distributed by MLS Grid
Property tax history
-4.3%/yrLatest (2024): $783 · +20.7% YoY. Source: county tax records.
Cash-flow waterfall
monthlySold comps — $/sqft
last 12 mo · ≤1 miLoading sold comps…