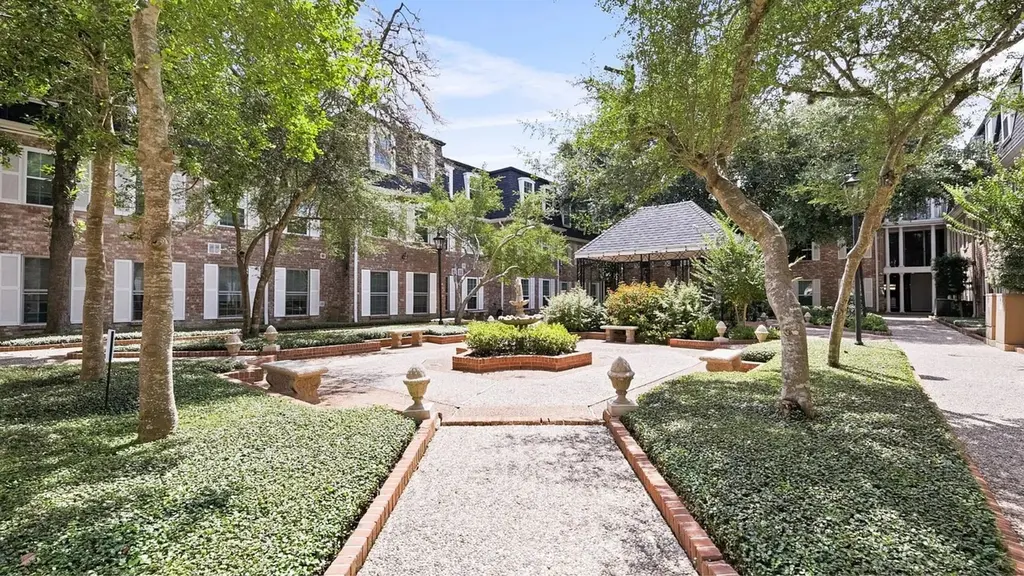
361 N Post Oak Ln #341 · Houston, TX
Flood risk 7/10 · Major
- FEMA flood zone
- X (unshaded)
- Chance of flooding over 30 yrs
- 0.99%
- Est. flood insurance / yr
- $507 – $1,088
Fire risk 1/10 · Minimal
- Est. fire insurance / yr
- $1,222 – $2,270
Heat risk 9/10 · Severe
- Hot days now (above 109°F)
- 7 days/yr
- Hot days in 30 yrs
- 24 days/yr
Wind risk 9/10 · Severe
- Chance of severe wind over 30 yrs
- 99.0%
Air-quality risk 3/10 · Minor
- Unhealthy air days now
- 3 days/yr
- Unhealthy air days in 30 yrs
- 3 days/yr
Risk factors via First Street. Map © Google.
Why this score? — see what drove the D grade
The composite is a weighted blend of 9 inputs, each scored 0–100. Each bar is that input's sub-score; the figure is the points it added to the 100-point composite (weight × sub-score).
- ARV discount +9.9/15.0
- Appreciation +8.5/10.0
- 1% rule +5.9/10.0
- Schools +4.1/10.0
- Rent growth +3.7/5.0
- Livability +3.7/5.0
- Cash flow +3.0/30.0
- Condition / age +2.5/5.0
- DSCR +0.0/10.0
$166,000
🖨 Deal sheet 📄 Offer letter ✓ Due diligence
Listing remarks MLS
Location location location! Zoned to Hunters Creek Elementary / Spring Branch MS / Memorial HS. Ideally located near Memorial Park, top dining and shopping, The Galleria, and major freeways. The MAINTENANCE FEE COVERS ALL UTILITIES, parking, security, two courtyards, a beautiful pool, and a wide range of amenities. Welcome to this 2-bedroom, 2-bath condo on the TOP FLOOR! Turnkey, stylish, and thoughtfully remodeled. Just minutes from the Galleria and Uptown park. Close to the pool and allows pets.
Key facts
- Zoned to memorial hs
- $677 HOA
- Parking
Tags
Neighborhood map
What this means for you Summary
Snapshot
- This is a 2-bed/2.0-bath condo listed at $166k.
Deal economics
- At list price, monthly cash flow is $-608 ($-7k/yr) — negative.
- To cash-flow at today's rent, offer at most $86k (48.3% below list).
- Meets the 1% rule at list price ($2k rent vs $166k).
- Recommended offer: $86k (48.3% below list) — sets the bar for cash-flow.
- Cap rate 2.4% vs local median 3.2% in Houston — below-typical yield; the buyer is paying a premium for something (appreciation thesis, condition, location) that the cap rate doesn't capture.
Location & tenants
- Location reads 74/100 on livability (#184 in TX, #4,771 nationally) — a middle-class / working-renter tenant base. Strengths: amenities A+, cost of living A+, housing A+; Watch: schools D, crime F.
- Spring Branch ISD (urban): math 47% / reading 46% proficiency, ranked #215 of 826 in TX (top 26%) — families likely to look elsewhere, expect single-tenant / working-renter base with shorter leases.
- Market conditions: Rents rising fast (+5.0%/yr); 310 active listings in the ZIP; 40 comparable units currently listed for rent nearby; rentals leasing fast (median 11d on market — plan ~1-2 weeks tenant-placement turnaround); high-income renter base; 29,883 units permitted in Harris County in 2024 (8,621 in 5+ unit buildings).
- This rent is only 16% of the median local income ($136k/yr) — well below the 30% rent-burden line; pricing power to push rent on renewal without tenant pushback.
Forward outlook
- In year one you build about $13k of equity ($1k loan paydown + $11k appreciation (6.9% local appreciation)).
- Harris County population projected at +47% by 2050 — long-run rental-demand tailwind backs the buy-and-hold thesis.
- By year 3, paydown + projected appreciation supports a ~$31k cash-out refi (75% LTV) — recoverable capital for the next deal without selling this one.
Negotiation context
- It's been on market 66 days — a 6% lower offer ($156k) is reasonable based on typical stale-listing flexibility.
- 17 sale attempts since 12y ago; this cycle's ask has dropped $13k (7%) from the opening price — seller is motivated, your offer sets the floor, not the list.
- Current owner paid $68k; list at $166k implies a 144% gain — meaningful room to come down on a strong offer.
Risks & watch-outs
- Watch-outs: property tax is 2.6% of price; flood insurance adds $66/mo; HOA is 37% of rent.
- Climate carrying-cost: major flood risk; severe wind risk, 99% chance of damaging wind over 30y; extreme-heat days projected 7→24/yr by 2055 (HVAC capex compounding) — expect insurance premiums to compound above CPI over the hold.
Questions for the listing agent
- What do current leases actually rent for vs. the listed asking? Can we see a recent rent roll and the last 12 months of T-12 income?
- It's been on market 66 days. Have you received any prior offers? Is the seller open to a 48% concession, seller financing, or rate buy-down credit?
- Built in 1970 — when were the roof, HVAC, electrical panel, plumbing, and water heater last replaced?
- Property tax is high relative to price — has the assessment been appealed recently, and will the sale trigger a re-assessment?
- What's the actual annual flood-insurance premium (NFIP or private), and is the property in a SFHA with mandatory coverage?
- What does the HOA fee cover, when was the last increase, and are there any pending special assessments or reserve-fund shortfalls?
- Any open or pending special assessments — roof, HVAC, plumbing, elevator, façade? What's the per-unit balance and payoff schedule, and is the seller paying it off at close or rolling it to the buyer?
- Why hasn't it sold? Are there any deal-killer items the seller is aware of (foundation, flood, title, zoning, code violations)?
- Is there a deadline driving the sale (1031 exchange, divorce, estate, relocation)? That informs how much negotiation room exists.
- Schools are D-rated, which usually means shorter tenancies and higher turnover. Who's the typical renter profile here, and what's been the actual vacancy rate?
- Crime grade is F in this area — have there been break-ins, vandalism, or insurance claims at this property in the last 3 years? What carrier currently insures it and at what premium?
- The area grade is low — what's the realistic commute time and amenity access for the typical tenant pool here? Any planned neighborhood developments (good or bad) we should know about?
- What's the average days-on-market for RENTAL listings here right now (not sales)? A rising rental-DOM trend means longer vacancies and softer asking-rent achievability than the comps imply.
- What's the recent tenant-quality profile in this submarket — average credit score on applications, eviction rate, late-payment / NSF rate, and stable-employment percentage? A property-management company in the area should have these aggregated.
- How much new apartment / multifamily construction is in the pipeline within 1–3 miles? Heavy new supply (>2% of stock underway) typically softens rents 12–24 months out; light construction supports rent growth.
Investment metrics
- 1% rule
- 1.09% ✓
- Cap rate
- 2.38%
- Cash-on-cash
- -13.97%
- DSCR
- 0.38
- GRM
- 7.6
CMA / ARV
- ARV (median comp)
- $175,454
- List price
- $166,000
- Delta
- -5.39%
- Verdict
- FAIR
- Comps
- 20 within 1.0 mi
Projected returns pro-forma
6.92% appreciation · 4.96% rent growth · sell at horizon
- IRR
- 6.7%
- Equity multiple
- 1.49×
- Total profit
- $22,681
- Equity at exit
- $114,175
- IRR
- 9.7%
- Equity multiple
- 3.24×
- Total profit
- $104,288
- Equity at exit
- $216,109
Cash invested: $46,480 (down + closing). Projections, not guarantees.
Landlord ↔ Tenant lean methodology
- Overall (STATE)
- 87 Strongly Landlord-Friendly
- State Texas
- 87 Strongly Landlord-Friendly · R+5
- County
- — inherits STATE
- City
- — inherits STATE
ZIP-level market 77024
- Home prices YoY
- 2.8%
- Rents YoY
- 5.0%
- Active inventory
- 310
- Price-to-rent
- 7.6×
Monthly cashflow live
- Estimated rent
- $1,814 high interval (Pro) →
- Mortgage (P&I)
- −$871
- Tax from tax record
- −$358 /mo · $4,292/yr
- Insurance
- −$69
- Flood insurance flood zone
- −$66 /mo · $798/yr
- HOA
- −$677
- Vacancy / Maint / Mgmt
- −$381
- Net cashflow
- $-608
Break-even live
UW: 25.0% down · 7.5% · 30yr · 1.5% tax · 5.0% vac · 8.0% maint · 8.0% mgmt
Financing live
Cash to close
- Down payment
- $41,500
- Closing costs
- $4,980
- Reserves months
- —
- Total cash needed
- —
Loan-product check · same deal, 3 products live
Conventional
25% down · 7.5% · 30yr
- Down + closing
- —
- Monthly P&I
- —
- Monthly cashflow
- —
- DSCR
- —
- Eligible?
- —
Personal DTI + credit; lowest rate.
DSCR
20% down · 8.5% · 30yr
- Down + closing
- —
- Monthly P&I
- —
- Monthly cashflow
- —
- DSCR
- —
- Eligible?
- —
No personal income docs; deal must DSCR.
Hard money
10% down · 12.0% · 12mo
- Down + closing
- —
- Monthly P&I
- —
- Monthly cashflow
- —
- DSCR
- —
- Eligible?
- —
Short-term bridge; refi at stabilization.
Rent comps 40 comps
| Address | Beds | Baths | Sqft | Rent | $/sqft | DOM | Units | Dist |
|---|---|---|---|---|---|---|---|---|
| 499 Carnarvon Dr Houston, TX | 2.0 | 2.0 | 1171 | $1,856 | $1.58 | 24d | 1 | 0.21mi |
| 106 N Post Oak Ln Houston, TX | 1.0 | 1.0 | 963 | $1,830 | $1.90 | 24d | 1 | 0.55mi |
| 106 N Post Oak Ln Houston, TX | 2.0 | 2.0 | 1171 | $2,084 | $1.78 | 43d | 1 | 0.55mi |
| 106 N Post Oak Ln Houston, TX | 2.0 | 2.0 | 1171 | $2,084 | $1.78 | 20d | 1 | 0.55mi |
| 99 N Post Oak Ln Houston, TX | 1.0–3.0 | 1.0–2.0 | 1252 | $2,277 | $1.82 | 2d | 14 | 0.61mi |
| 7105 Old Katy Rd Houston, TX | 1.0–2.0 | 1.0–2.0 | 907 | $2,197 | $2.42 | 2d | 43 | 0.81mi |
| 915 Silber Rd Unit 3187 Houston, TX | 3.0 | 2.0 | 1300 | $1,632 | $1.26 | 2d | 1 | 0.84mi |
| 915 Silber Rd Unit 2187 Houston, TX | 2.0 | 2.0 | 750 | $1,107 | $1.48 | 2d | 1 | 0.84mi |
| 915 Silber Rd Unit 2162 Houston, TX | 2.0 | 2.0 | 750 | $1,115 | $1.49 | 4d | 1 | 0.84mi |
| 915 Silber Rd Unit 972 Houston, TX | 2.0 | 2.0 | 750 | $1,139 | $1.52 | 10d | 1 | 0.84mi |
| 915 Silber Rd Unit 948 Houston, TX | 3.0 | 2.0 | 1300 | $1,664 | $1.28 | 10d | 1 | 0.84mi |
| 502 S Post Oak Ln Houston, TX | 1.0–2.0 | 1.0–2.0 | 963 | $1,650 | $1.71 | 3d | 8 | 0.84mi |
| 500 Sage Rd Houston, TX | 2.0 | 2.0 | 1265 | $2,775 | $2.19 | 24d | 1 | 0.89mi |
| 415 Silber Rd Houston, TX | 2.0 | 1.0 | 750 | $1,200 | $1.60 | 43d | 1 | 0.90mi |
| 415 Silber Rd Houston, TX | 1.0 | 1.0 | 720 | $1,149 | $1.60 | 24d | 1 | 0.90mi |
| 415 Silber Rd Houston, TX | 2.0 | 1.0 | 750 | $1,200 | $1.60 | 24d | 1 | 0.90mi |
| 5010 Woodway Dr Houston, TX | 1.0–2.0 | 1.0–2.0 | 736 | $1,585 | $2.15 | 43d | 1 | 0.91mi |
| 7111 Old Katy Rd Houston, TX | 2.0 | 1.0 | 1012 | $1,575 | $1.56 | 43d | 1 | 0.93mi |
| 7 Riverway Houston, TX | 1.0–2.0 | 1.0–2.0 | 1503 | $5,869 | $3.90 | 1d | 7 | 0.93mi |
| 7777 Katy Fwy Houston, TX | 1.0–2.0 | 1.0–2.0 | 1049 | $1,928 | $1.84 | 2d | 49 | 0.96mi |
| 1255 N Post Oak Rd Houston, TX | 1.0–2.0 | 1.0–2.0 | 1065 | $1,892 | $1.78 | 2d | 19 | 0.98mi |
| 7100 Old Katy Rd Unit 422 Houston, TX | 2.0 | 2.0 | 1165 | $1,640 | $1.41 | 7d | 1 | 1.05mi |
| 7100 Old Katy Rd Unit 2162 Houston, TX | 2.0 | 2.0 | 1165 | $1,640 | $1.41 | 5d | 1 | 1.05mi |
| 7100 Old Katy Rd Unit 425 Houston, TX | 2.0 | 2.0 | 1165 | $1,632 | $1.40 | 3d | 1 | 1.05mi |
| 7100 Old Katy Rd Unit 7137 Houston, TX | 2.0 | 2.0 | 1165 | $1,664 | $1.43 | 11d | 1 | 1.05mi |
| 7100 Old Katy Rd Unit 2174 Houston, TX | 2.0 | 2.0 | 1165 | $1,675 | $1.44 | 12d | 1 | 1.05mi |
| 807 S Post Oak Ln Houston, TX | 1.0–2.0 | 1.0–2.0 | 970 | $2,460 | $2.54 | 2d | 18 | 1.08mi |
| 1261 N Post Oak Rd Houston, TX | 2.0 | 2.0 | 1313 | $1,568 | $1.19 | 43d | 1 | 1.08mi |
| 3939 W 12th St Houston, TX | 2.0 | 1.0–2.0 | 889 | $2,775 | $3.12 | 1d | 19 | 1.21mi |
| 722 International Blvd Houston, TX | 1.0–3.0 | 1.0–3.5 | 1530 | $1,998 | $1.31 | 3d | 31 | 1.21mi |
| 731 International Blvd Unit 100 Houston, TX | 2.0 | 2.0 | 960 | $1,325 | $1.38 | 43d | 1 | 1.21mi |
| 1148 Silber Rd Houston, TX | 1.0–2.0 | 1.0–2.0 | 935 | $2,235 | $2.39 | 2d | 52 | 1.25mi |
| 1300 N Post Oak Rd Houston, TX | 1.0 | 1.0 | 717 | $1,517 | $2.11 | 2d | 18 | 1.25mi |
| 6003 Westview Dr Unit ADD2 Houston, TX | 2.0 | 2.0 | 1163 | $2,175 | $1.87 | 24d | 1 | 1.30mi |
| 6002 Westview Dr Houston, TX | 2.0 | 2.0 | 1163 | $2,175 | $1.87 | 43d | 1 | 1.34mi |
| 1311 Post Oak Park Dr Houston, TX | 1.0 | 1.0 | 741 | $2,000 | $2.70 | 43d | 1 | 1.35mi |
| 1000 Antoine Dr Houston, TX | 1.0 | 1.0 | 725 | $1,290 | $1.78 | 11d | 1 | 1.37mi |
| 8512 Hempstead Rd Houston, TX | 3.0 | 2.0 | 1151 | $1,258 | $1.09 | 43d | 1 | 1.38mi |
| 5700 Green Tree Rd Houston, TX | 2.0 | 2.0 | 1168 | $1,700 | $1.46 | 43d | 1 | 1.38mi |
| 1317 Post Oak Park Dr Houston, TX | 1.0–3.0 | 1.0–2.5 | 984 | $2,414 | $2.45 | 2d | 31 | 1.41mi |
HOA detail condo
- Monthly dues
- $677 · $8,124/yr
- Likely covers
- poolsecurity
- Assessments
- None detected in remarks — confirm with the listing agent.
Listing history 50 events
-
2026-06-18days on market $166,000 Active 66 DOM
-
2026-06-17days on market $166,000 Active 65 DOM
-
2026-06-16days on market $166,000 Active 64 DOM
-
2026-06-15days on market $166,000 Active 63 DOM
-
2026-06-13pricedays on market $166,000 Active 61 DOM
-
2026-06-09days on market $167,000 Active 57 DOM
-
2026-06-08days on market $167,000 Active 56 DOM
-
2026-06-07days on market $167,000 Active 55 DOM
-
2026-06-04days on market $167,000 Active 52 DOM
-
2026-06-03days on market $167,000 Active 51 DOM
-
2026-06-02days on market $167,000 Active 50 DOM
-
2026-06-01days on market $167,000 Active 49 DOM
-
2026-05-31days on market $167,000 Active 48 DOM
-
2026-05-05price $175,000 505-char remark
Show marketing remark (505 chars)
Location location location! Zoned to Hunters Creek Elementary / Spring Branch MS / Memorial HS. Ideally located near Memorial Park, top dining and shopping, The Galleria, and major freeways. The MAINTENANCE FEE COVERS ALL UTILITIES, parking, security, two courtyards, a beautiful pool, and a wide range of amenities. Welcome to this 2-bedroom, 2-bath condo on the TOP FLOOR! Turnkey, stylish, and thoughtfully remodeled. Just minutes from the Galleria and Uptown park. Close to the pool and allows pets.
-
2026-04-13$179,000 Active 505-char remark
Show marketing remark (505 chars)
Location location location! Zoned to Hunters Creek Elementary / Spring Branch MS / Memorial HS. Ideally located near Memorial Park, top dining and shopping, The Galleria, and major freeways. The MAINTENANCE FEE COVERS ALL UTILITIES, parking, security, two courtyards, a beautiful pool, and a wide range of amenities. Welcome to this 2-bedroom, 2-bath condo on the TOP FLOOR! Turnkey, stylish, and thoughtfully remodeled. Just minutes from the Galleria and Uptown park. Close to the pool and allows pets.
-
2025-11-04historical
-
2025-08-21$189,000 Active
-
2024-06-19historical
-
2024-05-19historical $1,800
-
2024-05-17$1,800
-
2024-04-27$199,999 Active
-
2024-04-25historical
-
2024-04-24price $199,999
-
2024-04-17historical $1,900
-
2024-04-17$218,000 Active
-
2024-04-13price $1,900
-
2024-03-18$2,000
-
2024-03-07historical
-
2024-02-28price $198,900
-
2024-02-09price $209,990
-
2024-01-23$218,888 Active
-
2023-06-21historical
-
2023-06-14price $187,000
-
2023-06-02price $199,000
-
2023-05-19$204,000 Active
-
2022-06-15soldstatus Sold
-
2022-06-15soldstatus
-
2022-06-10status Pending
-
2022-05-10status Active
-
2022-05-10$184,900 Active
-
2022-05-10historical
-
2022-05-09status Option Pending
-
2022-05-04status Pending
-
2022-04-02status Active
-
2022-03-30status Option Pending
-
2022-03-16historical
-
2022-03-16$184,900 Active
-
2022-02-28price $184,900
-
2022-02-06$189,900 Active
-
2019-05-03historical
ⓘ Source: listings_history table (triggers on properties + properties_extension) + one-shot
backfill from property_details.listing_events for pre-trigger history.
Tax reassessment forecast TX · Resets to sale price
- Current annual tax
- $4,292 · $358/mo
- Projected year-2 tax
- $4,292 · $358/mo
- Expected delta
- $0/yr ($0/mo · 0.0%)
ⓘ Screening estimate from a state-policy table — verify with the county assessor before closing.
Climate risk First Street
- Flood 7/10 Severe FEMA zone X (unshaded) · 99% chance over 30 yrs
- Wildfire 1/10 Low
- Heat 9/10 Extreme 7 d/yr ≥109°F today · 24 d/yr by 30 yrs out
- Wind 9/10 Extreme 99% chance of damaging wind over 30 yrs
- Air quality 3/10 Moderate 3 unhealthy d/yr today · 3 by 30 yrs out
Nearby sold comps map
Loading sold comps map…
Walkable amenities ~0.75 mi
Loading nearby amenities…
Taxation est. · year 1
- Rental income
- $21,769
- − Mortgage interest
- −$9,299
- − Property taxes
- −$4,292
- − Insurance
- −$1,628
- − Repairs & maintenance
- −$1,742
- − Management
- −$1,742
- − HOA
- −$8,124
- − Depreciation
- −$4,829
- Taxable loss
- −$9,885
- Est. tax savings @ 24.0%
- +$2,372
- After-tax cash flow
- $-4,920/yr
For passive investors: Depreciation is non-cash, so a rental often shows a tax loss while cash-flowing — sheltering income. Rental losses are passive: they offset passive income freely, and up to $25,000/yr can offset ordinary (W-2) income if you actively participate and your MAGI is under $100k (phasing out to $0 by $150k); unused losses carry forward. On sale, claimed depreciation is recaptured at up to 25%, and gains may owe capital-gains tax (a 1031 exchange can defer both). Figures are a year-1 estimate at your 24.0% rate — not tax advice; consult a CPA.
Schools (NCES district)
- District
- Spring Branch ISD
- NCES district ID
- 4841100
- Math proficiency
- 47% ▼ -4.00%
- Reading proficiency
- 46% ▼ -1.00%
- Median HH income
- $60,311
- Composite
- 40.88/100
- National rank
- #3624
- State rank
- #215 of 826 in TX
Livability — Houston
- Score
- 74/100
- State rank
- #184
- US rank
- #4771
Category grades
Schools grade is shown separately in the Schools card above.
Census & demographics
- Census place
- Houston, TX
- County
- Harris County · 4,702,590 people
- City population
- 3,226,434
- Metro
- Houston-The Woodlands-Sugar Land, TX
- Population (ZIP)
- 38,288
- Household income
- $136,149
- Rent vs Own
- Severe rent burden
- 1144.0
Population outlook (Harris County) Hauer SSP2
- Today (2025)
- 5,571,493 people
- By 2030
- 6,089,821 · +9.3%
- By 2040
- 7,142,806 · +28.2%
- By 2050
- 8,185,864 · +46.9%
- By 2075
- 10,574,329 · +89.8%
- By 2100
- 12,109,958 · +117.4%
Race, ethnicity, and origin ACS 2023
- Neighborhood character
- Predominantly White (67%)
- Race & ethnicity
- White 67% Asian 14% Hispanic / Latino 12% Two or more races 8% Black 4%
- Hispanic origin (detail)
- Mexican 6%
- Common ancestry
- Lithuanian 4% Slovak 3% Italian 3%
- Foreign-born
- 21% · Canada, China, South Korea
- Languages at home
- 70% English-only · Spanish 11% Other Indo-European 4% Chinese 4%
Political lean MEDSL · Harris
- 2024 margin
- Lean D (+5.5) · D 52.0% · R 46.4% · Other 1.6%
- 2008→2024 swing
- +3.9pp toward D · 2008: 1.6pp · 2024: 5.5pp
- All cycles
- 2024: D+5.5 2020: D+13.3 2016: D+12.4 2012: D+0.1 2008: D+1.6
Not yet ingested
- Civics
- —
Market trends
- HPI YoY
- ▲ 6.92%
- Current HPI
- 256.8342
- Rent YoY
- ▲ 4.96%
- Metro
- Houston-The Woodlands-Sugar Land, TX
- State GDP YoY
- ▲ 3.95%
- F500 in state
- 110
Industry mix (Fortune 500 HQ in TX)
| Industry | F500 HQs | Revenue |
|---|---|---|
| Energy | 16 | $1,198B |
|
||
| Technology | 5 | $198B |
|
||
| Engineering / Construction | 4 | $72B |
|
||
| Energy Services | 3 | $60B |
|
||
| Utilities | 3 | $41B |
|
||
| Healthcare | 2 | $330B |
|
||
Price history
+157.4% since first listed51 events — show timeline
- 2026-05-05 Price Changed $175,000 HARMLS
- 2026-04-13 Listed $179,000 HARMLS
- 2025-11-04 Listing Removed — HARMLS
- 2025-08-21 Listed $189,000 HARMLS
- 2024-06-19 Listing Removed — HARMLS
- 2024-05-19 Rental Removed $1,800 HARMLS
- 2024-05-17 Listed for Rent $1,800 HARMLS
- 2024-04-27 Listed $199,999 HARMLS
- 2024-04-25 Listing Removed — HARMLS
- 2024-04-24 Price Changed $199,999 HARMLS
- 2024-04-17 Rental Removed $1,900 HARMLS
- 2024-04-17 Listed $218,000 HARMLS
- 2024-04-13 Price Changed $1,900 HARMLS
- 2024-03-18 Listed for Rent $2,000 HARMLS
- 2024-03-07 Listing Removed — HARMLS
- 2024-02-28 Price Changed $198,900 HARMLS
- 2024-02-09 Price Changed $209,990 HARMLS
- 2024-01-23 Listed $218,888 HARMLS
- 2023-06-21 Listing Removed — HARMLS
- 2023-06-14 Price Changed $187,000 HARMLS
- 2023-06-02 Price Changed $199,000 HARMLS
- 2023-05-19 Listed $204,000 HARMLS
- 2022-06-15 Sold (Public Records) — Public Records
- 2022-06-15 Sold (MLS) — HARMLS
- 2022-06-10 Pending — HARMLS
- 2022-05-10 Relisted — HARMLS
- 2022-05-10 Listing Removed — HARMLS
- 2022-05-10 Listed $184,900 HARMLS
- 2022-05-09 Pending — HARMLS
- 2022-05-04 Pending — HARMLS
- 2022-04-02 Relisted — HARMLS
- 2022-03-30 Pending — HARMLS
- 2022-03-16 Listed $184,900 HARMLS
- 2022-03-16 Listing Removed — HARMLS
- 2022-02-28 Price Changed $184,900 HARMLS
- 2022-02-06 Listed $189,900 HARMLS
- 2019-05-03 Listing Removed — HARMLS
- 2019-04-15 Listed $174,900 HARMLS
- 2018-07-28 Listing Removed — HARMLS
- 2018-04-26 Price Changed $178,000 HARMLS
- 2018-04-25 Listed $178 HARMLS
- 2018-03-28 Sold (Public Records) — Public Records
- 2018-03-19 Sold (MLS) — HARMLS
- 2018-03-14 Pending — HARMLS
- 2018-01-14 Listed $178,000 HARMLS
- 2014-03-06 Sold (Public Records) — Public Records
- 2014-02-24 Sold (MLS) — HARMLS
- 2014-01-19 Pending — HARMLS
- 2014-01-06 Listed $149,500 HARMLS
- 1999-03-12 Sold (Public Records) — Public Records
- 1999-03-11 Sold (Public Records) $68,000 Public Records
Property tax history
+5.7%/yrLatest (2025): $4,292 · -5.2% YoY. Source: county tax records.
Cash-flow waterfall
monthlySold comps — $/sqft
last 12 mo · ≤1 miLoading sold comps…