 🏗️ New Construction
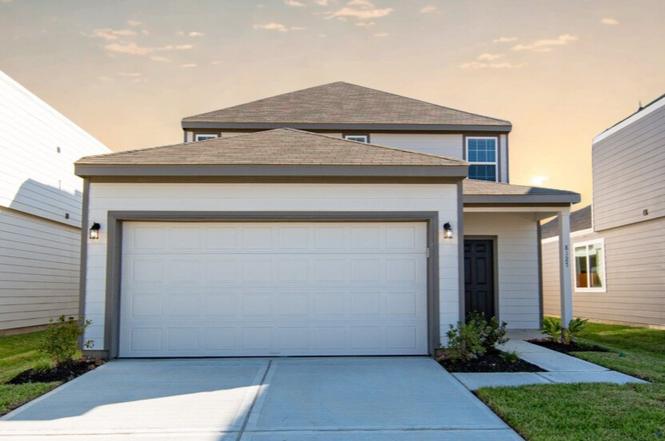
8127 Vanilla Orchid Dr · Houston, TX
Flood risk No data
- FEMA flood zone
- —
- Chance of flooding over 30 yrs
- —
- Est. flood insurance / yr
- —
Fire risk No data
- Est. fire insurance / yr
- —
Heat risk No data
- Hot days now (above threshold)
- —
- Hot days in 30 yrs
- —
Wind risk No data
- Chance of severe wind over 30 yrs
- —
Air-quality risk No data
- Unhealthy air days now
- —
- Unhealthy air days in 30 yrs
- —
Risk factors via First Street. Map © Google.
Why this score? — see what drove the D- grade
The composite is a weighted blend of 9 inputs, each scored 0–100. Each bar is that input's sub-score; the figure is the points it added to the 100-point composite (weight × sub-score).
- Appreciation +9.3/10.0
- ARV discount +7.5/15.0
- Cash flow +6.7/30.0
- Livability +3.7/5.0
- Schools +2.7/10.0
- Rent growth +2.6/5.0
- Condition / age +2.5/5.0
- 1% rule +1.9/10.0
- DSCR +0.9/10.0
$284,990
🖨 Deal sheet 📄 Offer letter ✓ Due diligence
Listing remarks
Love where you live in Wayside Village in Houston! This vibrant community offers comfort, convenience, and modern living all in one place. The Woodland floor plan is a spacious two-story home featuring 4 bedrooms, 2.5 bathrooms, a game room, and a 2-car garage—thoughtfully designed for both functionality and style. Enjoy privacy blinds and vinyl plank flooring throughout the first-floor common areas, creating a warm and welcoming atmosphere. The gourmet kitchen is sure to impress with 42-inch cabinetry, granite countertops, and stainless-steel appliances, plus plenty of space for cooking and gathering. Retreat to the first-floor Owner’s Suite, complete with granite countertops,
Key facts
- Gourmet kitchen
- Covered patio
- Privacy blinds
Tags
Neighborhood map
What this means for you Summary
Snapshot
- This is a 4-bed/2.5-bath single-family listed at $285k.
Deal economics
- At list price, monthly cash flow is $-459 ($-6k/yr) — negative.
- To cash-flow at today's rent, offer at most $218k (23.5% below list).
- To meet the 1% rule (rent ≥ 1% of price), the offer needs to be $195k (31.5% below list).
- Recommended offer: $195k (31.5% below list) — sets the bar for 1% rule.
- Cap rate 4.4% vs local median 3.2% in Houston — top-decile yield for the area; either an underpriced asset or a hidden risk that comps aren't pricing in. Stress-test before assuming the spread holds.
Location & tenants
- Location reads 74/100 on livability (#184 in TX, #4,771 nationally) — a middle-class / working-renter tenant base. Strengths: amenities A+, cost of living A+, housing A+; Watch: crime F.
- Houston ISD (urban): math 27% / reading 35% proficiency, ranked #593 of 826 in TX (top 72%) — families likely to look elsewhere, expect single-tenant / working-renter base with shorter leases; 71% free/reduced lunch — lower-income household profile, screen leases tightly.
- Zoned schools: Forest Brook Middle (math 12% / reading 14%, grade F, #1,609 of 1,662 statewide, top 97%, 613 students, 98% FRL); North Forest H S (math 13% / reading 18%, grade F, #1,505 of 1,632 statewide, top 92%, 974 students, 97% FRL) — zoned schools average 98% FRL vs 71% district-wide (27 pts higher); higher-poverty schools than district average — tighter screening recommended.
- Zoned-school proficiency averages 14% at this address vs 31% district-wide (-17 pts) — the specific schools serving this property underperform the Houston ISD average; the district grade overstates school quality for this exact location.
- Market conditions: Rents flat; 372 active listings in the ZIP; 27 comparable units currently listed for rent nearby; rentals at typical pace (median 19d on market — plan ~3-4 weeks tenant-placement turnaround); 29,883 units permitted in Harris County in 2024 (8,621 in 5+ unit buildings).
- At $1,953/mo this rent would consume 49% of the median local household income ($48k/yr) (locally 1297% of renters already pay >50% of income on rent) — very limited rent-growth headroom before tenants either downsize or default.
Forward outlook
- In year one you build about $27k of equity ($2k loan paydown + $25k appreciation (8.7% local appreciation)).
- Harris County population projected at +47% by 2050 — long-run rental-demand tailwind backs the buy-and-hold thesis.
- By year 2, paydown + projected appreciation supports a ~$43k cash-out refi (75% LTV) — recoverable capital for the next deal without selling this one.
Negotiation context
- It's been on market 29 days — a 2% lower offer ($281k) is reasonable based on typical stale-listing flexibility.
- 4 sale attempts with the ask held roughly flat each time — persistent listings suggest the price (not the market) is what's stuck; bring a comps-based counter.
Questions for the listing agent
- What do current leases actually rent for vs. the listed asking? Can we see a recent rent roll and the last 12 months of T-12 income?
- What does the HOA fee cover, when was the last increase, and are there any pending special assessments or reserve-fund shortfalls?
- Is there a deadline driving the sale (1031 exchange, divorce, estate, relocation)? That informs how much negotiation room exists.
- Schools are D-rated, which usually means shorter tenancies and higher turnover. Who's the typical renter profile here, and what's been the actual vacancy rate?
- Crime grade is F in this area — have there been break-ins, vandalism, or insurance claims at this property in the last 3 years? What carrier currently insures it and at what premium?
- The area grade is low — what's the realistic commute time and amenity access for the typical tenant pool here? Any planned neighborhood developments (good or bad) we should know about?
- What's the average days-on-market for RENTAL listings here right now (not sales)? A rising rental-DOM trend means longer vacancies and softer asking-rent achievability than the comps imply.
- What's the recent tenant-quality profile in this submarket — average credit score on applications, eviction rate, late-payment / NSF rate, and stable-employment percentage? A property-management company in the area should have these aggregated.
- How much new for-sale + rental construction is in the pipeline within 1–3 miles? Heavy new supply typically softens prices + rents 12–24 months out; constrained supply supports both.
Investment metrics
- 1% rule
- 0.69% ✗
- Cap rate
- 4.36%
- Cash-on-cash
- -6.92%
- DSCR
- 0.69
- GRM
- 12.1
CMA / ARV
- ARV (on-the-fly)
- $284,435
- Comps found
- 12
Show comp detail 12 sales within ~0.75 mi
| Address | Dist | Beds/Ba | Sqft | Sold | Price | $/sf | Match |
|---|---|---|---|---|---|---|---|
| 8127 Vanilla Orchid Dr | 0.00mi | 4/2.5 | 1,745 (0%) | 1mo | $284,990 | $163 | 99 |
| 8128 Vanilla Orchid Dr | 0.03mi | 4/2.5 | 1,745 (0%) | 2mo | $289,990 | $166 | 97 |
| 8105 Burnt Orchid Dr | 0.08mi | 4/2.5 | 1,745 (0%) | 1mo | $284,990 | $163 | 95 |
| 8202 Burnt Orchid Dr | 0.09mi | 3/2.5 (-1) | 1,881 (+8%) | 1mo | $297,900 | $158 | 77 |
| 8207 Burnt Orchid Dr | 0.05mi | 3/2.0 (-1) | 1,571 (-10%) | 1mo | $279,900 | $178 | 73 |
| 8124 Burnt Orchid Dr | 0.09mi | 3/2.0 (-1) | 1,571 (-10%) | 1mo | $279,900 | $178 | 72 |
| 7907 Elowen Grove Dr | 0.38mi | 3/2.5 (-1) | 1,826 (+5%) | 1mo | $295,540 | $162 | 69 |
| 10331 Vinca Minor Ln | 0.39mi | 3/2.5 (-1) | 1,826 (+5%) | 1mo | $296,040 | $162 | 68 |
| 10319 Vinca Minor Ln | 0.41mi | 3/2.5 (-1) | 1,826 (+5%) | 0mo | $296,290 | $162 | 68 |
| 7816 Laurel Gem Dr | 0.54mi | 3/2.5 (-1) | 1,826 (+5%) | 2mo | $288,740 | $158 | 61 |
| 7706 Tully Ave | 0.70mi | 3/2.0 (-1) | 1,600 (-8%) | 2mo | $300,000 | $188 | 45 |
| 7706 Langley Rd | 0.70mi | 4/2.0 | 2,006 (+15%) | 2mo | $150,000 | $75 | 38 |
Match score weights: distance 35% · size 25% · config 20% · recency 20%. Top-matched comps best support the ARV.
Projected returns pro-forma
8.65% appreciation · 0.44% rent growth · sell at horizon
- IRR
- 15.6%
- Equity multiple
- 2.19×
- Total profit
- $94,985
- Equity at exit
- $228,764
- IRR
- 14.6%
- Equity multiple
- 4.63×
- Total profit
- $289,231
- Equity at exit
- $466,743
Cash invested: $79,642 (down + closing). Projections, not guarantees.
Landlord ↔ Tenant lean methodology
- Overall (STATE)
- 87 Strongly Landlord-Friendly
- State Texas
- 87 Strongly Landlord-Friendly · R+5
- County
- — inherits STATE
- City
- — inherits STATE
ZIP-level market 77016
- Home prices YoY
- 2.8%
- Rents YoY
- 0.4%
- Active inventory
- 372
- Price-to-rent
- 12.2×
Monthly cashflow live
- Estimated rent
- $1,953 high interval (Pro) →
- Mortgage (P&I)
- −$1,492
- Tax est. 1.5%
- −$356 /mo · $4,267/yr
- Insurance
- −$119
- HOA
- −$36
- Vacancy / Maint / Mgmt
- −$410
- Net cashflow
- $-459
Break-even live
UW: 25.0% down · 7.5% · 30yr · 1.5% tax · 5.0% vac · 8.0% maint · 8.0% mgmt
Financing live
Cash to close
- Down payment
- $71,109
- Closing costs
- $8,533
- Reserves months
- —
- Total cash needed
- —
Loan-product check · same deal, 3 products live
Conventional
25% down · 7.5% · 30yr
- Down + closing
- —
- Monthly P&I
- —
- Monthly cashflow
- —
- DSCR
- —
- Eligible?
- —
Personal DTI + credit; lowest rate.
DSCR
20% down · 8.5% · 30yr
- Down + closing
- —
- Monthly P&I
- —
- Monthly cashflow
- —
- DSCR
- —
- Eligible?
- —
No personal income docs; deal must DSCR.
Hard money
10% down · 12.0% · 12mo
- Down + closing
- —
- Monthly P&I
- —
- Monthly cashflow
- —
- DSCR
- —
- Eligible?
- —
Short-term bridge; refi at stabilization.
Rent comps 27 comps
| Address | Beds | Baths | Sqft | Rent | $/sqft | DOM | Units | Dist |
|---|---|---|---|---|---|---|---|---|
| 8003 Alpine Bearberry Dr Houston, TX | 3.0–4.0 | 2.0–2.5 | 1696 | $2,520 | $1.49 | 8d | 1 | 0.25mi |
| 10708 Lavender Cotton Ln Houston, TX | 3.0 | 2.0 | 1406 | $2,150 | $1.53 | 44d | 1 | 0.27mi |
| 10474 Red Orchid Dr Houston, TX | 3.0 | 2.5 | 1553 | $1,875 | $1.21 | 24d | 1 | 0.42mi |
| 8214 Parker Rd Unit B Houston, TX | 3.0 | 2.0 | 1608 | $1,560 | $0.97 | 8d | 1 | 0.42mi |
| 8102 Rhobell St Unit A Houston, TX | 4.0 | 3.5 | 1567 | $1,750 | $1.12 | 44d | 1 | 0.57mi |
| 8314 Madera Rd Unit B Houston, TX | 3.0 | 2.5 | 1608 | $1,495 | $0.93 | 24d | 1 | 0.60mi |
| 7726 Spinet St Houston, TX | 4.0 | 2.0 | 1456 | $2,375 | $1.63 | 8d | 1 | 0.61mi |
| 10314 Woodwick St Unit 1283919P Houston, TX | 3.0 | 2.5 | 1496 | $3,782 | $2.53 | 8d | 1 | 0.63mi |
| 8213 Bigwood St Unit A Houston, TX | 3.0 | 2.5 | 1150 | $1,595 | $1.39 | 44d | 1 | 0.67mi |
| 8122 Sterlingshire St Unit B Houston, TX | 3.0 | 2.0 | 1160 | $1,450 | $1.25 | 15d | 1 | 0.76mi |
| 8122 Sterlingshire St Unit A Houston, TX | 3.0 | 2.0 | 1160 | $1,525 | $1.31 | 15d | 1 | 0.76mi |
| 8126 Sterlingshire St Unit B Houston, TX | 3.0 | 2.0 | 1150 | $1,350 | $1.17 | 24d | 1 | 0.76mi |
| 10750 Nyla Spring St Houston, TX | 3.0 | 2.0 | 1500 | $1,975 | $1.32 | 19d | 1 | 0.86mi |
| 7223 Valmont Dr Houston, TX | 4.0 | 2.0 | 1546 | $1,595 | $1.03 | 44d | 1 | 0.88mi |
| 8235 Locksley Rd Unit A Houston, TX | 3.0 | 2.5 | 1608 | $1,525 | $0.95 | 8d | 1 | 0.93mi |
| 6823 Hanley Ln Houston, TX | 3.0 | 2.0 | 1303 | $1,610 | $1.24 | 5d | 1 | 0.94mi |
| 9702 Hillis St Houston, TX | 3.0 | 2.0 | 1612 | $1,550 | $0.96 | 44d | 1 | 1.09mi |
| 7325 Boggess Rd Houston, TX | 3.0 | 2.0 | 1568 | $1,850 | $1.18 | 44d | 1 | 1.09mi |
| 7325 Boggess Rd Houston, TX | 3.0 | 2.0 | 1568 | $1,850 | $1.18 | 17d | 1 | 1.09mi |
| 9550 N Wayside Dr Houston, TX | 1.0–3.0 | 1.0–2.0 | 896 | $1,399 | $1.56 | 1d | 5 | 1.14mi |
| 7426 Bigwood St Houston, TX | 4.0 | 2.0 | 1997 | $1,850 | $0.93 | 14d | 1 | 1.15mi |
| 7314 Saunders Rd Houston, TX | 4.0 | 2.0 | 1339 | $1,723 | $1.29 | 14d | 1 | 1.17mi |
| 7176 Parker Rd Houston, TX | 4.0 | 2.0 | 1152 | $1,200 | $1.04 | 44d | 1 | 1.41mi |
| 11235 Lemond Dr Houston, TX | 3.0 | 1.0 | 1368 | $1,450 | $1.06 | 22d | 1 | 1.44mi |
| 9222 Hillis St Houston, TX | 3.0 | 2.0 | 1498 | $1,850 | $1.23 | 44d | 1 | 1.46mi |
| 8006 Lynette St Houston, TX | 3.0 | 1.0 | 1400 | $1,475 | $1.05 | 24d | 1 | 1.48mi |
| 9218 Nyssa St Unit B Houston, TX | 3.0 | 2.5 | 1608 | $1,490 | $0.93 | 2d | 1 | 1.50mi |
HOA detail
- Monthly dues
- $36 · $432/yr
Listing history 11 events
-
2026-04-01status Pending
-
2026-03-03price $284,990
-
2026-03-03$292,266 Active
-
2026-02-23historical
-
2025-11-14price $284,990
-
2025-10-22status Active
-
2025-10-08status Pending
-
2025-09-22$283,990 Active
-
2025-09-22historical
-
2025-08-15price $283,990
-
2025-06-12$292,266 Active
ⓘ Source: listings_history table (triggers on properties + properties_extension) + one-shot
backfill from property_details.listing_events for pre-trigger history.
Nearby sold comps map
Loading sold comps map…
Walkable amenities ~0.75 mi
Loading nearby amenities…
Taxation est. · year 1
- Rental income
- $23,430
- − Mortgage interest
- −$15,933
- − Property taxes
- −$4,267
- − Insurance
- −$1,422
- − Repairs & maintenance
- −$1,874
- − Management
- −$1,874
- − HOA
- −$432
- − Depreciation
- −$8,274
- Taxable loss
- −$10,646
- Est. tax savings @ 24.0%
- +$2,555
- After-tax cash flow
- $-2,955/yr
For passive investors: Depreciation is non-cash, so a rental often shows a tax loss while cash-flowing — sheltering income. Rental losses are passive: they offset passive income freely, and up to $25,000/yr can offset ordinary (W-2) income if you actively participate and your MAGI is under $100k (phasing out to $0 by $150k); unused losses carry forward. On sale, claimed depreciation is recaptured at up to 25%, and gains may owe capital-gains tax (a 1031 exchange can defer both). Figures are a year-1 estimate at your 24.0% rate — not tax advice; consult a CPA.
Schools (NCES district)
- District
- Houston ISD
- NCES district ID
- 4823640
- Math proficiency
- 27% ▼ -18.00%
- Reading proficiency
- 35% ▼ -6.00%
- Median HH income
- $46,054
- Composite
- 26.63/100
- National rank
- #7173
- State rank
- #593 of 826 in TX
Livability — Houston
- Score
- 74/100
- State rank
- #184
- US rank
- #4771
Category grades
Schools grade is shown separately in the Schools card above.
Census & demographics
- Census place
- Houston, TX
- County
- Harris County · 4,702,590 people
- City population
- 3,226,434
- Metro
- Houston-The Woodlands-Sugar Land, TX
- Population (ZIP)
- 29,841
- Household income
- $47,677
- Rent vs Own
- Severe rent burden
- 1297.0
Population outlook (Harris County) Hauer SSP2
- Today (2025)
- 5,571,493 people
- By 2030
- 6,089,821 · +9.3%
- By 2040
- 7,142,806 · +28.2%
- By 2050
- 8,185,864 · +46.9%
- By 2075
- 10,574,329 · +89.8%
- By 2100
- 12,109,958 · +117.4%
Race, ethnicity, and origin ACS 2023
- Neighborhood character
- Majority Black (56%)
- Race & ethnicity
- Black 56% Hispanic / Latino 42% Two or more races 28%
- Hispanic origin (detail)
- Mexican 34%
- Foreign-born
- 18% · Canada
- Languages at home
- 61% English-only · Spanish 37%
Political lean MEDSL · Harris
- 2024 margin
- Lean D (+5.5) · D 52.0% · R 46.4% · Other 1.6%
- 2008→2024 swing
- +3.9pp toward D · 2008: 1.6pp · 2024: 5.5pp
- All cycles
- 2024: D+5.5 2020: D+13.3 2016: D+12.4 2012: D+0.1 2008: D+1.6
Not yet ingested
- Civics
- —
Market trends
- HPI YoY
- ▲ 8.65%
- Current HPI
- 315.6765
- Rent YoY
- ▲ 0.44%
- Metro
- Houston-The Woodlands-Sugar Land, TX
- State GDP YoY
- ▲ 3.95%
- F500 in state
- 110
Industry mix (Fortune 500 HQ in TX)
| Industry | F500 HQs | Revenue |
|---|---|---|
| Energy | 16 | $1,198B |
|
||
| Technology | 5 | $198B |
|
||
| Engineering / Construction | 4 | $72B |
|
||
| Energy Services | 3 | $60B |
|
||
| Utilities | 3 | $41B |
|
||
| Healthcare | 2 | $330B |
|
||
Price history
-2.5% since first listed11 events — show timeline
- 2026-04-01 Pending — HARMLS
- 2026-03-03 Price Changed $284,990 HARMLS
- 2026-03-03 Listed $292,266 HARMLS
- 2026-02-23 Listing Removed — HARMLS
- 2025-11-14 Price Changed $284,990 HARMLS
- 2025-10-22 Relisted — HARMLS
- 2025-10-08 Pending — HARMLS
- 2025-09-22 Listing Removed — HARMLS
- 2025-09-22 Listed $283,990 HARMLS
- 2025-08-15 Price Changed $283,990 HARMLS
- 2025-06-12 Listed $292,266 HARMLS
Cash-flow waterfall
monthlySold comps — $/sqft
last 12 mo · ≤1 miLoading sold comps…