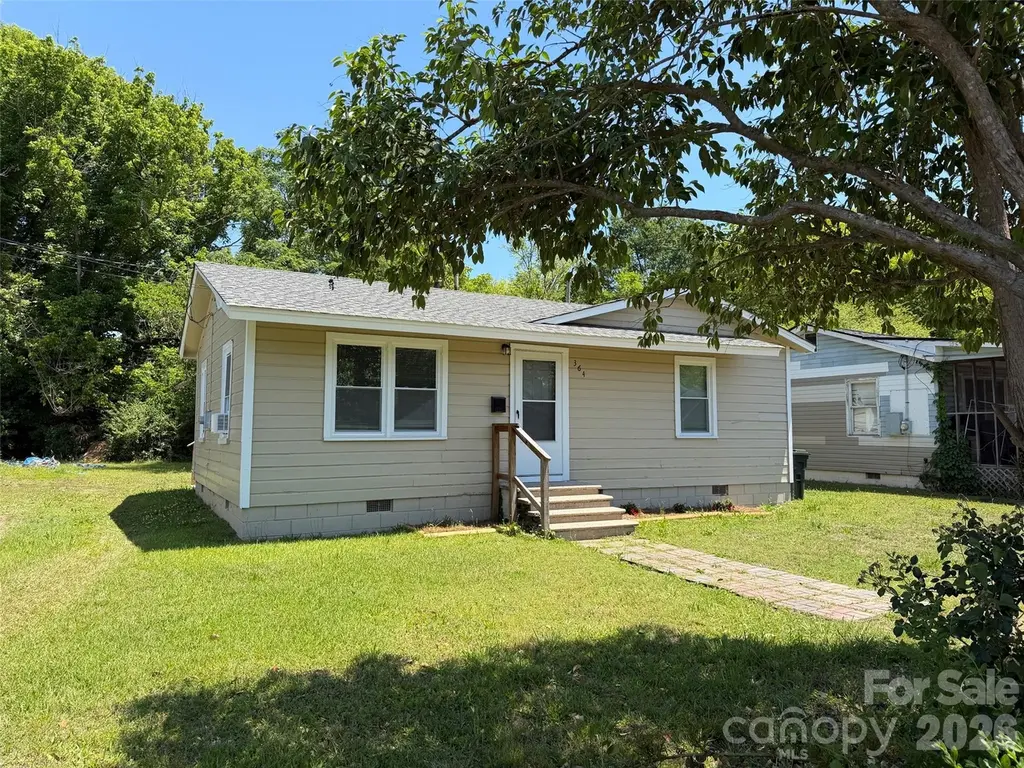
364 Baker St · Rock Hill, SC
Flood risk 1/10 · Minimal
- FEMA flood zone
- X (unshaded)
- Chance of flooding over 30 yrs
- 0.0%
- Est. flood insurance / yr
- $507 – $1,088
Fire risk 3/10 · Minor
- Est. fire insurance / yr
- $783 – $1,453
Heat risk 6/10 · Moderate
- Hot days now (above 105°F)
- 7 days/yr
- Hot days in 30 yrs
- 16 days/yr
Wind risk 6/10 · Moderate
- Chance of severe wind over 30 yrs
- 27.0%
Air-quality risk 3/10 · Minor
- Unhealthy air days now
- 2 days/yr
- Unhealthy air days in 30 yrs
- 3 days/yr
Risk factors via First Street. Map © Google.
Why this score? — see what drove the B+ grade
The composite is a weighted blend of 9 inputs, each scored 0–100. Each bar is that input's sub-score; the figure is the points it added to the 100-point composite (weight × sub-score).
- Cash flow +29.6/30.0
- ARV discount +15.0/15.0
- DSCR +10.0/10.0
- 1% rule +7.6/10.0
- Rent growth +3.9/5.0
- Schools +3.5/10.0
- Livability +3.5/5.0
- Condition / age +2.5/5.0
- Appreciation +0.0/10.0
$120,000
🖨 Deal sheet 📄 Offer letter ✓ Due diligence
Listing remarks
Charming two-bedroom home in Rock Hill's Sunset Park community offers. Step inside to find a bright, refreshed interior featuring fresh paint and durable luxury vinyl plank flooring that flows seamlessly throughout the entire space. The kitchen comes equipped with a gas range, ideal for easy everyday cooking, while newer windows throughout the home let in plenty of natural light. Whether you are looking for an affordable starter home, a manageable space to downsize, or a turnkey addition to your rental portfolio, this property provides a wonderful opportunity to own in an established neighborhood. Property is being sold in as-is condition.
Key facts
- Natural light
- Newer windows
- Gas range
Tags
Property features AI
Finance
- HOA & community: No HOA
Exterior
- Parking: Driveway
- Utilities: City water; Public sewer
- Home design: Single-family residence; One story; Site-built construction; Wood construction; Crawl space foundation
- Construction: Site built; Wood construction; Crawl space foundation
- Exterior features: Publicly maintained road access; Asphalt, gravel and paved road surfaces
Interior
- Kitchen: Gas oven; Gas range
- Bedrooms: 2 bedrooms on the main level
- Flooring: Vinyl flooring
- Bathrooms: 1 full bathroom on the main level
- Heating & cooling: Natural gas heating; Space heater; Ceiling fan(s); Window unit(s)
- Interior features: 5 total rooms; Gas oven; Gas range
- Laundry & utility: No laundry room (none listed)
Neighborhood map
What this means for you Summary
Snapshot
- This is a 2-bed/1.0-bath single-family listed at $120k.
Deal economics
- At list price, monthly cash flow is $433 ($5k/yr) — positive.
- The deal already cash-flows at list — no discount required.
- Meets the 1% rule at list price ($2k rent vs $120k).
- Recommended offer: $118k (1.5% below list) — sets the bar for market timing.
- Cap rate 10.6% vs local median 3.4% in Rock Hill — top-decile yield for the area; either an underpriced asset or a hidden risk that comps aren't pricing in. Stress-test before assuming the spread holds.
Location & tenants
- Location reads 70/100 on livability (#62 in SC) — a middle-class / working-renter tenant base. Strengths: cost of living A+, housing A+, health & safety A+; Watch: employment D+, crime D-, amenities D-.
- York 03 (urban): math 36% / reading 47% proficiency, ranked #32 of 80 in SC (top 40%) — families likely to look elsewhere, expect single-tenant / working-renter base with shorter leases.
- Zoned schools: Sunset Park Center For Accelerated Studies (math 47% / reading 42%, grade F, #226 of 597 statewide, top 40%, 491 students, 100% FRL); Northwestern High (math 35% / reading 84%, grade C+, #110 of 196 statewide, top 58%, 1,774 students, 52% FRL) — zoned schools average 76% FRL vs 49% district-wide (26 pts higher); higher-poverty schools than district average — tighter screening recommended.
- Market conditions: Rents rising fast (+5.5%/yr); 348 active listings in the ZIP; 22 comparable units currently listed for rent nearby; rentals at typical pace (median 15d on market — plan ~3-4 weeks tenant-placement turnaround); 2,550 units permitted in York County in 2024 (350 in 5+ unit buildings).
Forward outlook
- Local home prices are declining (-3.0%/yr); year-one equity from $830 of loan paydown is wiped out by about $4k of value loss. Plan a longer hold.
- York County population projected at +44% by 2050 — long-run rental-demand tailwind backs the buy-and-hold thesis.
- At projected returns (-3.0% appreciation + 5.5% rent growth), your $34k cash investment doubles in ~7 years — after that, you're playing with house money.
Negotiation context
- It's been on market 29 days — a 2% lower offer ($118k) is reasonable based on typical stale-listing flexibility.
- 3 sale attempts with the ask held roughly flat each time — persistent listings suggest the price (not the market) is what's stuck; bring a comps-based counter.
Risks & watch-outs
- Watch-outs: built in 1955 — expect roof / HVAC / electrical / plumbing capex.
- Climate carrying-cost: major wind risk, 27% chance of damaging wind over 30y; extreme-heat days projected 7→16/yr by 2055 (HVAC capex compounding) — expect insurance premiums to compound above CPI over the hold.
Questions for the listing agent
- Built in 1955 — when were the roof, HVAC, electrical panel, plumbing, and water heater last replaced?
- Is there a deadline driving the sale (1031 exchange, divorce, estate, relocation)? That informs how much negotiation room exists.
- Schools are D-rated, which usually means shorter tenancies and higher turnover. Who's the typical renter profile here, and what's been the actual vacancy rate?
- Crime grade is D in this area — have there been break-ins, vandalism, or insurance claims at this property in the last 3 years? What carrier currently insures it and at what premium?
- What's the average days-on-market for RENTAL listings here right now (not sales)? A rising rental-DOM trend means longer vacancies and softer asking-rent achievability than the comps imply.
- What's the recent tenant-quality profile in this submarket — average credit score on applications, eviction rate, late-payment / NSF rate, and stable-employment percentage? A property-management company in the area should have these aggregated.
- How much new for-sale + rental construction is in the pipeline within 1–3 miles? Heavy new supply typically softens prices + rents 12–24 months out; constrained supply supports both.
Investment metrics
- 1% rule
- 1.26% ✓
- Cap rate
- 10.62%
- Cash-on-cash
- 15.45%
- DSCR
- 1.69
- GRM
- 6.6
CMA / ARV
- ARV (on-the-fly)
- $179,515
- Comps found
- 12
Show comp detail 12 sales within ~0.75 mi
| Address | Dist | Beds/Ba | Sqft | Sold | Price | $/sf | Match |
|---|---|---|---|---|---|---|---|
| 358 Orr Dr | 0.06mi | 2/1.0 | 803 (-0%) | 2mo | $206,000 | $257 | 95 |
| 309 Orr Dr | 0.13mi | 2/1.0 | 794 (-1%) | 2mo | $70,000 | $88 | 90 |
| 206 Friedheim Rd | 0.31mi | 2/1.0 | 791 (-2%) | 1mo | $165,000 | $209 | 82 |
| 329 Arnold St | 0.09mi | 3/1.0 (+1) | 786 (-2%) | 7mo | $160,000 | $204 | 81 |
| 214 Orr Dr | 0.19mi | 2/1.0 | 864 (+7%) | 2mo | $120,000 | $139 | 77 |
| 225 Baker St | 0.14mi | 2/1.0 | 853 (+6%) | 12mo | $195,000 | $229 | 74 |
| 325 Orr Dr | 0.09mi | 2/1.0 | 870 (+8%) | 11mo | $164,900 | $190 | 73 |
| 339 Arnold St | 0.09mi | 2/1.0 | 715 (-11%) | 10mo | $180,000 | $252 | 69 |
| 66 Reynolds St | 0.44mi | 2/1.0 | 754 (-6%) | 6mo | $183,000 | $243 | 64 |
| 420 Byars St | 0.24mi | 2/1.0 | 701 (-13%) | 8mo | $175,000 | $250 | 61 |
| 457 Fewell St | 0.59mi | 3/2.0 (+1) | 824 (+2%) | 3mo | $183,500 | $223 | 57 |
| 459 Green St | 0.75mi | 2/1.0 | 887 (+10%) | 1mo | $195,000 | $220 | 47 |
Match score weights: distance 35% · size 25% · config 20% · recency 20%. Top-matched comps best support the ARV.
Projected returns pro-forma
-3.0% appreciation · 5.53% rent growth · sell at horizon
- IRR
- 8.9%
- Equity multiple
- 1.36×
- Total profit
- $12,027
- Equity at exit
- $17,892
- IRR
- 20.0%
- Equity multiple
- 2.87×
- Total profit
- $62,903
- Equity at exit
- $10,375
Cash invested: $33,600 (down + closing). Projections, not guarantees.
Landlord ↔ Tenant lean methodology
- Overall (STATE)
- 90 Strongly Landlord-Friendly
- State South Carolina
- 90 Strongly Landlord-Friendly · R+6
- County
- — inherits STATE
- City
- — inherits STATE
ZIP-level market 29730
- Rents YoY
- 5.5%
- Active inventory
- 348
- Price-to-rent
- 6.6×
Monthly cashflow live
- Estimated rent
- $1,510 high interval (Pro) →
- Mortgage (P&I)
- −$629
- Tax from tax record
- −$81 /mo · $974/yr
- Insurance
- −$50
- HOA
- −$0
- Vacancy / Maint / Mgmt
- −$317
- Net cashflow
- $433
Break-even live
UW: 25.0% down · 7.5% · 30yr · 1.5% tax · 5.0% vac · 8.0% maint · 8.0% mgmt
Financing live
Cash to close
- Down payment
- $30,000
- Closing costs
- $3,600
- Reserves months
- —
- Total cash needed
- —
Loan-product check · same deal, 3 products live
Conventional
25% down · 7.5% · 30yr
- Down + closing
- —
- Monthly P&I
- —
- Monthly cashflow
- —
- DSCR
- —
- Eligible?
- —
Personal DTI + credit; lowest rate.
DSCR
20% down · 8.5% · 30yr
- Down + closing
- —
- Monthly P&I
- —
- Monthly cashflow
- —
- DSCR
- —
- Eligible?
- —
No personal income docs; deal must DSCR.
Hard money
10% down · 12.0% · 12mo
- Down + closing
- —
- Monthly P&I
- —
- Monthly cashflow
- —
- DSCR
- —
- Eligible?
- —
Short-term bridge; refi at stabilization.
Rent comps 22 comps
| Address | Beds | Baths | Sqft | Rent | $/sqft | DOM | Units | Dist |
|---|---|---|---|---|---|---|---|---|
| 207 Friedheim Rd Rock Hill, SC | 3.0 | 1.0 | 1000 | $1,549 | $1.55 | 2d | 1 | 0.28mi |
| 316 Little St Rock Hill, SC | 2.0 | 1.0 | 725 | $1,150 | $1.59 | 21d | 1 | 0.62mi |
| 175 W Black St Unit 211 Rock Hill, SC | 1.0 | 1.0 | 824 | $1,440 | $1.75 | 23d | 1 | 0.81mi |
| 175 W Black St Rock Hill, SC | 1.0–2.0 | 1.0–2.0 | 1021 | $1,685 | $1.65 | 20d | 11 | 0.81mi |
| 216 McFadden St Rock Hill, SC | 2.0 | 2.0 | 984 | $1,450 | $1.47 | 14d | 1 | 0.83mi |
| 810 S York Ave Rock Hill, SC | 1.0–3.0 | 1.0 | 787 | $1,249 | $1.59 | 2d | 10 | 0.85mi |
| 108 E Main St Rock Hill, SC | 1.0–2.0 | 1.0–2.0 | 779 | $1,893 | $2.43 | 1d | 7 | 0.94mi |
| 234 Saluda St Rock Hill, SC | 1.0 | 1.0 | 528 | $950 | $1.80 | 14d | 1 | 0.96mi |
| 1547 Caprine CT Rock Hill, SC | 1.0–3.0 | 1.0–2.0 | 959 | $1,478 | $1.54 | 1d | 15 | 1.06mi |
| 117 E White St Rock Hill, SC | 2.0 | 1.0–2.0 | 797 | $2,065 | $2.59 | 3d | 33 | 1.08mi |
| 371 Technology Center Way Rock Hill, SC | 1.0–2.0 | 1.0–2.0 | 832 | $2,155 | $2.59 | 3d | 37 | 1.12mi |
| 378 Technology Center Way Rock Hill, SC | 1.0 | 1.0 | 622 | $1,720 | $2.77 | 3d | 7 | 1.20mi |
| 1128 Westover Cir Rock Hill, SC | 3.0 | 1.0 | 1119 | $1,495 | $1.34 | 23d | 1 | 1.21mi |
| 130 Reid St Rock Hill, SC | 1.0 | 1.0 | 600 | $1,075 | $1.79 | 10d | 1 | 1.25mi |
| 130 Reid St Rock Hill, SC | 1.0 | 1.0 | 600 | $1,075 | $1.79 | 23d | 1 | 1.25mi |
| 116 S Spruce St Apt B Rock Hill, SC | 2.0 | 2.0 | 850 | $1,235 | $1.45 | 23d | 1 | 1.27mi |
| 116 S Spruce St Unit A Rock Hill, SC | 2.0 | 2.0 | 850 | $1,200 | $1.41 | 20d | 1 | 1.27mi |
| 542 E Black St Rock Hill, SC | 2.0 | 1.0 | 850 | $1,595 | $1.88 | 21d | 1 | 1.36mi |
| 542 E Black St Rock Hill, SC | 2.0 | 1.0 | 850 | $1,595 | $1.88 | 4d | 1 | 1.36mi |
| 987 Pebble Rd Rock Hill, SC | 3.0 | 1.0 | 1044 | $1,295 | $1.24 | 23d | 1 | 1.39mi |
| 658 Arch Dr Rock Hill, SC | 3.0 | 1.0 | 985 | $1,700 | $1.73 | 4d | 1 | 1.43mi |
| 418 Pickens Ct Rock Hill, SC | 2.0 | 2.0 | 1060 | $1,800 | $1.70 | 23d | 1 | 1.45mi |
Listing history 23 events
-
2026-06-18days on market $120,000 Active 29 DOM
-
2026-06-17days on market $120,000 Active 28 DOM
-
2026-06-16days on market $120,000 Active 27 DOM
-
2026-06-15days on market $120,000 Active 26 DOM
-
2026-06-13days on market $120,000 Active 24 DOM
-
2026-06-09days on market $120,000 Active 20 DOM
-
2026-06-08days on market $120,000 Active 19 DOM
-
2026-06-07days on market $120,000 Active 18 DOM
-
2026-06-04days on market $120,000 Active 15 DOM
-
2026-06-03days on market $120,000 Active 14 DOM
-
2026-06-02days on market $120,000 Active 13 DOM
-
2026-06-01days on market $120,000 Active 12 DOM
-
2026-05-31days on market $120,000 Active 11 DOM
-
2026-05-23historical $1,099
-
2026-05-20$120,000 Active
-
2026-04-09price $1,099
-
2026-01-06price $1,150
-
2025-12-31price $1,199
-
2025-11-07price $1,250
-
2025-10-11$1,300
-
2025-10-10historical $1,300
-
2025-10-10$1,300
-
1994-01-26soldstatus $200,000
ⓘ Source: listings_history table (triggers on properties + properties_extension) + one-shot
backfill from property_details.listing_events for pre-trigger history.
Tax reassessment forecast SC · Resets to sale price
- Current annual tax
- $974 · $81/mo
- Projected year-2 tax
- $974 · $81/mo
- Expected delta
- $0/yr ($0/mo · 0.0%)
ⓘ Screening estimate from a state-policy table — verify with the county assessor before closing.
Climate risk First Street
- Flood 1/10 Low FEMA zone X (unshaded) · 0% chance over 30 yrs
- Wildfire 3/10 Moderate
- Heat 6/10 Major 7 d/yr ≥105°F today · 16 d/yr by 30 yrs out
- Wind 6/10 Major 27% chance of damaging wind over 30 yrs
- Air quality 3/10 Moderate 2 unhealthy d/yr today · 3 by 30 yrs out
Nearby sold comps map
Loading sold comps map…
Walkable amenities ~0.75 mi
Loading nearby amenities…
Taxation est. · year 1
- Rental income
- $18,121
- − Mortgage interest
- −$6,722
- − Property taxes
- −$974
- − Insurance
- −$600
- − Repairs & maintenance
- −$1,450
- − Management
- −$1,450
- − Depreciation
- −$3,491
- Taxable income
- $3,436
- Est. tax owed @ 24.0%
- −$825
- After-tax cash flow
- $4,366/yr
For passive investors: Depreciation is non-cash, so a rental often shows a tax loss while cash-flowing — sheltering income. Rental losses are passive: they offset passive income freely, and up to $25,000/yr can offset ordinary (W-2) income if you actively participate and your MAGI is under $100k (phasing out to $0 by $150k); unused losses carry forward. On sale, claimed depreciation is recaptured at up to 25%, and gains may owe capital-gains tax (a 1031 exchange can defer both). Figures are a year-1 estimate at your 24.0% rate — not tax advice; consult a CPA.
Schools (NCES district)
- District
- York 03
- NCES district ID
- 4503870
- Math proficiency
- 36% ▼ -8.00%
- Reading proficiency
- 47% ▲ 3.00%
- Median HH income
- $47,570
- Composite
- 35.46/100
- National rank
- #4928
- State rank
- #32 of 80 in SC
Livability — Rock Hill
- Score
- 70/100
- State rank
- #62
- US rank
- #7573
Category grades
Schools grade is shown separately in the Schools card above.
Census & demographics
- Census place
- Rock Hill, SC
- County
- York County · 281,758 people
- City population
- 115,874
- Metro
- Charlotte-Concord-Gastonia, NC-SC
- Population (ZIP)
- 58,199
- Household income
- $68,543
- Rent vs Own
- Severe rent burden
- 1869.0
Population outlook (York County) Hauer SSP2
- Today (2025)
- 307,757 people
- By 2030
- 335,979 · +9.2%
- By 2040
- 391,378 · +27.2%
- By 2050
- 443,234 · +44.0%
- By 2075
- 557,102 · +81.0%
- By 2100
- 625,837 · +103.4%
Race, ethnicity, and origin ACS 2023
- Neighborhood character
- Diverse neighborhood (Simpson 0.59)
- Race & ethnicity
- White 51% Black 39% Hispanic / Latino 4% Two or more races 4% Native American 2% Asian 1%
- Common ancestry
- Serbian 2% Slovak 2% Lithuanian 1%
- Foreign-born
- 4% · Canada, Vietnam, China
- Languages at home
- 95% English-only · Spanish 3%
Political lean MEDSL · York
- 2024 margin
- R (+19.1) · D 39.7% · R 58.8% · Other 1.5%
- 2008→2024 swing
- -1.4pp toward R · 2008: -17.7pp · 2024: -19.1pp
- All cycles
- 2024: R+19.1 2020: R+16.5 2016: R+22.1 2012: R+20.5 2008: R+17.7
Not yet ingested
- Civics
- —
Market trends
- HPI YoY
- ▼ -285.91%
- Current HPI
- 268.2609
- Rent YoY
- ▲ 5.53%
- Metro
- Charlotte-Concord-Gastonia, NC-SC
- State GDP YoY
- ▲ 4.51%
- F500 in state
- 2
Industry mix (Fortune 500 HQ in SC)
| Industry | F500 HQs | Revenue |
|---|---|---|
| Packaging | 1 | $7B |
|
||
Price history
-99.5% since first listed10 events — show timeline
- 2026-05-23 Rental Removed $1,099 TENANTTURNER2
- 2026-05-20 Listed $120,000 CANOPYMLS as Distributed by MLS Grid
- 2026-04-09 Price Changed $1,099 TENANTTURNER2
- 2026-01-06 Price Changed $1,150 TENANTTURNER2
- 2025-12-31 Price Changed $1,199 TENANTTURNER2
- 2025-11-07 Price Changed $1,250 TENANTTURNER2
- 2025-10-11 Listed for Rent $1,300 TENANTTURNER2
- 2025-10-10 Rental Removed $1,300 APPFOLIO
- 2025-10-10 Listed for Rent $1,300 APPFOLIO
- 1994-01-26 Sold (Public Records) $200,000 Public Records
Property tax history
+2.6%/yrLatest (2025): $974 · +11.7% YoY. Source: county tax records.
Cash-flow waterfall
monthlySold comps — $/sqft
last 12 mo · ≤1 miLoading sold comps…