 Multi-family
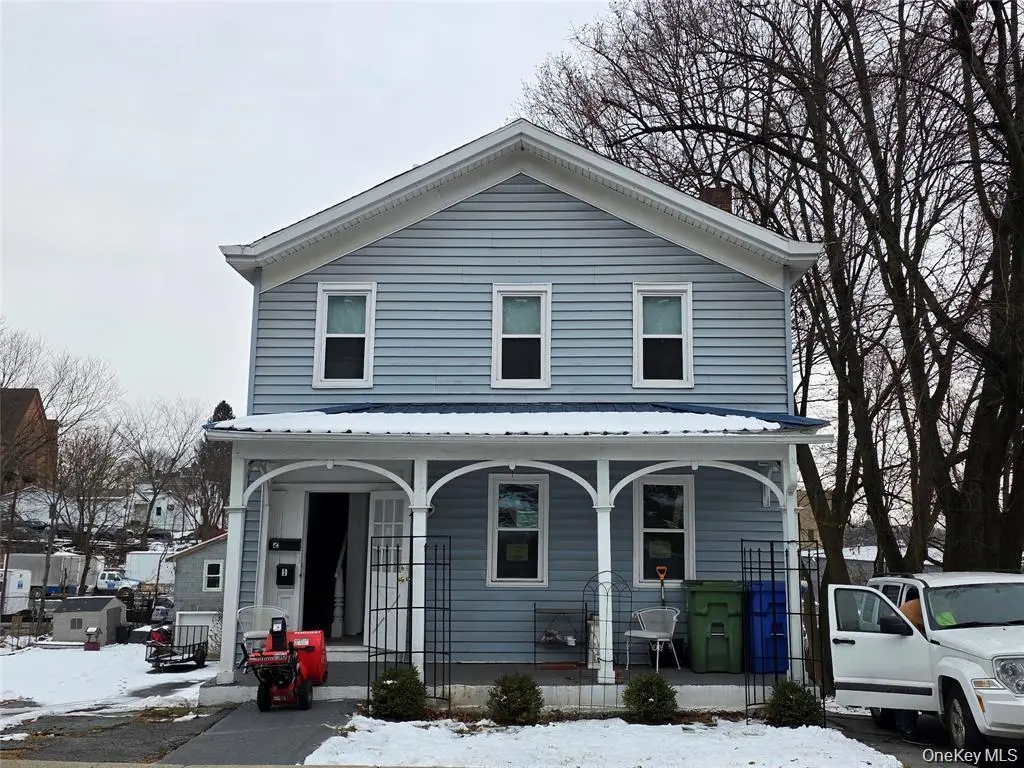
25 Mill St · Middletown, NY
Flood risk 6/10 · Moderate
- FEMA flood zone
- X (unshaded)
- Chance of flooding over 30 yrs
- 0.72%
- Est. flood insurance / yr
- $473 – $860
Fire risk 3/10 · Minor
- Est. fire insurance / yr
- $691 – $1,283
Heat risk 5/10 · Moderate
- Hot days now (above 100°F)
- 7 days/yr
- Hot days in 30 yrs
- 16 days/yr
Wind risk 4/10 · Minor
- Chance of severe wind over 30 yrs
- 10.0%
Air-quality risk 2/10 · Minimal
- Unhealthy air days now
- 1 days/yr
- Unhealthy air days in 30 yrs
- 2 days/yr
Risk factors via First Street. Map © Google.
Why this score? — see what drove the C+ grade
The composite is a weighted blend of 9 inputs, each scored 0–100. Each bar is that input's sub-score; the figure is the points it added to the 100-point composite (weight × sub-score).
- Cash flow +22.3/30.0
- ARV discount +10.2/15.0
- DSCR +7.2/10.0
- 1% rule +5.6/10.0
- Rent growth +4.6/5.0
- Schools +4.2/10.0
- Livability +4.1/5.0
- Condition / age +2.5/5.0
- Appreciation +0.0/10.0
$399,900
🖨 Deal sheet 📄 Offer letter ✓ Due diligence
Multi-family units
County records classify this as Multi-Family (2-4 Unit). Listing-text estimate: 1 unit. estimate disagrees with records
Listing remarks
Completely renovated two-unit property with Residential/CMU zoning. Ideal opportunity for an owner-user or investor — operate your business on the first floor while generating rental income from the occupied second-floor unit. Property includes 2 car parking/off-street parking, with potential for expansion subject to city approvals.
Key facts
- Off-street parking
- 5,375 sq ft lot
- Built 1900
Tags
Property features AI
Exterior
- Parking: Driveway parking; Off-street parking
- Utilities: Public sewer; Cable connected; Electricity connected; Natural gas connected
- Home design: Duplex
- Construction: Frame construction
- Exterior features: Frame construction; Not waterfront; No additional parcels
Interior
- Bedrooms: Two 2-bedroom units (multi-unit duplex configuration)
- Bathrooms: Two full bathrooms
- Heating & cooling: Baseboard heating (natural gas); No central cooling
- Interior features: Built-in storage; Unfinished walk-out basement with additional storage space
Neighborhood map
What this means for you Summary
Snapshot
- This is a 3-bed/2.0-bath multifamily listed at $400k.
Deal economics
- At list price, monthly cash flow is $661 ($8k/yr) — positive.
- The deal already cash-flows at list — no discount required.
- Meets the 1% rule at list price ($4k rent vs $400k).
- Recommended offer: $388k (3.0% below list) — sets the bar for market timing.
- Cap rate 8.3% vs local median 3.3% in Middletown — top-decile yield for the area; either an underpriced asset or a hidden risk that comps aren't pricing in. Stress-test before assuming the spread holds.
Location & tenants
- Location reads 82/100 on livability (#79 in NY, #1,219 nationally) — a professional / high-income tenant draw. Strengths: amenities A+, housing A+, health & safety A+; Watch: commute C-.
- Middletown City School District (suburban): math 41% / reading 55% proficiency, ranked #411 of 590 in NY (top 70%) — families likely to look elsewhere, expect single-tenant / working-renter base with shorter leases; 61% free/reduced lunch — lower-income household profile, screen leases tightly.
- Zoned schools: Maple Hill Elementary School (math 32% / reading 38%, grade F, #1,569 of 2,108 statewide, top 75%, 1,012 students, 80% FRL); Middletown Twin Towers Middle School (math 10% / reading 42%, grade F, #595 of 729 statewide, top 82%, 858 students, 78% FRL); Middletown High School (math 90% / reading 92%, grade A+, #203 of 1,100 statewide, top 20%, 2,523 students, 71% FRL) — zoned schools average 76% FRL vs 61% district-wide (15 pts higher); higher-poverty schools than district average — tighter screening recommended.
- Market conditions: Rents rising fast (+8.2%/yr); 273 active listings in the ZIP; 16 comparable units currently listed for rent nearby; rentals lingering (median 44d on market — plan ~5-8 weeks vacancy on turnover, expect pricing pressure); 50% of comp listings sitting > 30 days — soft ceiling on asking rent; solid renter incomes; 1,746 units permitted in Orange County in 2024 (1,265 in 5+ unit buildings).
- At $4,239/mo this rent would consume 58% of the median local household income ($87k/yr) (locally 1846% of renters already pay >50% of income on rent) — very limited rent-growth headroom before tenants either downsize or default.
Forward outlook
- Local home prices are declining (-3.0%/yr); year-one equity from $3k of loan paydown is wiped out by about $12k of value loss. Plan a longer hold.
- At projected returns (-3.0% appreciation + 8.0% rent growth), your $112k cash investment doubles in ~9 years — after that, you're playing with house money.
Negotiation context
- It's been on market 31 days — a 3% lower offer ($388k) is reasonable based on typical stale-listing flexibility.
- Current owner paid $80k; list at $400k implies a 400% gain — meaningful room to come down on a strong offer.
Risks & watch-outs
- Watch-outs: built in 1900 — expect roof / HVAC / electrical / plumbing capex.
- Climate carrying-cost: major flood risk; extreme-heat days projected 7→16/yr by 2055 (HVAC capex compounding) — expect insurance premiums to compound above CPI over the hold.
Questions for the listing agent
- It's been on market 31 days. Have you received any prior offers? Is the seller open to a 3% concession, seller financing, or rate buy-down credit?
- Built in 1900 — when were the roof, HVAC, electrical panel, plumbing, and water heater last replaced?
- Is there a deadline driving the sale (1031 exchange, divorce, estate, relocation)? That informs how much negotiation room exists.
- Schools are D-rated, which usually means shorter tenancies and higher turnover. Who's the typical renter profile here, and what's been the actual vacancy rate?
- What's the average days-on-market for RENTAL listings here right now (not sales)? A rising rental-DOM trend means longer vacancies and softer asking-rent achievability than the comps imply.
- What's the recent tenant-quality profile in this submarket — average credit score on applications, eviction rate, late-payment / NSF rate, and stable-employment percentage? A property-management company in the area should have these aggregated.
- How much new apartment / multifamily construction is in the pipeline within 1–3 miles? Heavy new supply (>2% of stock underway) typically softens rents 12–24 months out; light construction supports rent growth.
Investment metrics
- 1% rule
- 1.06% ✓
- Cap rate
- 8.28%
- Cash-on-cash
- 7.09%
- DSCR
- 1.32
- GRM
- 7.9
CMA / ARV
- ARV (on-the-fly)
- $424,944
- Comps found
- 4
Show comp detail 4 sales within ~0.75 mi
| Address | Dist | Beds/Ba | Sqft | Sold | Price | $/sf | Match |
|---|---|---|---|---|---|---|---|
| 35 East Ave | 0.32mi | 3/2.0 | 1,939 (+4%) | 2mo | $440,000 | $227 | 77 |
| 48 Mulberry St | 0.16mi | 4/2.0 (+1) | 2,076 (+11%) | 16mo | $340,000 | $164 | 56 |
| 20 California Ave | 0.43mi | 4/2.0 (+1) | 2,016 (+8%) | 13mo | $350,000 | $174 | 51 |
| 31 Beattie Ave | 0.72mi | 4/2.0 (+1) | 1,668 (-11%) | 6mo | $385,000 | $231 | 38 |
Match score weights: distance 35% · size 25% · config 20% · recency 20%. Top-matched comps best support the ARV.
Projected returns pro-forma
-3.0% appreciation · 8.0% rent growth · sell at horizon
- IRR
- -0.1%
- Equity multiple
- 1.00×
- Total profit
- $-256
- Equity at exit
- $59,626
- IRR
- 14.1%
- Equity multiple
- 2.39×
- Total profit
- $156,051
- Equity at exit
- $34,576
Cash invested: $111,972 (down + closing). Projections, not guarantees.
Landlord ↔ Tenant lean methodology
- Overall (STATE)
- 15 Strongly Tenant-Friendly
- State New York
- 15 Strongly Tenant-Friendly · D+10
- County
- — inherits STATE
- City
- — inherits STATE
ZIP-level market 10940
- Home prices YoY
- -18.7%
- Rents YoY
- 8.2%
- Active inventory
- 273
- Price-to-rent
- 14.3×
Monthly cashflow live
- Estimated rent
- $4,239 high interval (Pro) →
- Mortgage (P&I)
- −$2,097
- Tax from tax record
- −$424 /mo · $5,084/yr
- Insurance
- −$167
- HOA
- −$0
- Vacancy / Maint / Mgmt
- −$890
- Net cashflow
- $661
Break-even live
2-unit breakdown (identical units grouped — click to expand)
| Units | Beds | Baths | Est. rent |
|---|---|---|---|
| 1× unit | 3 | 1 | $2,329 |
| 1× unit | 1 | 1 | $1,910 |
| Total (2 units) | $4,239 | ||
UW: 25.0% down · 7.5% · 30yr · 1.5% tax · 5.0% vac · 8.0% maint · 8.0% mgmt
Financing live
Cash to close
- Down payment
- $99,975
- Closing costs
- $11,997
- Reserves months
- —
- Total cash needed
- —
Loan-product check · same deal, 3 products live
Conventional
25% down · 7.5% · 30yr
- Down + closing
- —
- Monthly P&I
- —
- Monthly cashflow
- —
- DSCR
- —
- Eligible?
- —
Personal DTI + credit; lowest rate.
DSCR
20% down · 8.5% · 30yr
- Down + closing
- —
- Monthly P&I
- —
- Monthly cashflow
- —
- DSCR
- —
- Eligible?
- —
No personal income docs; deal must DSCR.
Hard money
10% down · 12.0% · 12mo
- Down + closing
- —
- Monthly P&I
- —
- Monthly cashflow
- —
- DSCR
- —
- Eligible?
- —
Short-term bridge; refi at stabilization.
Rent comps 16 comps
| Address | Beds | Baths | Sqft | Rent | $/sqft | DOM | Units | Dist |
|---|---|---|---|---|---|---|---|---|
| 26 Mill St Middletown, NY | 3.0 | 2.0 | 1300 | $2,600 | $2.00 | 23d | 1 | 0.04mi |
| 26 Mill St Unit 2 Middletown, NY | 3.0 | 2.0 | 1300 | $2,600 | $2.00 | 43d | 1 | 0.04mi |
| 7 Mulberry St Middletown, NY | 4.0 | 1.5 | 1696 | $2,800 | $1.65 | 44d | 1 | 0.09mi |
| 26 Washington St Unit 2 Middletown, NY | 3.0 | 1.0 | 2274 | $2,100 | $0.92 | 43d | 1 | 0.29mi |
| 8 Roberts St Unit 2-A Middletown, NY | 2.0 | 1.0 | 2132 | $2,000 | $0.94 | 23d | 1 | 0.39mi |
| 30 Knapp Ave Middletown, NY | 2.0 | 1.0 | 1532 | $1,800 | $1.17 | 43d | 1 | 0.40mi |
| 39 Crescent Pl Middletown, NY | 3.0 | 1.0 | 1278 | $2,500 | $1.96 | 23d | 1 | 0.42mi |
| 90 Washington St Unit 92 Middletown, NY | 2.0 | 1.0 | 1600 | $2,500 | $1.56 | 23d | 1 | 0.65mi |
| 14 Smith St Middletown, NY | 3.0 | 2.0 | 1852 | $3,600 | $1.94 | 13d | 1 | 0.65mi |
| 132 Prospect Ave Middletown, NY | 3.0 | 1.0 | 1240 | $2,300 | $1.85 | 43d | 1 | 0.90mi |
| 105 Woodlake Dr Middletown, NY | 2.0 | 2.5 | 2161 | $3,000 | $1.39 | 43d | 1 | 0.93mi |
| 184 Highland Ave Middletown, NY | 4.0 | 2.0 | 1486 | $3,500 | $2.36 | 23d | 1 | 0.96mi |
| 186 Highland Ave Unit 1 Middletown, NY | 3.0 | 2.0 | 2160 | $2,800 | $1.30 | 43d | 1 | 0.97mi |
| 225 Monhagen Ave Middletown, NY | 3.0 | 1.0 | 1466 | $2,700 | $1.84 | 13d | 1 | 1.10mi |
| 52 Horton Ave Middletown, NY | 3.0 | 2.5 | 2340 | $3,000 | $1.28 | 43d | 1 | 1.11mi |
| 169 Excelsior Ave Middletown, NY | 3.0 | 1.5 | 1450 | $2,800 | $1.93 | 13d | 1 | 1.15mi |
Listing history 19 events
-
2026-06-18days on market $399,900 Active 31 DOM
-
2026-06-17days on market $399,900 Active 30 DOM
-
2026-06-16days on market $399,900 Active 29 DOM
-
2026-06-15days on market $399,900 Active 28 DOM
-
2026-06-14days on market $399,900 Active 26 DOM
-
2026-06-13days on market $399,900 Active 25 DOM
-
2026-06-10days on market $399,900 Active 23 DOM
-
2026-06-09days on market $399,900 Active 22 DOM
-
2026-06-08days on market $399,900 Active 21 DOM
-
2026-06-07days on market $399,900 Active 20 DOM
-
2026-06-05days on market $399,900 Active 17 DOM
-
2026-06-03days on market $399,900 Active 16 DOM
-
2026-06-02days on market $399,900 Active 15 DOM
-
2026-06-01days on market $399,900 Active 14 DOM
-
2026-05-31days on market $399,900 Active 13 DOM
-
2026-05-30days on market $399,900 Active 12 DOM
-
2026-05-18$399,900 Active
-
2004-05-12soldstatus $80,000
-
1987-05-08soldstatus $52,500
ⓘ Source: listings_history table (triggers on properties + properties_extension) + one-shot
backfill from property_details.listing_events for pre-trigger history.
Tax reassessment forecast NY · Partial reset (capped growth)
- Current annual tax
- $5,084 · $424/mo
- Projected year-2 tax
- $5,921 · $493/mo
- Expected delta
- +$837/yr (+$70/mo · 16.5%)
ⓘ Screening estimate from a state-policy table — verify with the county assessor before closing.
Climate risk First Street
- Flood 6/10 Major FEMA zone X (unshaded) · 72% chance over 30 yrs
- Wildfire 3/10 Moderate
- Heat 5/10 Major 7 d/yr ≥100°F today · 16 d/yr by 30 yrs out
- Wind 4/10 Moderate 10% chance of damaging wind over 30 yrs
- Air quality 2/10 Low 1 unhealthy d/yr today · 2 by 30 yrs out
Nearby sold comps map
Loading sold comps map…
Walkable amenities ~0.75 mi
Loading nearby amenities…
Taxation est. · year 1
- Rental income
- $50,868
- − Mortgage interest
- −$22,401
- − Property taxes
- −$5,084
- − Insurance
- −$2,000
- − Repairs & maintenance
- −$4,069
- − Management
- −$4,069
- − Depreciation
- −$11,633
- Taxable income
- $1,612
- Est. tax owed @ 24.0%
- −$387
- After-tax cash flow
- $7,550/yr
For passive investors: Depreciation is non-cash, so a rental often shows a tax loss while cash-flowing — sheltering income. Rental losses are passive: they offset passive income freely, and up to $25,000/yr can offset ordinary (W-2) income if you actively participate and your MAGI is under $100k (phasing out to $0 by $150k); unused losses carry forward. On sale, claimed depreciation is recaptured at up to 25%, and gains may owe capital-gains tax (a 1031 exchange can defer both). Figures are a year-1 estimate at your 24.0% rate — not tax advice; consult a CPA.
Schools (NCES district)
- District
- Middletown City School District
- NCES district ID
- 3619320
- Math proficiency
- 41% ▼ -2.00%
- Reading proficiency
- 55% ▲ 19.00%
- Median HH income
- $54,612
- Composite
- 41.52/100
- National rank
- #3453
- State rank
- #411 of 590 in NY
Livability — Middletown
- Score
- 82/100
- State rank
- #79
- US rank
- #1219
Category grades
Schools grade is shown separately in the Schools card above.
Census & demographics
- Census place
- Middletown, NY
- County
- Orange County · 267,004 people
- City population
- 68,033
- Metro
- Poughkeepsie-Newburgh-Middletown, NY
- Population (ZIP)
- 53,611
- Household income
- $87,080
- Rent vs Own
- Severe rent burden
- 1846.0
Population outlook (Orange County) Hauer SSP2
- Today (2025)
- 379,830 people
- By 2030
- 378,955 · -0.2%
- By 2040
- 375,444 · -1.2%
- By 2050
- 369,311 · -2.8%
- By 2075
- 354,233 · -6.7%
- By 2100
- 318,150 · -16.2%
Race, ethnicity, and origin ACS 2023
- Neighborhood character
- Highly diverse neighborhood (Simpson 0.70)
- Race & ethnicity
- White 39% Hispanic / Latino 32% Black 20% Two or more races 13% Asian 4% Native American 3%
- Hispanic origin (detail)
- Mexican 9% Puerto Rican 13% Dominican 3%
- Common ancestry
- Romanian 3% Italian 1% Iranian 1%
- Foreign-born
- 18% · Canada, China, Jamaica
- Languages at home
- 72% English-only · Spanish 21% Other Indo-European 2% Chinese 1%
Political lean MEDSL · Orange
- 2024 margin
- Lean R (+8.4) · D 45.8% · R 54.2%
- 2008→2024 swing
- -12.5pp toward R · 2008: 4.1pp · 2024: -8.4pp
- All cycles
- 2024: R+8.4 2020: R+0.2 2016: R+6.5 2012: D+5.2 2008: D+4.1
Not yet ingested
- Civics
- —
Market trends
- HPI YoY
- ▼ -71.68%
- Current HPI
- 311.5969
- Rent YoY
- ▲ 8.23%
- Metro
- Poughkeepsie-Newburgh-Middletown, NY
- State GDP YoY
- ▲ 2.60%
- F500 in state
- 92
Industry mix (Fortune 500 HQ in NY)
| Industry | F500 HQs | Revenue |
|---|---|---|
| Financial Services | 10 | $950B |
|
||
| Consumer Goods | 9 | $162B |
|
||
| Insurance | 4 | $225B |
|
||
| Telecommunications | 2 | $144B |
|
||
| Pharmaceuticals | 2 | $112B |
|
||
| Media / Entertainment | 2 | $69B |
|
||
Price history
+661.7% since first listed3 events — show timeline
- 2026-05-18 Listed $399,900 OneKey® MLS as Distributed by MLS Grid
- 2004-05-12 Sold (Public Records) $80,000 Public Records
- 1987-05-08 Sold (Public Records) $52,500 Public Records
Property tax history
+8.7%/yrLatest (2025): $5,084 · -1.0% YoY. Source: county tax records.
Cash-flow waterfall
monthlySold comps — $/sqft
last 12 mo · ≤1 miLoading sold comps…